Enhancing the Efficiency of Finned Photovoltaic Thermal Collectors Using Al2O3, CuO, and TiO2 Nano-Fluids: A Comprehensive Study on Thermal and Electrical Performance Optimization

Rendy Adhi Rachmanto![]() | Zainal Arifin*
| Zainal Arifin*![]() | Singgih Dwi Prasetyo
| Singgih Dwi Prasetyo![]() | Muhammad Salman Alfaridzi
| Muhammad Salman Alfaridzi![]() | Noval Fattah Alfaiz
| Noval Fattah Alfaiz![]() | Mohd Afzanizam Mohd Rosli
| Mohd Afzanizam Mohd Rosli![]()
© 2025 The authors. This article is published by IIETA and is licensed under the CC BY 4.0 license (http://creativecommons.org/licenses/by/4.0/).
OPEN ACCESS
Energy has been essential in economic and human development worldwide over the past few decades. However, using conventional energy, especially from fossil fuels, has led to negative impacts such as air pollution, climate change, and dependence on non-renewable energy sources. Indonesia's position along the equator offers significant potential for harnessing solar energy. However, the electrical performance of photovoltaic (PV) panels tends to decline as their operating temperature rises. To address this, photovoltaic thermal collectors (PV/T), thermal collectors placed beneath the panels' surface, are employed to lower the PVs' operating temperature. This approach aims to enhance the cooling and overall efficiency of solar cells. This research will study the cooling of PV panels using nano-fluid with variations of Al2O3, CuO, and TiO2. The findings indicate that varying the type of nanofluid can enhance the heat transfer rate within the photovoltaic thermal collector (PV/T) system. The thermal efficiencies recorded for the PV/T system using Al2O3, CuO, and TiO2 as coolants were 69.71%, 73.11%, and 71.75%, respectively. Correspondingly, the electrical efficiencies achieved were 10.12%, 13.26%, and 12.17%. From this study, it can be seen that CuO nano-fluid has a better cooling configuration than others.
photovoltaic thermal collectors, nano-fluids, Al2O3, CuO, TiO2, thermal efficiency, electrical efficiency, cooling optimization, renewable energy
The rapid growth and advancement of the modern population have driven an increased demand for energy worldwide [1]. Currently, fossil fuels such as coal and petroleum, which are non-renewable and harmful to the environment, account for approximately 80% of the global energy supply [2]. By 2030, global energy demand will increase by 1.5% annually [3]. In 2019, fossil fuels accounted for 42% of Indonesia's final energy consumption. Due to this increasing demand, fossil energy supplies are decreasing [4]. To meet this increasing energy demand, efforts can be made to replace non-renewable energy with renewable energy [5]. Solar energy is a promising renewable resource with great potential for development, as it is accessible nationwide and available daily [6]. Solar energy is environmentally friendly because it does not produce air pollution and remains available as long as there is life [7]. Among the existing technologies, PV panels are the right technology for solar energy utilization. Indonesia has a lot of potential for renewable energy, especially solar energy, because it has an average radiation intensity of 4.8 kW/m2/day [8, 9]. Although solar energy is emitted in the form of radiation, not all of it reaches the Earth's surface [10]. The energy emitted is heat and light, and the PV panel captures solar energy and converts it into electrical power and heat [11].
The advancement of technology, solar cells have developed into three generations, namely the first generation of solar cells made of silicon, the second generation of solar cells from thin films (Thin Film Solar Cell), and the third generation of solar cells that are sensitized by dyes (Dye Synthesized Solar Cell) [12]. The first generation made of silicon has the best efficiency level, but the price of production and maintenance is expensive. Then, thin film solar cells produced countercurrent silicon (amorphous silicon). After that, DSSC (Dye-Sensitized Solar Cell) has several advantages such as chemical flexibility, ease of synthesis, and environmental friendliness [13]. For now, silicon solar cells are most widely used because they have higher efficiency than other types. Monocrystalline silicon solar cells have an efficiency of 17%-18%, and polycrystalline silicon solar cells have an efficiency of 12%-14% [14]. The efficiency of solar cells may also decrease as the open circuit voltage parameters and power output decrease due to temperature increase. As the temperature of photovoltaic (PV) panels rises, their efficiency and heat transfer capabilities decline. Implementing cooling methods for PV panels can help improve their efficiency [15].
Accurate temperature regulation is critical to maintaining the operational performance of photovoltaic (PV) panels. Empirical data indicate that PV panel efficiency deteriorates by approximately 0.5% for every 1℃ increment in temperature [16]. Consequently, implementing effective cooling strategies is imperative to counteract thermal-induced efficiency losses and sustain optimal photovoltaic performance. A cooling system on PV panels will increase electrical efficiency, extend life, and prevent cell damage [17]. Several PV panel cooling processes exist. The photovoltaic thermal collector (PV/T) system operates on the forced convective heat transfer principle, achieved by circulating a working fluid through pipes installed beneath the photovoltaic (PV) panels. This mechanism facilitates the efficient removal of heat from the PV module, enhancing its thermal management and overall performance [18]. The majority of PV panels have thermal collectors installed behind them. As the temperature of the photovoltaic (PV) panel rises, the heat transfer rate to the thermal collector correspondingly increases. Consequently, the collector acts as an efficient coolant, reducing the PV panel temperature by maximizing heat extraction, facilitating enhanced thermal energy generation. [19].
The working fluid is essential to the energy transfer's cooling or heating process. The working fluid flows to move the absorbed heat [20]. This working fluid can be air or water. However, working fluids in water are most often used because they perform better than air [21]. Another type is nano-fluid, a mixture of nano-sized metal particles dispersed into a base fluid. Due to their ability to improve PV/T performance, nanofluids have attracted the attention of researchers over the past few decades [22]. Nanofluids, containing nanoparticles under 100 nm, demonstrate enhanced thermal conductivity due to improved dispersion stability. This property significantly boosts heat transfer efficiency, enabling the development of more compact and practical photovoltaic thermal (PV/T) systems without compromising electrical output [23].
This research aimed to improve the thermal regulation of finned photovoltaic/thermal (PV/T) collectors by employing Al₂O₃, CuO, and TiO₂ nanofluids as the circulating working fluids. These nanofluids are intended to effectively lower the operational temperature of solar cells, thereby reducing thermal losses and enhancing overall photovoltaic efficiency. A comprehensive comparative study is performed to assess the cooling capabilities and efficiency improvements provided by each type of nanofluid and determine the most effective nanofluid formulation to optimize both thermal and electrical performance of finned PV/T collectors under realistic working conditions.
Integrating nanofluids into photovoltaic-thermal (PVT) systems is a cutting-edge strategy to improve solar energy efficiency through more effective heat management. As summarized in Table 1, various types of nanofluids such as Al₂O₃/water, CuO/water, and TiO₂/water exhibit improved heat transfer characteristics, which directly reduce the operating temperature of PV panels and increase electrical output. For example, Al₂O₃/water can lower the panel temperature by 28.1% and increase the electrical efficiency by 7.38%. At the same time, hybrid nanofluids such as Al₂O₃-CuO/water combine the advantages of thermal conductivity and fluid stability. These findings confirm the importance of selecting the proper nanofluid formulation to optimize system performance. The comparative analysis in Table 1 also shows that nanoparticle composition and base fluid type significantly influence performance parameters, which can serve as a reference in developing next-generation PVP systems that are more efficient and sustainable.
Incorporating nanofluids such as Al₂O₃, CuO, and TiO₂ into photovoltaic thermal systems offers a comprehensive approach to enhance solar energy efficiency significantly. By leveraging their superior heat transfer properties and advanced thermal management capabilities, these nanomaterials contribute to maintaining optimal operating temperatures, thereby improving solar systems' thermal and electrical performance. This integration optimizes energy conversion and supports the advancement of sustainable solar technologies, positioning nanofluids as key enablers in pursuing more efficient and reliable renewable energy solutions.
Table 1. State of the art
|
Nanofluid Type |
Base Fluid |
Key Findings |
Performance Metrics |
References |
|
Al₂O₃/water |
Water |
Improves thermal conductivity and heat transfer; lowers PV temperature. |
Up to 28.1% temp. reduction, 7.38%↑ electrical efficiency |
[24-26] |
|
CuO/water |
Water |
Enhances convective heat transfer and improves cooling efficiency. |
Significant increase in heat removal rate. |
[27, 28] |
|
TiO₂/water |
Water |
Enhances solar water distillation productivity and PVT heat transfer. |
Boosts thermal output, improves PVT productivity. |
[29, 30] |
|
Al₂O₃–CuO/water (Hybrid) |
Water |
Combines properties for higher stability and thermal conductivity than single-component nanofluids. |
Higher thermal performance, better fluid stability. |
[31-34] |
|
Various nanoparticles |
Ethylene Glycol, Oil, etc. |
Used in hybrid configurations to explore optimized thermophysical properties. |
Ongoing trials to determine optimal concentration. |
[35, 36] |
|
Al₂O₃, CuO, TiO₂ (comparative) |
Water |
Comparative studies show each material has unique thermal and electrical advantages in PVT systems. |
Tailored selection improves system efficiency. |
[37-39] |
3.1 Experimental setup
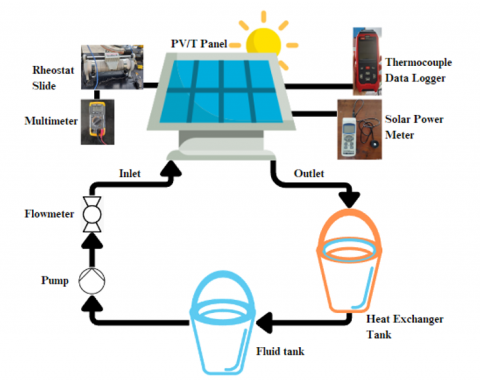
The configuration of finless, triangle fin, and rectangular fin collectors is implemented. The configuration and working principle of the Photovoltaic/Thermal (PV/T) system are schematically depicted in Figure 1. A pump starts the system by drawing water out of the reservoir and sending it via a conduit to the collector under the PV panel.
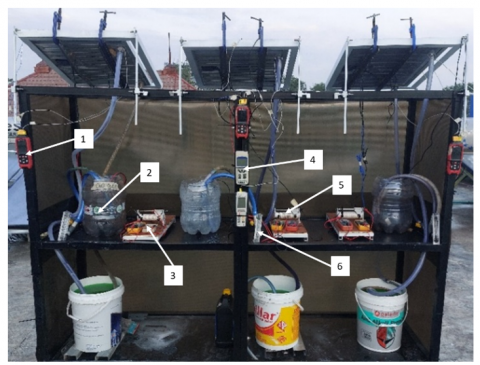
The practical application of the PV/T system is demonstrated in Figure 2, showcasing its setup in an experimental environment. The system comprises a polycrystalline photovoltaic panel, collector, pump, nanofluid reservoir, flow meter, heat exchanger tank, thermocouple data logger, multimeter, solar power meter, and rheostat slide. This experimental investigation was conducted in July 2024 at Universitas Sebelas Maret, Surakarta, Indonesia, providing real-world insights into the performance and operational characteristics of the PV/T system.
Figure 1. Scheme of the system component
Figure 2. Research tool suite
List:
3.2 System component
3.2.1 Photovoltaic panel
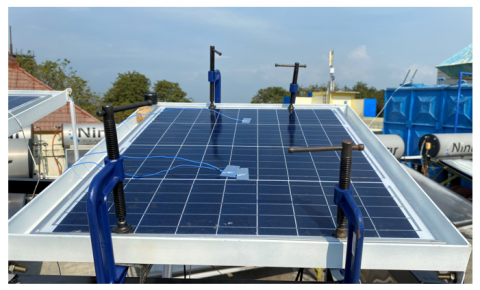
The solar panel employed in this study is a 50 Wp (Watt-peak) polycrystalline solar panel manufactured by Sunwatt. This type of solar panel offers increased efficiency because it uses polycrystalline cells, which can work in high temperatures, and has a strong square design with high durability. The Sunwatt 50 Wp Solar Panel is shown in Figure 3 and Table 2.
Figure 3. Sunwatt 50 Wp solar panel
The photovoltaic (PV) panel used in this study has a maximum power output of 50 W, corresponding maximum current and voltage values of 2.77 A and 18.0 V, respectively. Under open-circuit conditions, the panel produces a voltage of 21.24 V and a current of 3.11 A, indicating its capacity to generate power even without a connected load. The panel's overall energy conversion efficiency is 17.6%, which reflects its effectiveness in converting incident solar radiation into usable electrical energy. With physical dimensions of 670 × 530 × 30 mm, the panel is compact and suitable for integration into hybrid PV/T systems. These specifications provide a foundational understanding of the panel's electrical behavior and serve as key inputs for performance analysis and system modeling.
3.2.2 Thermal collector
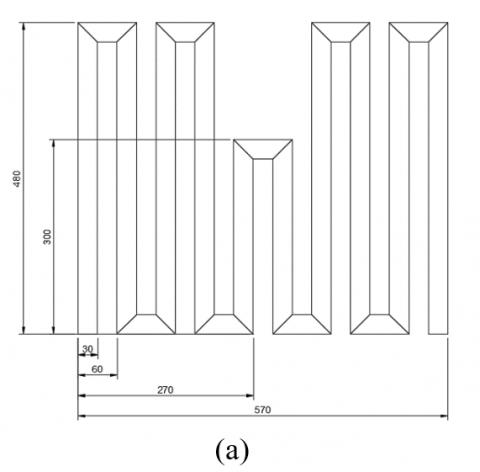
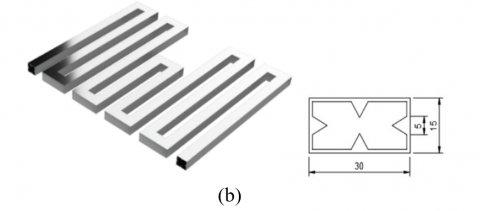
The collector pipe is designed according to the shape of the solar panel to expand the contact so that it absorbs more heat. In addition, the flow configuration is a series flow. The collector pipe used in this study is a collector pipe with a rectangular shape, as shown in Figure 4 below. Collector pipes with rectangular shapes are chosen because they have better thermal efficiency than other shapes. The specifications and dimensions of the square collector pipe utilized in this study are detailed in Table 2, providing essential parameters for the experimental setup and subsequent analysis of thermal performance.
Table 2. Collector pipe specifications
|
Specification |
Information |
|
Material |
Aluminum |
|
Cross Section Size |
0.030 m × 0.015 m |
|
Thick |
0.001 m |
|
Fin Thickness |
0.0005 m |
|
Total length |
4.61 m |
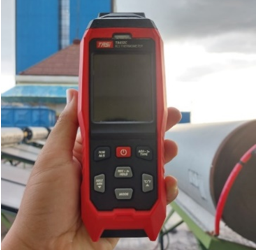
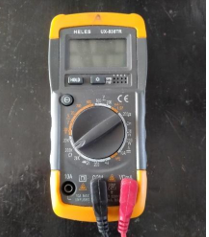
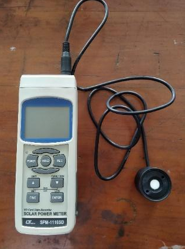
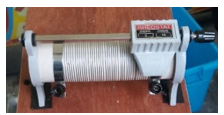
Table 3. List of components [24-27]
|
Name of Component |
Key Specifications |
Function in PV/T System |
Illustration |
|
Water Pump |
SAKKAI SKP 106, 45 W power, flow capacity up to 3500 L/h |
Circulates the working fluid within the PV/T system |
|
|
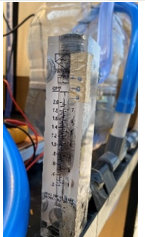
Flowmeter |
Measures up to 7 L/min; operated at 3 L/min in this study |
Measures fluid flow rate to monitor thermal transfer performance |
|
|
Thermocouple data logger |
TASI TA612C, 4 Channel, K Type Thermometer, USB |
Records the inlet and outlet temperatures of the collector and PV surface temperatures |
|
|
Multimeter |
HELES UX-838TR |
Measures voltage (V) and current (I) generated by PV panels |
|
|
Solar power meter |
Lutron SPM-1116SD, real-time logging to micro-SD |
Measures solar radiation intensity in real time |
|
|
Rheostat slide |
Variable resistor, 2 A, 50 Ohm |
Controls the electrical current in the PV circuit to simulate different load conditions |
Figure 4. Collector pipe with four fins
Table 3 lists the essential components employed in the PV/T experimental setup. These include instruments for fluid circulation, temperature measurement, electrical monitoring, and solar radiation analysis. Each element was selected based on suitability and compatibility with the system’s operational requirements. The table also outlines the specifications and functions of each device to ensure clarity and replicability of the experimental procedure.
3.3 PV efficiency analysis
Analyzing the efficiency of photovoltaic (PV) systems is essential to evaluate how effectively solar energy is converted into usable electrical and thermal energy. This efficiency is governed by various electrical and thermal parameters, which can be quantified through theoretical models and experimental data. Table 4 presents the key equations for assessing PV performance, from short-circuit current to thermal efficiency. Each parameter is critical in determining how well a solar cell transforms incident solar radiation into electrical and thermal outputs. A clear understanding of these relationships provides a systematic and quantitative foundation for optimizing the design and operation of PV systems, especially in hybrid photovoltaic/thermal (PV/T) applications.
Table 4. Equations of PV efficiency
|
Parameter |
Symbol |
Description |
Equation |
Number |
|
Short Circuit Current |
$I_{s c}$ |
Maximum current when electrical resistance is near zero [40] |
Determined experimentally from the I-V curve when voltage = 0 |
- |
|
Diode (I-V) Equation |
$I$ |
Fundamental equation describing PV cell behavior using Shockley’s diode model [41] |
$I=I_{p h}-I_0\left(e^{\frac{q V}{k_B T}}-1\right)$ |
(1) |
|
Open Circuit Voltage |
$V_{o c}$ |
Maximum voltage when no current flows through the circuit [42] |
$V_{o c}=\frac{k_B T}{q} \ln \left(1+\frac{I_{p h}}{I_0}\right)$ |
(2) |
|
Fill Factor (FF) |
$F F$ |
Indicates how efficiently the cell converts power from available current and voltage |
$F F=\frac{I_m V_m}{I_{s c} V_{o c}}=\frac{P_{\max }}{I_{s c} V_{o c}}$ |
(3) |
|
Electrical Efficiency |
$\eta_{p v}$ |
Ratio of maximum output power to incident solar radiation power [43] |
$\mathrm{\eta}_{p v}=\frac{P_{\max }}{P_{l i g h t}}=\frac{P_{\max }}{I_{r a d} \times \mathrm{A}}=\frac{I_{s c} \times V_{o c} \times F F}{I_{r a d} \times \mathrm{A}}$ |
(4) |
|
Thermal Efficiency |
$\eta_{th}$ |
Efficiency of heat recovery in a PV/T system |
$\eta_{t h}=\frac{Q_u}{I_{\text {rad }} \times A}=\frac{\dot{m} C_p\left(T_e-T_i\right)}{I_{\text {rad }} \times A}$ |
(5) |
Table 5. Heat transfer theory
|
Parameter |
Symbol |
Description |
Equation |
Number |
|
Conduction Heat Transfer |
$Q_{ {cond}}$ |
Heat transfer through a solid medium between the panel and the collector pipe |
$Q_{ {cond }}=k A \frac{\left(T_1-T_2\right)}{L}$ |
(6) |
|
Convective Heat Transfer |
$Q_{{c}}$ |
Heat transfer due to fluid motion at the surface interface |
$Q_c=h_c A_s\left(T_s-T_m\right)$ |
(7) |
|
Convective Heat Transfer (LMTD method) |
$Q_{{c}}$ |
More accurate convective heat transfer in heat exchangers using LMTD [44] |
$Q_c=h_c A \Delta T_{l m}$ |
(8) |
|
Logarithmic Mean Temp. Diff |
$\Delta T_{l m}$ |
Average practical temperature difference for convective heat exchange [45] |
$\begin{array}{r}\Delta T_{l m}=\frac{T_i-T_e}{\ln \left[\left(T_s-T_e\right) /\left(T_s-T_i\right)\right]} \\ =\frac{\Delta T_e-\Delta T_i}{\ln \left(\Delta T_e / \Delta T_i\right)}\end{array}$ |
(9) |
|
Useful Heat Transfer Rate |
$Q_u$ |
Heat is absorbed by the working fluid in the collector pipe |
$Q_u=\dot{m} C_p\left(T_e-T_i\right)$ |
(10) |
|
Mass Flow Rate |
$\dot{m}$ |
Mass flow rate of the working fluid |
$\dot{m}=\rho \dot{V}$ |
(11) |
|
Thermal Efficiency |
$\eta_{t h}$ |
Ratio of sound thermal energy to incident solar energy |
$\eta_{t h}=\frac{Q_u}{G \times A_m}=\frac{\dot{m} C_p\left(T_e-T_i\right)}{G \times A_m}$ |
(12) |
|
Reynolds Number |
$R e$ |
Dimensionless number indicating flow regime (laminar or turbulent) |
$R e=\frac{\rho v D_H}{\mu}$ |
(13) |
|
Nusselt Number |
$N u$ |
Dimensionless number indicating convection enhancement |
$N u=\frac{h_c D_H}{k}$ |
(14) |
Table 6. Thermophysical parameter equations
|
Parameter |
Symbol |
Description |
Equation |
Number |
|
Nanofluid Density |
$\rho_{n f}$ |
Density calculated as a weighted average of the base fluid and nanoparticles |
$\rho_{n f}=(1-\emptyset) \rho_{b f}+\emptyset \rho_{n p}$ |
(15) |
|
Nanofluid Viscosity |
$\mu_{n f}$ |
Viscosity for low-volume fractions (e.g., 2.5%) based on Einstein's model |
$\mu_{n f}=(1+2.5 \emptyset) \mu_{b f}$ |
(16) |
|
Specific Heat Capacity |
$c p_{n f}$ |
Heat capacity calculated from volume-fraction-weighted average of base fluid and nanoparticles |
$c p_{n f}=c_{b f}(1-\emptyset)+C_{n p} \emptyset$ |
(17) |
|
Thermal Conductivity |
$k_{n f}$ |
Effective conductivity using the Maxwell model for spherical particles |
$k_{n f}=\left[\frac{k_{n p}+2 k_{b f}+2 \emptyset\left(k_{n p}-k_{b f}\right)}{k_{n p}+2 k_{b f}-\emptyset\left(k_{n p}-k_{b f}\right)}\right] k_{b f}$ |
(18) |
3.4 Heat transfer in the working fluid
Heat transfer analysis is fundamental in evaluating the thermal performance of photovoltaic/thermal (PV/T) systems. Heat transfer within these systems occurs primarily through conduction and convection and, in more complex models, through logarithmic mean temperature difference (LMTD) methods for enhanced accuracy in heat exchanger analysis. Table 5 outlines the key parameters and equations involved in modeling heat transfer processes, including conduction through solid interfaces, convective heat exchange between surfaces and working fluids, and the calculation of useful heat gain. Additionally, the table includes essential dimensionless numbers such as the Reynolds and Nusselt numbers, which are critical in characterizing flow regimes and convective heat transfer performance. Understanding these theoretical foundations allows for precise thermal modeling and optimization of PV/T system design, ensuring more effective energy conversion and heat recovery under varying operational conditions.
3.5 Thermophysical properties of nanofluids
Accurate characterization of thermophysical properties is essential for evaluating the performance of nanofluids in photovoltaic/thermal (PV/T) systems. These properties significantly influence heat transfer, fluid flow, and system efficiency. Table 6 presents key equations used to estimate the effective thermophysical parameters of nanofluids, including density, viscosity, specific heat capacity, and thermal conductivity. These formulations incorporate the effects of nanoparticle concentration (volume fraction) and are derived from established theoretical models such as Einstein’s equation for viscosity and the Maxwell model for thermal conductivity. By accounting for the combined behavior of base fluids and dispersed nanoparticles, these equations provide a foundation for accurately modeling nanofluid-enhanced PV/T systems and optimizing their thermal management performance.
4.1 Temperature of PV panel
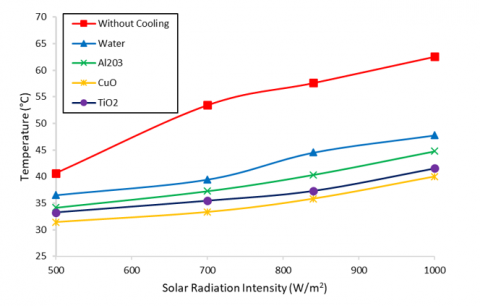
The efficiency of photovoltaic (PV) panels tends to decrease as their operating temperature rises. To counter this, a finned photovoltaic thermal (PV/T) collector cooling system is implemented to lower the panel temperature effectively. This system circulates a working fluid inside the collector tubes, which in this study comprises various nanofluids containing nanoparticles such as Alumina (Al₂O₃), Copper Oxide (CuO), and Titanium Dioxide (TiO₂) at a nanoparticle volume fraction of 0.2%. The thermophysical characteristics of these nanofluids, calculated through Eqs. (15)-(18), are detailed in Table 7. Additionally, Figure 10 illustrates how the PV panel’s operating temperature increases with rising solar radiation intensity, underlining the critical role of thermal management in maintaining PV panel performance.
Table 7. Thermophysical properties of nanofluids
|
Nano-Fluid |
Density (kg/m³) |
Dynamic Viscosity (mPa.S) |
Specific Heat (J/kg.K) |
Thermal Conductivity (W/m.K) |
|
Water |
997.047 |
0.0008910 |
4182 |
0.60960 |
|
CuO (0.2%) |
1008.053 |
0.0008955 |
4171.32 |
0.61307 |
|
TiO2 (0.2%) |
1003.513 |
0.0008955 |
4172.026 |
0.61257 |
|
Al2O3 (0.2%) |
1002.973 |
0.008955 |
4172,188 |
0.61310 |
Figure 5. Effect of solar radiation intensity on the working temperature of finned PV panels
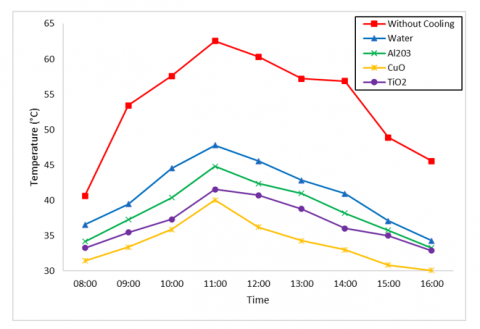
Figure 5 presents research data illustrating the correlation between solar radiation intensity and the operating temperature of finned photovoltaic (PV) panels. As solar radiation intensity increases, the working temperature of all studied PV panel variations rises correspondingly. Panels without cooling exhibit the highest temperatures compared to those with PV/T cooling systems. At a solar radiation intensity of 500 W/m², the operating temperatures for uncooled PV panels, water-cooled PV/T panels, and PV/T panels using Al₂O₃, CuO, and TiO₂ nanofluids are approximately 40.65℃, 36.53℃, 34.15℃, 31.45℃, and 33.25℃, respectively. When the solar radiation intensity increases to 1000 W/m², these temperatures rise to 62.54℃, 47.79℃, 44.78℃, 40.01℃, and 41.56℃, respectively. Notably, the nanofluids Al₂O₃, CuO, and TiO₂ reduce the temperature of finned PV/T panels by 17.76℃, 22.53℃, and 20.98℃, respectively, compared to uncooled PV panels. A comparative graph of PV panel temperature versus time is provided in Figure 6 to depict these thermal performance trends.
Figure 6. Time and temperature relationship graph of PV panel
The data was collected to analyze the influence of solar radiation intensity on the temperature of photovoltaic (PV) panels. The findings reveal a strong correlation between the intensity of solar radiation and the panel temperature. As the solar radiation intensity increases, the PV panel's temperature rises accordingly, negatively impacting its efficiency. This temperature increase on the PV panel surface results from the continuous absorption of solar radiation. Consequently, higher solar radiation intensities lead to elevated PV panel temperatures [25]. Another study by Talib K. Murtadha explained that PV panels without cooling have a temperature of about 59℃. In comparison, PV panels that use nano fluid cooling in Al2O3/ TiO2 have a temperature of 48℃ when the intensity of solar radiation reaches 906,2 W/m2 [26]. A photovoltaic thermal (PV/T) system was employed to lower the PV panels' surface temperature effectively. By using the collector integrated into the system, the operating temperature of the PV panels during daylight hours was reduced compared to the panels operating without any cooling mechanism.
4.2 Panel output power
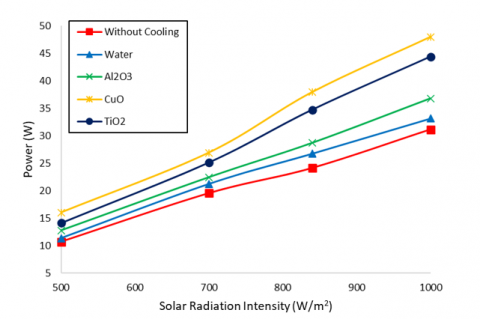
Electrical power generated by solar cells is determined by the product of the voltage and current they produce [27]. The maximum output power of photovoltaic (PV) panels is achieved when the multiplication of current and voltage reaches its highest value for each variation studied. This maximum power represents the most significant amount of energy the PV panel delivers per unit of time (seconds). The relationship between the maximum power output and solar radiation intensity is illustrated in Figure 7, providing insight into the performance characteristics of the panels under varying illumination conditions.
Figure 7 depicts the influence of increasing solar radiation intensity on the maximum power output (Pmax) of photovoltaic (PV) panels. The data indicate that as solar radiation intensity rises, the power generated by the PV panels increases consistently for both uncooled and cooled systems. This trend aligns with fundamental photovoltaic theory, which posits that an increase in incident solar radiation enhances photon absorption, generating more electrons and resulting in higher electrical power output, specifically, at a solar radiation intensity of 1000 W/m², the finned PV panels yield maximum power values of 31.13 W for uncooled panels, 33.13 W for water-cooled panels, 36.82 W for panels cooled with Al₂O₃ nanofluid, 48 W for CuO nanofluid, and 44.40 W for TiO₂ nanofluid, respectively.
Figure 7. Graph of the effect of solar radiation intensity on maximum power ($P_{\max }$)
The findings of this study are consistent with previous research investigating the relationship of nanofluid as a working fluid. For instance, Talib K. Murtadha and Ali Adil Hussein demonstrated that the incorporation of Al₂O₃ nanofluid as a cooling medium increased the maximum power output to approximately 43.80 W, compared to 39.50 W observed in uncooled PV panels under a peak solar radiation intensity of around 880 W/m². This reinforces the efficacy of nano-fluid cooling in enhancing PV panel performance under high solar irradiance conditions [28]. Research by Ali H.A. Al-Waeli et al. showed that the maximum power value of Al2O3 and CuO nano-fluid cooling has a difference of 18 W with those that only use water cooling alone [29].
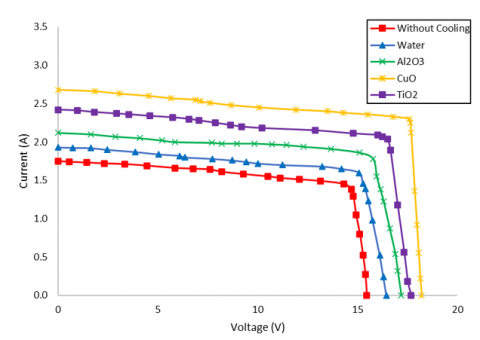
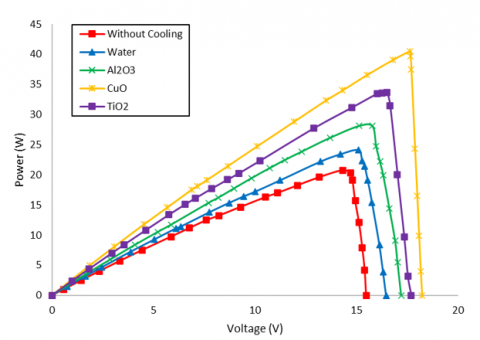
4.3 I-V and P-V curves
Evaluating the current-voltage (I-V) and power-voltage (P-V) curves is fundamental to understanding the performance of photovoltaic (PV) panels and identifying their optimal operating condition, known as the Maximum Power Point (MPP). The I-V curve represents the relationship between the current output and the voltage applied to the PV panel, while the P-V curve demonstrates how the power output changes with voltage. This study includes an examination of both curves to assess the efficiency and performance of the PV panels under various conditions. The highest efficiency was recorded at a solar radiation intensity of 1000 W/m², indicating that radiation intensity is a critical factor for performance assessment. Figures 8 and 9 illustrate the voltage, current, and power data for the finned PV/T panels.
Figures 8 and 9 show the performance parameters of finned PV/T panels under a solar radiation intensity of 1000 W/m². The maximum voltages recorded for panels with different cooling variations—no coolant, water, Al₂O₃, CuO, and TiO₂—are 15.47 V, 16.45 V, 17.20 V, 18.22 V, and 17.69 V, respectively. Lowering the operating temperature of the PV panels increases the maximum current output. Correspondingly, the maximum currents obtained for the uncooled, water-cooled, Al₂O₃ nanofluid, CuO nanofluid, and TiO₂ nanofluid cooled panels are 1.75 A, 1.93 A, 2.12 A, 2.68 A, and 2.42 A, respectively. These variations' maximum power outputs (Pmax) are 31.13 W, 33.13 W, 36.82 W, 48 W, and 44.40 W, respectively.
Figure 8. Graph of the relationship between current and voltage at the intensity of 1000 W/m2 on the finned PV/T
Figure 9. Relationship graph between power and voltage at the intensity of 1000 W/m2 on the finned PV/T
The results align with the study by Wang et al., who conducted both numerical simulations and experimental evaluations of nano-fluid-based photovoltaic-thermal (PV/T) collectors. Their research demonstrated that applying Al2O3 nano-fluid as a coolant in PV/T panels led to a 5.47% improvement in thermal efficiency and a marginal increase of 0.026% in electrical efficiency [30].
4.4 Efficiency of panel
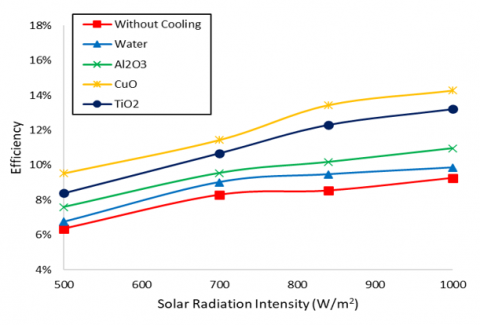
The electrical efficiency of a photovoltaic (PV) panel is a crucial metric that indicates the panel's capability to convert incident solar radiation into electrical energy. This efficiency is calculated as the ratio of the maximum power output (Pmax) to the total solar radiation power received by the panel. For photovoltaic-thermal (PV/T) systems, the electrical efficiency can be determined using the expression provided in Eq. (5). The results of this electrical efficiency calculation are shown in Figure 10.
Figure 10 presents the relationship between solar radiation intensity and the electrical efficiency of photovoltaic (PV) panels. At an irradiance level of 1000 W/m², the electrical efficiencies for different finned PV/T panel configurations- uncooled, water-based, and those using Al2O3, CuO, and TiO2 nanofluids—are observed at 9.26%, 9.85%, 10.95%, 14.28%, and 13.21%, respectively. The electrical efficiency exhibits an increasing trend within the solar intensity range of 500 W/m² to 1000 W/m², with the CuO nanofluid-based PV/T panels achieving the highest efficiency enhancement.
Figure 10. The relationship between solar radiation intensity and efficiency
Increasing the temperature of the PV panel can cause its performance to decrease. With every 1℃ temperature increase, the electrical efficiency of the PV panel decreases by 0.05%, and the power decreases by 0.5% [16]. Research conducted by Shankar Amalraj et al. [31] indicates that an increase in solar radiation intensity enhances the electrical efficiency of photovoltaic (PV) panels, as more solar energy becomes available for conversion into electricity. Among the different cooling fluids studied, the PV panels cooled with CuO nanofluid achieved the highest electrical efficiency, reaching up to 16%, which surpasses the efficiencies attained by those cooled with Al2O3 and water, which are approximately 14% and 13%, respectively.
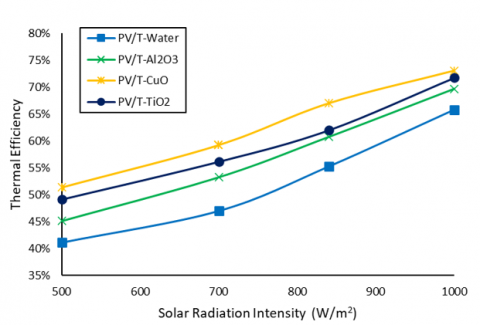
Thermal efficiency is the ratio of the heat energy generated by the photovoltaic-thermal (PV/T) system to the total heat energy incident on the system, as expressed in Eq. (12). Various factors influence the thermal performance of PV/T systems, including the operating temperature, the cooling fluid's flow rate, and the intensity of solar radiation. Figure 11 illustrates the thermal efficiency outcomes observed in the PV/T system evaluated in this study.
Figure 11. Graph of the relationship between solar radiation intensity and thermal efficiency on finned PV/T
Figure 11 illustrates the thermal efficiency of finned photovoltaic-thermal (PV/T) systems at a solar radiation intensity of 1000 W/m², with values recorded at 65.82%, 69.71%, 73.11%, and 71.75% for water, Al2O3, CuO, and TiO2 cooling fluids, respectively. Higher thermal efficiency indicates a more effective conversion of heat energy for various applications. Incorporating nanofluids in PV/T systems significantly enhances heat transfer performance, improving overall thermal efficiency [32].
In this study, the CuO nanofluid demonstrated superior thermal performance compared to Al₂O₃ and TiO₂ nanofluids, primarily due to the inherently higher thermal conductivity of CuO nanoparticles. This enhanced thermal conductivity enables more effective heat dissipation from the photovoltaic cells, substantially lowering their operating temperature. Maintaining a reduced cell temperature is essential for minimizing thermal degradation and ensuring sustained improvements in photovoltaic conversion efficiency.
Nonetheless, the study reveals a nuanced trade-off between thermal efficiency (ηₜₕ) and electrical efficiency (ηₑₗ). While CuO nanofluid achieved the highest thermal efficiency by effectively extracting heat from the system, the corresponding improvement in electrical efficiency was comparatively moderate. This disparity is explained by the complex thermal-electrical performance dynamics inherent in photovoltaic devices, where maximal heat removal does not necessarily equate to proportional gains in electrical output. Therefore, an optimal nanofluid choice requires a comprehensive evaluation of thermal and electrical metrics to maximize overall system efficacy under operational conditions.
In each test and data collection, data processing has been carried out with variations of PV panels without cooling, PV/T-water, PV/T - Al2O3, PV/T-CuO, and PV/T- TiO2. The conclusions obtained from this research are as follows:
Future work should focus on optimizing nanoparticle concentration, exploring hybrid nanofluids, and investigating long-term stability and environmental impacts to enhance the practical deployment of nanofluid-cooled PV/T collectors. Additionally, real-world testing under varied climatic conditions will be crucial for validating laboratory findings and promoting broader adoption of these advanced thermal management approaches.
This research was funded by Sebelas Maret University through the Penguatan Kapasitas Grup Riset (pkg-uns) A scheme (Grant numbers: 371/UN27.22/PT.01.03/2025).
|
Irad |
intensity of sunlight, W/m2 |
|
P |
power, W |
|
Pmax |
rated maximum power, W |
|
Plight |
solar radiation power, W |
|
Pout |
power output, W |
|
V |
voltage, V |
|
Voc |
open circuit voltage, V |
|
Vmax |
maximum voltage generated, V |
|
I |
current, A |
|
Isc |
short circuit current, A |
|
Imax |
maximum current generated, A |
|
Iph |
photogenerated current, A |
|
I0 |
saturation current diode, A |
|
e |
Euler's number |
|
kB |
Boltzmann Constanta, J/K |
|
q |
electrical charge, C |
|
T |
temperature, K |
|
Ti |
temperature in, K |
|
Te |
temperature exit, K |
|
Ts |
temperature surface, K |
|
FF |
fill factor |
|
A |
PV panel surface area, m² |
|
Re |
Reynolds number |
|
Nu |
Nusselt number |
|
v |
velocity, m/s |
|
DH |
hydraulic diameter, m |
|
Q̇ |
Heat transfer rate, Joule/s |
|
h |
heat transfer coefficient, W/(m²·K) |
|
ṁ |
mass flow rate, kg/s |
|
Cp |
specific heat, J/kg·K |
|
K |
thermal conductivity, W/m·K |
|
W |
mass, kg |
|
L |
thickness medium, m |
|
Greek symbols |
|
|
Η |
efficiency, % |
|
ρ |
density, kg/m³ |
|
$\emptyset$ |
concentration, % |
|
μ |
dynamic viscosity, kg/m·s |
|
$\Delta T$ |
temperature difference |
|
Subscripts |
|
|
np |
nanoparticle |
|
bf |
base fluid |
|
nf |
nanofluid |
|
sc |
short current |
|
oc |
open circuit |
|
ph |
photogeneration |
|
e |
exit |
|
i |
in |
|
th |
thermal |
|
rad |
radiation |
[1] Khammayom, N., Maruyama, N., Chaichana, C., Hirota, M. (2023). Experimental analysis of local air temperature and thermal performance of a serpentine copper pipe. Energy Reports, 9: 653-661. https://doi.org/10.1016/J.EGYR.2022.11.044
[2] Hasan, M.H., Mahlia, T.M.I., Nur, H. (2012). A review on energy scenario and sustainable energy in Indonesia. Renewable and Sustainable Energy Reviews, 16(4): 2316-2328. https://doi.org/10.1016/J.RSER.2011.12.007
[3] Afif, F., Martin, A. (2022). Tinjauan Potensi dan Kebijakan Energi Surya di Indonesia. Jurnal Engine: Energi, Manufaktur, Dan Material, 6(1): 43. https://doi.org/10.30588/JEEMM.V6I1.997
[4] IESR. (2023). Indonesia Energy Transition Outlook 2024: Peaking Indonesia’s Energy Sector Emission by 2030: The Beginning or The End of Energy Transition Promise. Jakarta: Institute for Essential Services Reform (IESR). https://iesr.or.id/wp-content/uploads/2024/03/Indonesia-Energy-Transition-Outlook-2024-1.pdf.
[5] Ahmad, L., Khordehgah, N., Malinauskaite, J., Jouhara, H. (2020). Recent advances and applications of solar photovoltaics and thermal technologies. Energy, 207: 118254. https://doi.org/10.1016/j.energy.2020.118254
[6] Shahsavar, A. (2021). Experimental evaluation of energy and exergy performance of a nanofluid-based photovoltaic/thermal system equipped with a sheet-and-sinusoidal serpentine tube collector. Journal of Cleaner Production, 287: 125064. https://doi.org/10.1016/J.JCLEPRO.2020.125064
[7] Shahsavari, A., Akbari, M. (2018). Potential of solar energy in developing countries for reducing energy-related emissions. Renewable and Sustainable Energy Reviews, 90: 275-291. https://doi.org/10.1016/J.RSER.2018.03.065
[8] Kalidasan, B., Pandey, A.K., Shahabuddin, S., Samykano, M., Thirugnanasambandam, M., Saidur, R. (2020). Phase change materials integrated solar thermal energy systems: Global trends and current practices in experimental approaches. Journal of Energy Storage, 27: 101118. https://doi.org/10.1016/J.EST.2019.101118
[9] Sugiyono, A., Anindhita, F., Fitriana, I., Wahid, L.O.M.A., Adiarso. (2019). Outlook energi Indonesia 2019 dampak peningkatan pemanfaatan energi baru terbarukan terhadap perekonomian nasional. https://www.researchgate.net/publication/337918819_Outlook_Energi_Indonesia_2019_Dampak_Peningkatan_Pemanfaatan_Energi_Baru_Terbarukan_Terhadap_Perekonomian_Nasional.
[10] Octavianti, A., Muliadi, M., Apriansyah, A. (2018). Estimasi intensitas radiasi matahari di wilayah kota makassar. Priswa Fisika, 6(3): 152-159. https://doi.org/10.26418/PF.V6I3.28711
[11] Sobri, S., Koohi-Kamali, S., Rahim, N.A. (2018). Solar photovoltaic generation forecasting methods: A review. Energy Conversion and Management, 156: 459-497. https://doi.org/10.1016/J.ENCONMAN.2017.11.019
[12] https://repository.unsri.ac.id/178617/4/RAMA_41201_05021182126009_0018096502_01_front_ref.pdf, accessed on Feb. 10, 2025.
[13] Syamsudin, F.I., Rahmawati, F., Indrowati, M., Suryana, R., Saputro, S. (2023). Kajian pustaka aplikasi nanopartikel melalui metode sol-gel sebagai fotoanoda pada dye sensitized solar cell (DSSC). Jurnal Fisika: Fisika Sains dan Aplikasinya, 8(2): 9-16. https://doi.org/10.35508/fisa.v8i2.12893
[14] Sharma, S., Jain, K.K., Sharma, A., Sharma, S., Jain, K.K., Sharma, A. (2015). Solar cells: In research and applications—A review. Materials Sciences and Applications, 6(12): 1145-1155. https://doi.org/10.4236/MSA.2015.612113
[15] Prasetyo, S.D., Prabowo, A.R., Arifin, Z. (2023). The use of a hybrid photovoltaic/thermal (PV/T) collector system as a sustainable energy-harvest instrument in urban technology. Heliyon, 9(2): e13390. https://doi.org/10.1016/J.HELIYON.2023.E13390
[16] Rahman, M.M., Hasanuzzaman, M., Rahim, N.A. (2015). Effects of various parameters on PV-module power and efficiency. Energy Conversion and Management, 103: 348-358. https://doi.org/10.1016/J.ENCONMAN.2015.06.067
[17] Rajab, D.A., Abdulah, A., Afriani, I., Sukarman, Khoirudin, Ulhakim, M.T., Waluyo, R. (2023). Optimasi cairan pendingin fluida Nano (SiO2+EG/W) menggunakan RSM-CCD pada pendingin panel surya. AME (Aplikasi Mek. dan Energi) J. Ilm. Tek. Mesin, 9(2): 115-123. https://ejournal2.uika-bogor.ac.id/index.php/ame/article/view/360.
[18] Kazem, H.A. (2019). Evaluation and analysis of water-based photovoltaic/thermal (PV/T) system. Case Studies in Thermal Engineering, 13: 100401. https://doi.org/10.1016/J.CSITE.2019.100401
[19] Sultan, S.M., Ervina Efzan, M.N. (2018). Review on recent photovoltaic/thermal (PV/T) technology advances and applications. Solar Energy, 173: 939-954. https://doi.org/10.1016/J.SOLENER.2018.08.032
[20] Noor, A., Hamdini, M., Ramadina, S., Tiandho, Y. (2021). Dye-sensitized solar cell-based photovoltaic thermal for ethanol distillation: A narrative review. Jurnal Geliga Sains Jurnal Pendidikan Fisika, 8(2): 123. https://doi.org/10.31258/JGS.8.2.123-131
[21] Hassan, A., Abbas, S., Yousuf, S., Abbas, F., Amin, N.M., Ali, S., Mastoi, M.S. (2023). An experimental and numerical study on the impact of various parameters in improving the heat transfer performance characteristics of a water based photovoltaic thermal system. Renewable Energy, 202: 499-512. https://doi.org/10.1016/j.renene.2022.11.087
[22] Adun, H., Mukhtar, M., Adedeji, M., Agwa, T., Ibrahim, K.H., Bamisile, O., Dagbasi, M. (2021). Synthesis and application of ternary nanofluid for photovoltaic-thermal system: comparative analysis of energy and exergy performance with single and hybrid nanofluids. Energies, 14(15): 4434. https://doi.org/10.3390/en14154434
[23] Razali, N.F.M., Fudholi, A., Ruslan, M.H., Sopian, K. (2019). Review of water-nanofluid based photovoltaic/thermal (PV/T) systems. International Journal of Electrical and Computer Engineering (IJECE), 9(1): 134-140. https://doi.org/10.11591/IJECE.V9I1.PP134-140
[24] Kazem, H.A., Al-Waeli, A.H.A., Chaichan, M.T., Al-Waeli, K.H., Al-Aasam, A.B., Sopian, K. (2020). Evaluation and comparison of different flow configurations PVT systems in Oman: A numerical and experimental investigation. Solar Energy, 208: 58-88. https://doi.org/10.1016/j.solener.2020.07.078
[25] Khatibi, A., Razi Astaraei, F., Ahmadi, M.H. (2019). Generation and combination of the solar cells: A current model review. Energy Science and Engineering, 7(2): 305-322. https://doi.org/10.1002/ese3.292
[26] Umam, M., Hasanuzzaman, M., Rahim, N. (2023). The influence of nanofluid characteristics on the thermal performance of photovoltaic thermal system. IOP Conference Series Earth and Environmental Science, 1261(1): 012013. https://doi.org/10.1088/1755-1315/1261/1/012013
[27] Vardaru, G., Huminic, G., Huminic, A. (2023). Study of hybrid nanofluids used in direct absorption solar collectors. IOP Conference Series Materials Science and Engineering, 1290(1): 012003. https://doi.org/10.1088/1757-899x/1290/1/012003
[28] Shahzad, F., Jamshed, W., Sathyanarayanan, S., Aissa, A., Prakash, M., Mourad, A. (2021). Thermal analysis on darcy‐Forchheimer swirling Casson hybrid nanofluid flow inside parallel plates in parabolic trough solar collector: An application to solar aircraft. International Journal of Energy Research, 45(15): 20812-20834. https://doi.org/10.1002/er.7140
[29] Mahamude, A., Kamarulzaman, M., Harun, W., Kadirgama, K., Ramasamy, D., Farhana, K., Bakar, R.A., Yusaf, T., Subramanion, S., Yousif, B. (2022). A comprehensive review on efficiency enhancement of solar collectors using hybrid nanofluids. Energies, 15(4): 1391. https://doi.org/10.3390/en15041391
[30] Tank, J., Jadav, G., Dodia, S., Dudharejiya, T., Vala, M., Solanki, P., Dhurav, D.K., Markna Bharat Kataria, J.H. (2024). Performance enhancement of solar thermal systems using nanofluids: A review. Journal of Sustainable Materials Processing and Management, 4(1): 24-39. https://doi.org/10.30880/jsmpm.2024.04.01.003
[31] Ghetany, H., Elgohary, H., Mohammed, Y. (2021). Performance improvement of solar water distillation system using nano-fluid particles. Egyptian Journal of Chemistry. https://doi.org/10.21608/ejchem.2021.64067.3372
[32] Zamen, M., Kahani, M., Rostami, B., Bargahi, M. (2022). Application of Al2O3/water nanofluid as the coolant in a new design of photovoltaic/thermal system: An experimental study. Energy Science & Engineering, 10(11): 4273-4285. https://doi.org/10.1002/ese3.1067
[33] Diwania, S., Kumar, R., Kumar, M., Gupta, V., Alsenani, T. (2022). Performance enrichment of hybrid photovoltaic thermal collector with different nano-fluids. Energy & Environment, 34(6): 1747-1769. https://doi.org/10.1177/0958305x221093459
[34] Nie, B., Qiu, Z., Zhang, Y., Ni, X., Zhang, M., Xu, N. (2023). The performance of SiO2 nanofluid-based split-frequency pv/t energy. Journal of Physics Conference Series, 2529(1): 012023. https://doi.org/10.1088/1742-6596/2529/1/012023
[35] Arifin, Z., Prasojo, Y.J., Juwana, W.E., Rachmanto, R.A., Widhiyanuriyawan, D., Yohana, E., Prasetyo, S.D. (2024). Investigating the influence of nanofluid on photovoltaic-thermal systems concerning photovoltaic panel performance. e-Prime - Advances in Electrical Engineering, Electronics and Energy, 9: 100730. https://doi.org/10.1016/j.prime.2024.100730
[36] Rahman, M.M., Hasanuzzaman, M., Rahim, N.A. (2015). Effects of various parameters on PV-module power and efficiency. Energy Conversion and Management, 103: 348-358. https://doi.org/10.1016/j.enconman.2015.06.067
[37] Arifin, Z., Prasojo, Y.J., Juwana, W.E., Rachmanto, R.A., Widhiyanuriyawan, D., Yohana, E., Prasetyo, S.D. (2024). Investigating the influence of nanofluid on photovoltaic-thermal systems concerning photovoltaic panel performance. e-Prime - Advances in Electrical Engineering, Electronics and Energy, 9: 100730. https://doi.org/10.1016/j.prime.2024.100730
[38] Imtiaz Hussain, M., Kim, J.H., Kim, J.T. (2019). Nanofluid-powered dual-fluid photovoltaic/thermal (PV/T) system: Comparative numerical study. Energies, 12(5): 775. https://doi.org/10.3390/EN12050775
[39] Murtadha, T.K. (2023). Effect of using Al2O3 / TiO2 hybrid nanofluids on improving the photovoltaic performance. Case Studies in Thermal Engineering, 47: 103112. https://doi.org/10.1016/J.CSITE.2023.103112
[40] Pido, R. (2019). Analisa pengaruh kenaikan temperatur permukaan solar cell terhadap daya output. Gorontalo Journal of Infrastructure & Science Engineering, 2(2): 24-30. https://doi.org/10.32662/GOJISE.V2I2.683
[41] Murtadha, T.K., Hussein, A.A. (2022). Optimization the performance of photovoltaic panels using aluminum-oxide nanofluid as cooling fluid at different concentrations and one-pass flow system. Results in Engineering, 15: 100541. https://doi.org/10.1016/J.RINENG.2022.100541
[42] Al-Waeli, A.H.A., Chaichan, M.T., Kazem, H.A., Sopian, K. (2017). Comparative study to use nano-(Al2O3, CuO, and SiC) with water to enhance photovoltaic thermal PV/T collectors. Energy Conversion and Management, 148: 963-973. https://doi.org/10.1016/J.ENCONMAN.2017.06.072
[43] Wang, J.J., Qin, Y.B., Huo, S.J., Xie, K.Z., Li, Y.M. (2023). Numerical simulation of nanofluid-based parallel cooling photovoltaic thermal collectors. Journal of Thermal Science, 32(4): 1644-1656. https://doi.org/10.1007/S11630-023-1741-Y/METRICS
[44] Amalraj, S., Michael, P.A. (2019). Synthesis and characterization of Al2O3 and CuO nanoparticles into nanofluids for solar panel applications. Results in Physics, 15: 102797. https://doi.org/10.1016/J.RINP.2019.102797
[45] Al-Waeli, A.H.A., Sopian, K., Chaichan, M.T., Kazem, H.A., Ibrahim, A., Mat, S., Ruslan, M.H. (2017). Evaluation of the nanofluid and nano-PCM based photovoltaic thermal (PVT) system: An experimental study. Energy Conversion and Management, 151: 693-708. https://doi.org/10.1016/j.enconman.2017.09.032