Yogesh Shrivastava* | Prashant Kumar Shrivastava | Durgesh Nandan
© 2022 IIETA. This article is published by IIETA and is licensed under the CC BY 4.0 license (http://creativecommons.org/licenses/by/4.0/).
OPEN ACCESS
The identification of faults in machinery is a very emerging trend. In the last few decades, regenerative tool chatter and its adverse effects have been explored by many researchers. However, a lot of work has to be done within this domain. A new methodology has been presented in the present work to determine the chatter severity while machining. The methodology has three stages. In the first stage, numerous experiments have been carried out, and associated signals have been captured. Thereafter, in the second stage, preprocessing of the recorded signals have been done using “ensemble empirical mode decomposition” to filter out the contaminations from the signals. The intrinsic mode functions have been further evaluated using statistical indicators viz. chatter index and absolute mean amplitude. In the third stage, these statistical indicators have been examined concerning the input parameters to identify the variation in the responses and chatter severity. The proposed methodology seems helpful for the researchers to identify the chatter features concerning variation in input parameters.
regenerative chatter, signal processing, ensemble empirical mode decomposition, statistical indicators
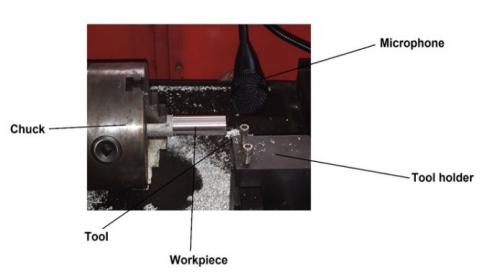
Mechanical systems and signal processing techniques have been together for the last decade. The signal processing techniques help in identifying faults in machinery. Various researchers have adopted signal processing techniques to identify faults in machinery [1-7]. A crucial stage in the diagnosis of any defect is the choice of signal processing methods. The technique chosen often depends on the signal type and features we are trying to extract [8]. The signals are categorized into two main forms viz. “stationary signals” and “non-stationary signals” [9]. To record these signals researchers have used various contact and non-contact type devices [10]. However, one of the researchers compared various available contact and non-contact type of devices and found that the noncontact type of microphone is best suitable for recording the signals [11]. Moreover, he has also added that the signals recorded from any such devices are contaminated by unwanted noise. These contaminations hinder the identification of exact features. Hence, it is essential to sieve these contaminations precisely so that the exact chatter features can be extracted. The features to be extracted can be associated with anything like, wear, breakage, chatter, cracks, etc. depending on the process that we aim to monitor. The turning procedure of the current work was carried out using a “CNC lathe”. For understanding the need for feature extraction and monitoring of the system, it is required to understand the regenerative chatter phenomenon. A single point cutting tool is used to manage the workpiece during turning operations. Throughout the process, the workpiece is rotated with the desired speed and the tool is fed forward as shown in Figure 1.
Figure 1. “Turning operation with acquisition setup”
The cutting is assumed to be orthogonal and the tool is much harder than the workpiece. Now, talking about the quality of the workpieces, numerous researchers have reported that the composition of the work product can never be homogeneous [12]. This variation in the composition results in regenerative chatter [13]. The wavy profile generated due to this regenerative chatter increases the surface roughness as shown in Figure 2. Figure 1 also consists of a workpiece that is placed inside a chuck the workpiece rotates clockwise. Moreover, the tool is placed in such a way that the single-point cutting tool can machine the workpiece successfully. In the machining vicinity, a microphone has been placed. The microphone is further attached to a laptop for recorded and processing of the signals.
Figure 2. “Mechanism of chatter regeneration”
Figure 3. Proposed methodology
This chatter obstructs the surface finish of the workpiece. In the present work, the signals resembling the regenerative chatter have been taped using the microphone. These recorded signals can be of four types; “stationary and linear”, “stationary and non-linear”, “non-stationary and linear”, and “non-stationary and non-linear”. In the past, most researchers have considered these recorded signals as either stationary and linear [14-17] or non-stationary and linear [18-20]. Only a few researchers have considered these signals as non-stationary and nonlinear [21-23]. From the literature, it has also been reviled that in real working conditions the recorded signal can never be stationary. Hence, the signals are always non-stationary and nonlinear. In the case of non-stationary and non-linear signals, the most frequently used methods are “Hilbert Huang Transform (HHT)” [24-26], “Empirical Mode Decomposition (EMD)” [24, 27-29], and “Ensemble Empirical Mode Decomposition (EEMD)” [30-32]. It has been already reported by the researchers that among these three techniques EEMD is the most suitable one [8]. Despite the effort done in this field, there are still many unexplored angles. The work done regarding the use of EEMD for chatter signals is concentrated on the evaluation of either chatter frequency [8, 32] or focused on the identification of a “stable cutting zone” [9]. To the authors' knowledge, no research on the assessment of chatter severity based on EEMD has been reported.
In the current work, turning operations were carried out on a CNC lathe, and signals were captured using a “microphone”. The captured signals are then decomposed in filtered using EEMD. The obtained “intrinsic mode functions” have been analyzed and used statistical indicators to identify the “chatter severity”. Moreover, a flow chart has been drawn demonstrating the proposed methodology as shown in Figure 3. In Figure 3 the process starts from the selection of the machine/tool and the machining parameters. Thereafter, the experiments have been performed by selecting the levels and design of experiments. While performing the experiments the signals have been recorded. These “recorded signals” have been decomposed using EEMD. The “decomposed signals” have been evaluated using a statistical approach through which the chatter severity has been obtained.
2.1 Materials
In the present work, AISI 1018 “low carbon steel in the form of a bar” has been used. The dimension of the bars is, Length: 90 mm, Diameter: 30mm. These bars have been machined using CNC trainer lathe MCL10 (operation used is turning operation). Table 1 shows the cutting condition. Table 2 shows the specification of the tool. Moreover, the specification of the microphone has been shown in Table 3. Figure 4 shows the actual machining setup.
Table 1. Cutting conditions [33]
|
S.no. |
Machining Parameters |
Level one |
Level two |
Level three |
|
1. |
“Depth of cut (d) mm” |
0.5 |
1 |
1.5 |
|
2. |
“Cutting speed (s) m/min” |
150 |
200 |
250 |
|
3. |
“Feed rate (f) mm/rev” |
0.15 |
0.20 |
0.25 |
Table 2. Tool specification [33]
|
Cutting insert |
“Tungsten carbide” |
|
Insert dimensions |
“3/4″, 3/4″,1/4″ with 1/16″ nose radius” |
|
Tool holder |
“Carboloy MSDNN85-6, neutral shank with 450 Side cutting edge angle” |
Table 3. Microphone specification [33]
|
“Model” |
“AHUJA-AGN-480” |
|
“Specialty” |
“Unidirectional Microphone (dynamic)” |
|
“Frequency Response” |
“50-10,000 Hz.” |
|
“Sensitivity” |
“2.0 mV/Pa” |
|
“Impedance” |
“600 Ω” |
|
“Overall Length” |
“470mm” |
Figure 4. Actual machining setup
2.2 Methods
In the present work, EEMD has been adopted in place of empirical mode decomposition [8]. In this method, the recorded signal (X) is first prepared by adding a known quality of noise to limit the riding waves and restrict the mode mixing phenomenon [8, 32]. The prepared signal has been named (Y). Thereafter the upper and lower extrema of the signal (Y) have been identified. These extremes have been used to identify the mean and the mean is then subtracted from the signal (Y). The obtained result has been termed (Z), which is also termed the first intrinsic mode decomposition (IMF 1). Now, this signal (Z) will be treated as (Y) and the same process will be repeated till the signal meets the criteria [34], to identify several (IMFs). These number of IMFs may vary from signal to signal depending upon the length of the signal and its associated pattern. The obtained IMFs have been further evaluated using statistical indicators viz. chatter index and absolute mean amplitude.
Chatter index (CI) [33]:
“Chatter index (CI)” refers to the deviance of amplitude from the mean [35]. The CI can be calculated using Eq. (1).
where, N = length of the signal, μ = amplitude components.
$CI=\sqrt{\frac{1}{N}\sum\limits_{n=1}^{N}{{{(x(t)-\mu )}^{2}}}}$ (1)
Absolute mean amplitude (AMA) [3]:
“Absolute mean amplitude (AMA)” is the average of the absolute value of chatter amplitudes. The AMA value has been calculated using Eq. (2).
$\frac{1}{N}\sum\limits_{n=1}^{N}{\left| x(t) \right|}\text{ }$ (2)
where, ‘x(t)’ = signal.
For recording the signals, some experiments were conducted. Different combination of input cutting conditions has been developed using the full factorial design. The developed full factorial design has been shown in Table 4. During each experiment, a microphone has been used to record audio signals. Thereafter, EEMD has been used to preprocess these recorded signals. The visualizing of the process, a preprocessed signal, and its IMFs have been shown in Figures 5 and 6. Figure 5 shows the frequency transformation of the recorded signal. From the figure, it has been noted that the maximum amplitude is around 60 Hz. However, this peak can be due to chatter or other contaminations. Hence, to extract the chatter features and to sieve out the contaminations, EEMD has been used. Figure 6 shows the processed signal using EEMD, from the 13 IMFs any one of the modes may be responsible for chatter. Hence, to identify the mode. Frequency transform has been used. The IMFs have been transformed into the frequency domain.
The transforms with maximum amplitude have been marked as these peaks resemble only chatter, The contaminations have already been sieved out using EEMD. In the same way, 27 different IMFs have been marked [35]. These amplitudes have been used to calculate the CI and AMA as listed in Table 4. Further, these responses (CI and AMA) have been analyzed to calculate chatter severity.
Table 4. “Full factorial design and associated responses”
|
Experiment No. |
Depth of cut, d (mm) |
Cutting speed, s (m/min.) |
Feed rate, f (mm/rev.) |
CI |
AMA |
|
1. |
0.5 |
150 |
0.15 |
1.151 |
1.578 |
|
2. |
0.5 |
150 |
0.20 |
1.998 |
2.852 |
|
3. |
0.5 |
150 |
0.25 |
1.127 |
1.782 |
|
4. |
0.5 |
200 |
0.15 |
0.847 |
1.343 |
|
5. |
0.5 |
200 |
0.20 |
1.467 |
1.851 |
|
6. |
0.5 |
200 |
0.25 |
0.593 |
0.819 |
|
7. |
0.5 |
250 |
0.15 |
0.916 |
1.197 |
|
8. |
0.5 |
250 |
0.20 |
2.457 |
3.573 |
|
9. |
0.5 |
250 |
0.25 |
2.971 |
4.132 |
|
10. |
1.0 |
150 |
0.15 |
0.972 |
1.236 |
|
11. |
1.0 |
150 |
0.20 |
1.399 |
1.660 |
|
12. |
1.0 |
150 |
0.25 |
0.799 |
1.052 |
|
13. |
1.0 |
200 |
0.15 |
3.760 |
1.693 |
|
14. |
1.0 |
200 |
0.20 |
1.110 |
1.349 |
|
15. |
1.0 |
200 |
0.25 |
1.857 |
2.660 |
|
16. |
1.0 |
250 |
0.15 |
1.390 |
1.650 |
|
17. |
1.0 |
250 |
0.20 |
1.516 |
2.091 |
|
18. |
1.0 |
250 |
0.25 |
2.279 |
3.208 |
|
19. |
1.5 |
150 |
0.15 |
1.155 |
1.618 |
|
20. |
1.5 |
150 |
0.20 |
1.866 |
2.701 |
|
21. |
1.5 |
150 |
0.25 |
1.435 |
2.016 |
|
22. |
1.5 |
200 |
0.15 |
1.116 |
1.341 |
|
23. |
1.5 |
200 |
0.20 |
0.720 |
0.932 |
|
24. |
1.5 |
200 |
0.25 |
0.728 |
1.002 |
|
25. |
1.5 |
250 |
0.15 |
3.970 |
6.422 |
|
26. |
1.5 |
250 |
0.20 |
4.433 |
6.740 |
|
27. |
1.5 |
250 |
0.25 |
4.341 |
6.306 |
Figure 5. Recorded signal and its frequency domain at depth of cut (d) 0.5 mm, feed rate (F) 0.15 mm/rev. and cutting speed (S) 150 m/min
Figure 6. EEMD of the signal recorded at depth of cut (d) 0.5 mm, feed rate (F) 0.15 mm/rev. and Spindle speed (S) 150 rpm
From the calculated data it has been found that both the responses CI and AMA follow a similar trend. Hence, anyone of the statistical indicator can be used for predicting the chatter severity. Moreover, to identify the trend of the responses a plot has been drawn as shown in Figure 7.
Figure 7. CI versus AMA
From the plot, it has been inferred that both the statistical indicators are resulting in the same trend. Moreover, to determine chatter severity, any statistical indicator can be used. Hence, in the present work, AMA has been used to identify the chatter severity. For evaluating chatter severity the calculated values of AMA have been sorted from higher to lower as shown in Table 5. The experimental run with the maximum value of AMA has been marked as maximum chatter or most severe chatter and the experimental run with a minimum value of AMA has been marked as least severe.
From the table, it has been inferred that the experimental run 26 has a maximum value of AMA. One of the reasons for such a trend is, that at experimental run 26 the value of depth of cut is maximum with the maximum value of cutting speed. This combination leads to inappropriate machining due to enhance power and excessive cutting force. Similarly, the lower value of AMA has been observed when the depth of cut is minimum with moderate cutting speed. Table 5 shows a severity chart for chatter. Through this, the combination of cutting parameters can be selected without calculating the surface roughness. Although the analysis is limited to the selection of the best cutting combination from the 27 experimental runs. Hence, to identify the best range of parameters concerning the minimum value of AMA, “response surface methodology (RSM)” has been used. A mathematical model has been constructed using the RSM. The developed model has been shown in Eq. (1). The developed model has been used to identify the trend for the entire range of input parameters from level 1 to level 3 as mentioned in Table 1. To identify the variations contour plots have been drawn as shown in Figures 8-10.
Table 5. Chatter severity
|
Experiment No. |
Depth of cut, d (mm) |
Cutting speed, s (m/min.) |
Feed rate, f (mm/rev.) |
AMA |
|
26 |
1.5 |
250 |
0.2 |
6.74 |
|
25 |
1.5 |
250 |
0.15 |
6.422 |
|
27 |
1.5 |
250 |
0.25 |
6.306 |
|
9 |
0.5 |
250 |
0.25 |
4.132 |
|
8 |
0.5 |
250 |
0.2 |
3.573 |
|
18 |
1 |
250 |
0.25 |
3.208 |
|
2 |
0.5 |
150 |
0.2 |
2.852 |
|
20 |
1.5 |
150 |
0.2 |
2.701 |
|
15 |
1 |
200 |
0.25 |
2.66 |
|
17 |
1 |
250 |
0.2 |
2.091 |
|
21 |
1.5 |
150 |
0.25 |
2.016 |
|
5 |
0.5 |
200 |
0.2 |
1.851 |
|
3 |
0.5 |
150 |
0.25 |
1.782 |
|
13 |
1 |
200 |
0.15 |
1.693 |
|
11 |
1 |
150 |
0.2 |
1.66 |
|
16 |
1 |
250 |
0.15 |
1.65 |
|
19 |
1.5 |
150 |
0.15 |
1.618 |
|
1 |
0.5 |
150 |
0.15 |
1.578 |
|
14 |
1 |
200 |
0.2 |
1.349 |
|
4 |
0.5 |
200 |
0.15 |
1.343 |
|
22 |
1.5 |
200 |
0.15 |
1.341 |
|
10 |
1 |
150 |
0.15 |
1.236 |
|
7 |
0.5 |
250 |
0.15 |
1.197 |
|
12 |
1 |
150 |
0.25 |
1.052 |
|
24 |
1.5 |
200 |
0.25 |
1.002 |
|
23 |
1.5 |
200 |
0.2 |
0.932 |
|
6 |
0.5 |
200 |
0.25 |
0.819 |
$ AMA=25.8-10.75 \times \mathrm{d}-0.2700 \times \mathrm{s}+45.3 \times \mathrm{f}+3.34 \times \mathrm{d} \times \mathrm{d}+0.000574 \times \mathrm{s} \times \mathrm{s}-143 \times \mathrm{f} \times \mathrm{f}+0.0348 \times \mathrm{d} \times \mathrm{s}-8.9 \times \mathrm{d} \times \mathrm{f}+0.132 \times \mathrm{s} \times \mathrm{f}$ (3)
Table 6. Safe machining range
|
Parameters |
d versus f |
d versus s |
s versus f |
Safe Machining Range |
|
d |
0.75-1.20 |
0.50-1.30 |
- |
0.75-1.20 |
|
s |
- |
150-225 |
150-225 |
150-225 |
|
f |
0.15-0.225 |
- |
0.15-0.25 |
0.15- 0.225 |
Figure 8. Variation in AMA concerning the depth of cut and feed rate
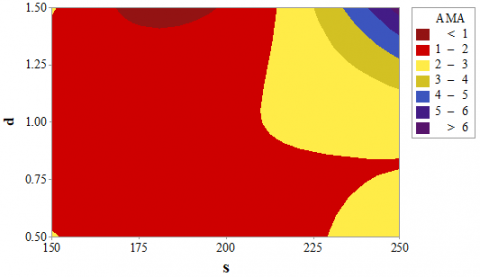
Figure 9. Variation in AMA concerning the depth of cut and cutting speed
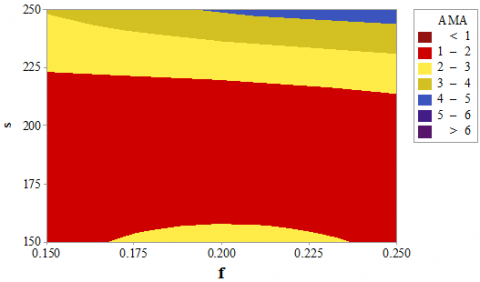
Figure 10. Variation in AMA concerning cutting speed and feed rate
The obtained safe machining range resembles the best range of input parameters for the minimum value of chatter has been shown in Table 6. To verify the results the obtained safe machining range has been fed into the developed model. Some of the obtained validation results have been shown in Table 7. From the results, it has been found that the proposed methodology is significant.
Table 7. Validation of safe machining range
|
S.No. |
d |
s |
f |
AMA |
|
1. |
0.75 |
150 |
0.15 |
1.492 |
|
2. |
1 |
175 |
0.20 |
0.988 |
|
3. |
1.20 |
225 |
0.225 |
2.647 |
The proposed methodology deals with the evaluation of regenerative chatter. In the present work, experiments have been performed and audio signals have been recorded. The recorded chatter signals have been preprocessed using EEMD. Thereafter, the preprocessed signal has been evaluated to calculate chatter severity. In view of the strengths of the present work. The present work deals with the identification of a suitable safe cutting zone which is essential to be identified considering the regenerative chatter, which is very essential for increasing the productivity of the system. Moreover, there are certain limitations of the present work which include, regressive experimentation and wastage of material while identifying the suitable range of input parameters. Furthermore, while performing the experimentation, if any error occurs the repetition rate should be increased which again invites the wastage of resources.
The key outcomes of the works are:
The audio signals of regenerative chatter can be processed successfully using EEMD.
The calculated values of CI and AMA follow the same trend.
From the 27 experiments, AMA is minimum for experimental run 6. The corresponding value of AMA is 0.819.
For the given range of input parameters, the preferable range of depth of cut is 0.75-1.20 mm; cutting speed is 150-225 m/min.; and feed rate is 0.15-0.225 mm/rev.
[1] Cheng, J., Zhang, K., Yang, Y. (2012). An order tracking technique for the gear fault diagnosis using local mean decomposition method. Mechanism and Machine Theory, 55: 67-76. https://doi.org/10.1016/j.mechmachtheory.2012.04.008
[2] Lin, J., Zuo, M.J. (2003). Gearbox fault diagnosis using adaptive wavelet filter. Mechanical Systems and Signal Processing, 17(6): 1259-1269. https://doi.org/10.1006/mssp.2002.1507
[3] Feng, Z., Zuo, M.J., Hao, R., Chu, F., Lee, J. (2013). Ensemble empirical mode decomposition-based Teager energy spectrum for bearing fault diagnosis. Journal of Vibration and Acoustics, 135(3): 031013-21, https://doi.org/10.1115/1.4023814.
[4] Liu, H., Han, M. (2014). A fault diagnosis method based on local mean decomposition and multi-scale entropy for roller bearings. Mechanism and Machine Theory, 75: 67-78. https://doi.org/10.1016/j.mechmachtheory.2014.01.011
[5] Peng, Z.K., Peter, W.T., Chu, F.L. (2005). A comparison study of improved Hilbert–Huang transform and wavelet transform: Application to fault diagnosis for rolling bearing. Mechanical Systems and Signal Processing, 19(5): 974-988. https://doi.org/10.1016/j.ymssp.2004.01.006
[6] Chen, Y., Li, H., Hou, L., Wang, J., Bu, X. (2018). An intelligent chatter detection method based on EEMD and feature selection with multi-channel vibration signals. Measurement, 127: 356-365. https://doi.org/10.1016/j.measurement.2018.06.006
[7] Snr, D.E.D. (2000). Sensor signals for tool-wear monitoring in metal cutting operations—a review of methods. International Journal of Machine Tools and Manufacture, 40(8): 1073-1098. https://doi.org/10.1016/S0890-6955(99)00122-4
[8] Shrivastava, Y., Singh, B. (2019). A comparative study of EMD and EEMD approaches for identifying chatter frequency in CNC turning. European Journal of Mechanics-A/Solids, 73: 381-393. https://doi.org/10.1016/j.euromechsol.2018.10.004
[9] Shrivastava, Y., Singh, B. (2019). Stable cutting zone prediction in computer numerical control turning based on empirical mode decomposition and artificial neural network approach. Transactions of the Institute of Measurement and Control, 41(1): 193-209. https://doi.org/10.1177/0142331218757285
[10] Wang, H.L., Wu, F., Zhang, L. (2021). Fault diagnosis of rolling bearings based on improved empirical mode decomposition and fuzzy C-means algorithm. Traitement du Signal, 38(2): 395-400. https://doi.org/10.18280/ts.380217
[11] Delio, T., Tlusty, J., Smith, S. (1992). Use of audio signals for chatter detection and control. ASME J. Eng. Ind, 114(2): 146-157. https://doi.org/10.1115/1.2899767
[12] Tobias, S.A. (1961). Machine tool vibration research. International Journal of Machine Tool Design and Research, 1(1-2): 1-14. https://doi.org/10.1016/0020-7357(61)90040-3
[13] Tobias, S.A., Fishwick, W. (1958). Theory of regenerative machine tool chatter. The Engineer, 205(7): 199-203.
[14] Heinzel, G., Rüdiger, A., Schilling, R. (2002). Spectrum and spectral density estimation by the Discrete Fourier transform (DFT), including a comprehensive list of window functions and some new at-top windows.
[15] Altintas, Y., Stépán, G., Merdol, D., Dombóvári, Z. (2008). Chatter stability of milling in frequency and discrete time domain. CIRP Journal of Manufacturing Science and Technology, 1(1): 35-44. https://doi.org/10.1016/j.cirpj.2008.06.003
[16] Chiou, R.Y.S., Liang, S.Y. (1999). Chatter frequency in turning considering tool compliance and wearland. Journal of Manufacturing Science and Engineering, 121(2): 307-311. https://doi.org/10.1115/1.2831221
[17] Mohammadi, Y., Ahmadi, K. (2019). Frequency domain analysis of regenerative chatter in machine tools with linear time periodic dynamics. Mechanical Systems and Signal Processing, 120: 378-391. https://doi.org/10.1016/j.ymssp.2018.10.029
[18] Berger, B.S., Minis, I., Harley, J., Rokni, M., Papadopoulos, M. (1998). Wavelet based cutting state identification. Journal of Sound and Vibration, 213(5): 813-827. https://doi.org/10.1006/jsvi.1997.1495
[19] Menon, S., Schoess, J.N., Hamza, R., Busch, D. (2000). Wavelet-based acoustic emission detection method with adaptive thresholding. In Smart Structures and Materials 2000: Sensory Phenomena and Measurement Instrumentation for Smart Structures and Materials, 3986: 71-77. https://doi.org/10.1117/12.388093
[20] Singh, G.K., Ahmed, S.A.K.S.A. (2004). Vibration signal analysis using wavelet transform for isolation and identification of electrical faults in induction machine. Electric Power Systems Research, 68(2): 119-136. https://doi.org/10.1016/S0378-7796(03)00154-8
[21] Babouri, M.K., Ouelaa, N., Djebala, A. (2016). Experimental study of tool life transition and wear monitoring in turning operation using a hybrid method based on wavelet multi-resolution analysis and empirical mode decomposition. The International Journal of Advanced Manufacturing Technology, 82(9): 2017-2028. https://doi.org/10.1007/s00170-015-7530-3
[22] Shrivastava, Y., Singh, B. (2018). Possible way to diminish the effect of chatter in CNC turning based on EMD and ANN approaches. Arabian Journal for Science and Engineering, 43(9): 4571-4591. https://doi.org/10.1007/s13369-017-2993-1
[23] Shrivastava, Y., Singh, B. (2018). Assessment of stable cutting zone in CNC turning based on empirical mode decomposition and genetic algorithm approach. Proceedings of the Institution of Mechanical Engineers, Part C: Journal of Mechanical Engineering Science, 232(20): 3573-3594. https://doi.org/10.1177/0954406217740163
[24] Li, X., Mei, D.Q., Chen, Z.C. (2011). Feature extraction of chatter for precision hole boring processing based on EMD and HHT. Guangxue Jingmi Gongcheng(Optics and Precision Engineering), 19(6): 1291-1297.
[25] Huang, N.E. (2014). Hilbert-Huang Transform and its Applications, 16. World Scientific.
[26] Quek, S.T., Tua, P.S., Wang, Q. (2003). Detecting anomalies in beams and plate based on the Hilbert–Huang transform of real signals. Smart Materials and Structures, 12(3): 447. https://doi.org/10.1088/0964-1726/12/3/316
[27] Gao, B., Woo, W.L., Dlay, S.S. (2010). Single-channel source separation using EMD-subband variable regularized sparse features. IEEE Transactions on Audio, Speech, and Language Processing, 19(4): 961-976. https://doi.org/10.1109/TASL.2010.2072500
[28] Salman, A.H., Ahmadi, N., Mengko, R., Langi, A.Z., Mengko, T.L. (2016). Empirical mode decomposition (EMD) based denoising method for heart sound signal and its performance analysis. International Journal of Electrical & Computer Engineering, 6(5): 1-8.
[29] Shrivastava, Y., Singh, B., Sharma, A. (2018). Identification of chatter in turning operation using WD and EMD. Materials Today: Proceedings, 5(11): 23917-23926. https://doi.org/10.1016/j.matpr.2018.10.184
[30] Cao, H., Zhou, K., Chen, X. (2015). Chatter identification in end milling process based on EEMD and nonlinear dimensionless indicators. International Journal of Machine Tools and Manufacture, 92: 52-59. https://doi.org/10.1016/j.ijmachtools.2015.03.002
[31] Shrivastava, Y., Singh, B. (2019). A comparative study of EMD and EEMD approaches for identifying chatter frequency in CNC turning. European Journal of Mechanics-A/Solids, 73: 381-393.
[32] Shrivastava, Y., Singh, B. (2020). Online monitoring of tool chatter in turning based on ensemble empirical mode decomposition and Teager Filter. Transactions of the Institute of Measurement and Control, 42(6): 1166-1179. https://doi.org/10.1177/0142331219885511
[33] Shrivastava, Y., Neha, E., Singh, B., Shrivastava, P.K., Murthy, K.V.S.R., Nandan, D. (2022). Analysis of regenerative raw signals using variational mode decomposition. Traitement du Signal, 39(1): 299-304. https://doi.org/10.18280/ts.390131
[34] Huang, N.E., Shen, Z., Long, S.R., Wu, M.C., Shih, H.H., Zheng, Q., Liu, H.H. (1998). The empirical mode decomposition and the Hilbert spectrum for nonlinear and non-stationary time series analysis. Proceedings of the Royal Society of London. Series A: Mathematical, Physical and Engineering Sciences, 454(1971): 903-995. https://doi.org/10.1098/rspa.1998.0193
[35] Shrivastava, Y., Singh, B., Sharma, A.J.E.T. (2018). Analysis of tool chatter in terms of chatter index and severity using a new adaptive signal processing technique. Experimental Techniques, 42(2): 141-153. https://doi.org/10.1007/s40799-017-0208-z