Rui Ma*![]() | Kaiyuan Sun | Zilong Wang | Biao Lei
| Kaiyuan Sun | Zilong Wang | Biao Lei
© 2025 The authors. This article is published by IIETA and is licensed under the CC BY 4.0 license (http://creativecommons.org/licenses/by/4.0/).
OPEN ACCESS
Borehole thermal energy storage (BTES) can solve the mismatch between production and utilization of industrial waste heat and other energy, improve energy utilization efficiency, and reduce carbon emissions. A large body of literature has been published to study the thermal storage performance of borehole heat exchangers (BHE) under various operating conditions, but the fluid quantity limitation has not been considered in the research process. In practical projects, there is a limit to the amount of fluid that can be produced. This paper establishes a three-dimensional vertical BHE model based on project data and performs model validation to study the impact of flow velocity, temperature, and initial ground temperature on its thermal storage performance under fluid volume limitation. The results showed that the heat transfer rate and heat storage amount of BHE increased with fluid temperature and decreased with initial ground temperature. Meanwhile, the heat transfer rate of BHE increased with flow velocity, but the heat storage amount decreased with flow velocity. The ideal flow velocity under the parameters of this research is 0.1 m/s, and the continuous operating mode outperforms the intermittent operation mode.
borehole heat exchanger, flow velocity, thermal storage characteristics, numerical simulation
Throughout the world, with the growth of the population and rapid industrial development, humans face a huge energy crisis and an environmental crisis. How to save energy and protect the environment is a common issue and problem faced by the world [1-5]. Energy storage can solve the mismatch between production and utilization of energy, such as solar energy and industrial waste heat, improve the efficiency of energy utilization, and thus reduce carbon dioxide emissions. Energy storage technology is primarily separated into two types: thermal and electrical storage, given that thermal storage technology is a useful tool for balancing the supply and demand for energy [6]. In addition to being categorized as short-term and long-term heat storage depending on how long they last to store heat, thermal storage can also be categorized as sensible heat storage, latent heat storage, and thermochemical heat storage depending on how they store heat [7]. Long-term heat storage can store excess heat in the summer and release it in the winter, which is also known as seasonal thermal power reserve (STES) [8]. The most common methods of STES are (1) temperature storage in aquifer (2) borehole thermal energy storage (3) tank thermal energy storage (4) pit thermal energy storage (5) cavern thermal energy storage. Borehole thermal energy storage stores heat underground through BHE, and this heat storage technology has the advantages of simple maintenance and fewer site requirements, and has been used more in STES. There are currently many BTES facilities in operation in Sweden, the Netherlands, Germany, and other countries [9]. The world's largest BTES was founded in Chifeng, China [10, 11]. The system has 468 vertical single-U BHEs at a depth of 80 m, a thermal storage volume of 500,000 m³, a heat source of industrial waste heat provided by a nearby copper company (70 MW), and 336 (1002 m2) solar collectors.
The operating parameters of BTES directly affect the system efficiency, and the effects of different operating parameters on BTES have been studied by numerous scholars [12-14]. During the operation of BHE, the fluid velocity is directly related to the heat exchange and pumping costs [15]. The fluid velocity and operation mode have an important influence on the energy efficiency of BHE [16-20]. Li et al. [16] established a mathematical model of heat and mass transfer in the HST and BHE integrated system (named HST - BHE system), and studied the effects of BHE structural parameters and soil thermal properties on soil heat storage characteristics. The results show that under certain conditions, the soil heat storage capacity of the HST - BHE system and the temperature difference of BHE inlet and outlet increase with the increase of borehole length, buried pipe spacing or soil thermal conductivity, but decrease with the increase of borehole radius. The borehole temperature of BHE increases with the increase of buried pipe spacing, and decreases with the increase of borehole depth, borehole radius or soil thermal conductivity. Guo and Yang [17] used TRNSYS software simulations to predict the energy efficiency and exergy efficiency of the BTES system under quasi-steady-state operation. A sensitivity analysis was also performed for different design parameters. The results show that the total borehole length has the greatest effect on the energy and exergy efficiency of BTES, followed by the borehole spacing and flow rate. Li et al. [18] simulated coaxial borehole heat exchangers (CBHE) in three dimensions and proposed an improved TRT method for CBHE. The results show that the influence of inlet temperature and flow velocity on heat transfer rate is more significant than that of backfill grouting material, thermal conductivity of inner pipe, and drilling depth and the circulating flow velocity between 0.3 m/s and 0.4 m/s can make the system have better performance. Wang et al. [19] established a three-dimensional numerical model considering karst fractures to study the influence of karst fracture water on the heat transfer performance of down-hole heat ex-changer, and the results showed that: (1) the groundwater flow in karst fractures significantly improved the heat exchange efficiency between the borehole heat ex-changer (BHE) and the surrounding rock, and (2) the influence order of different fracture characteristics on the heat transfer performance of BHE was as follows: fracture water velocity fracture pore size fracture depth fracture flow direction fracture water temperature. He et al. [20] established a three-dimensional coaxial borehole heat exchanger, and analyzed the influence of water inlet velocity and seepage velocity through a series of simulations based on the typical geology of Xiong’ an New Area, and the results showed that the increase of fluid flow velocity in the tube led to a larger temperature difference between the inlet and outlet, and there was an optimal inlet flow rate to balance heat injection and enhance heat transfer to achieve the optimal heat transfer rate, which was 0.4 m/s in this study.
The influencing factors of the thermal efficiency of single-tube BHE were studied in Literature [21-24]. The Simulation study of Mousavi Ajarostaghi et al. [21] on a single U-tube BHE found that the inlet temperature, flow rate, and thermal performance of the BHE were significantly affected by the thermal conductivity of the backfill material. The outlet temperature can be reduced by reducing the flow rate and the elevation of the thermal conductivity of the backfill material. Han [22] simulated the effects of single U-BHE spacing, backfill material, and flow rate on the heat transfer performance of BHE and soil thermal performance. The results show that the heat transfer performance of BHE is enhanced when the pipe spacing is 5.2 m, the backfill material is sandy soil, and the inlet flow velocity is 0.9 m/s. Kerme and Fung [13] analyzed the heat transfer in a single-U-tube borehole heat exchanger (BHE) and used an implicit numerical method (accompanying thermal resistance model) applied to the heat transfer equation obtained from the energy balance to obtain the solution. The effects of fluid mass flow rate and grouting thermal conductivity on average fluid temperature, borehole, grouting and surface temperature, borehole load and borehole thermal efficiency were studied. It was found that increasing the mass flow rate of the fluid could increase the heat transfer rate, but the effect of the grouting thermal conductivity was not significant. Kerme and Fung [23] also established numerical heat transfer models for single U-tube BHE and double U-tube BHE for dynamic simulation and analysis, and compared the two borehole heat exchangers from the perspective of thermal performance in heating and cooling operation modes. A detailed sensitivity analysis of the BHE was also carried out by studying the effects of important borehole parameters, thermal characteristics and working fluids on the thermal properties of the BHE in the double U-tube. The simulation results show that the thermal efficiency of single and double U-tube BHE is 0.24 and 0.31 at steady state, respectively. The borehole thermal resistance of the single U-tube BHE was higher than that of the double U-tube BHE, which was 0.47 and 0.31 m.K/W, respectively.
Literature [24-26] examines measures that can improve the thermal efficiency of single-U-tube borehole heat exchangers (BHEs). Serageldin et al. [24] introduced a new, efficient, and cost-effective gasket and performed short-term and long-term transient numerical simulations to compare the thermal and energy performance of a ground source heat pump system with a single U-tube with an elliptical cross-section and a conventional single U-tube with a novel gasket, and investigated the effects of using different gasket cross-sections, materials, and lengths on thermal performance. The results showed that a single aluminum gasket with an elliptical and fin cross-section reduced the borehole thermal resistance (Rb) by 25% and 28%, respectively, compared to a single U-tube with an elliptical cross-section and a single U-tube with a circular cross-section. In addition, it has a 9.5% increase in coefficient of performance (COP) in winter compared to a single U-tube with a circular cross-section. Chowdhury et al. [25] improved the thermal efficiency of the modified vertical U-tube GHE by adjusting the leg spacing of the GHE and adding a spiral tube to the lower section, and found that by increasing the leg spacing in the upper part of the GHE and maintaining the same leg spacing in the lower part, the heat transfer rate increased, and the model with the best heat transfer performance obtained after adjustment was the combination of the upper straight and the lower spiral U-shape, with a spiral diameter of 100 mm, and the heat transfer rate was increased by 31.2% compared with the traditional U-tube GHE. Jahanbin et al. [26] proposed a vertical GHE with an elliptical U-tube to improve the thermal performance of the GCHP system, and found that the vertical GHE with an elliptical U-tube was more thermally efficient than the traditional vertical GHE.
The above literature shows that flow rate, temperature, and intermittent mode have a significant effect on BHE. However, fluid volume limitations were not considered in the study. In fact, there is a limit to the volume of hot water that can be produced per day, whether it is solar or industrial waste heat. In this paper, a three-dimensional vertical single U-tube BHE model is developed based on engineering data. The axial and radial directions confirm the grid independence. By contrasting the simulation findings with experimental data from published experiments, the model's dependability is shown. According to this model, the heat storage of BHE was simulated for 480 hours, and the effects of inlet temperature (65℃, 70℃, 75℃), fluid velocity (0.1℃, 0.2℃, 0.3℃), and initial ground temperature (10℃, 15℃) on the heat storage performance of vertical single U-tube BHE were studied.
2.1 Object of research and model description
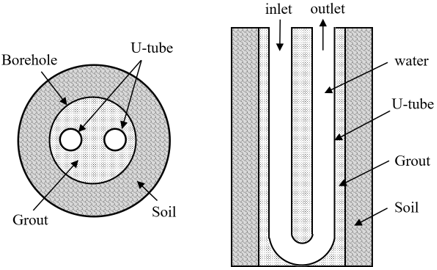
In this study, a vertical single U-BHE model was developed with reference to the BTES project in Chifeng, China [10, 11, 17, 27]. The U-tube was installed at a depth of 80m, with a borehole diameter of 150 mm, inner and outer diameters of 23.2 mm and 32.0 mm. According to the literature relation $r0.5ma{{x}_{max}}$ [28], a cylinder with a diameter of 5 m is chosen as the ground computational domain of this research. Figure 1 is the structural diagram of vertical BHE, where the BHE's horizontal cross section is on the left and its vertical cross section is on the right. Water is the circulating fluid, and Table 1 enumerates the soil's and backfill material's thermal physical characteristics.
Figure 1. Schematic diagram of vertical BHE (left: horizontal cross section; Right: vertical cross section)
Table 1. Thermal physical properties of grout materials and soils [10]
|
|
Thermal Conductivity (W/m∙K) |
Specific Heat Capacity J/(kg∙K) |
Density (kg/m3) |
|
Grout |
2.2 |
800 |
1600 |
|
Soil |
0.852 |
1103 |
1500 |
2.2 Assumptions
Convection heat transfer between a fluid and the pipe wall, as well as conduction heat transfer between the pipe wall and the backfill material, are the primary components of the BHE heat transfer process, backfill material and soil. Due to the large physical model of BHE, uneven soil distribution, and the complexity of the heat transfer process, the following assumptions are made:
2.3 Mathematical description
The continuity equation, momentum equation and energy equation of the fluid are given by Eqs. (1)-(3) [29-31]. The energy equation of the soil during heat storage is given by Eq. (4).
$\nabla \cdot \vec{u}=0$ (1)
$\frac{\partial \vec{u}}{\partial t}+\nabla \cdot(\vec{u} \vec{u})=-\frac{1}{\rho} \nabla p+\nabla \cdot(v \nabla \vec{u})-g$ (2)
$\frac{\partial T}{\partial t}+\nabla \cdot(\vec{u} T)=\nabla \cdot\left(\frac{\lambda}{\rho c_P} \nabla T\right)$ (3)
$\frac{\partial(\rho H)}{\partial t}=\nabla \cdot(\lambda \nabla T)$ (4)
where, in Eqs. (1)-(4) $\vec{u}$ is the velocity vector; $\rho$ is the fluid density; p is the pressure vector; $\upsilon$ is the molecular viscosity; g is the gravitational acceleration; T is the temperature vector; $\lambda$ and ${{c}_{p}}$ are the thermal conductivity and specific heat capacity of the fluid, respectively; H is the sensible enthalpy.
2.4 Simulation method and boundary condition
For turbulent flow in the tube, the standard k-ε model was applied. SIMPLE was used as the solution algorithm with a time step of 30 s.
In the actual project, insulation will be laid at ground level, so adiabatic boundary conditions are used on the upper surface of the model. The boundary condition for the lower and side surfaces of the model is ${{T}_{cons\tan t}}=10$℃ [9]. The heat transfer between the fluid and the wall surface uses the Robin boundary, which can be expressed by Eq. (5).
$-\lambda \frac{\partial t}{\partial n}=h\left(t_w-t_f\right)$ (5)
where, h is the heat transfer coefficient between fluid and inner U-tube wall; ${{t}_{w}}$ and ${{t}_{f}}$ is the transient temperature of fluid and inner U-tube wall.
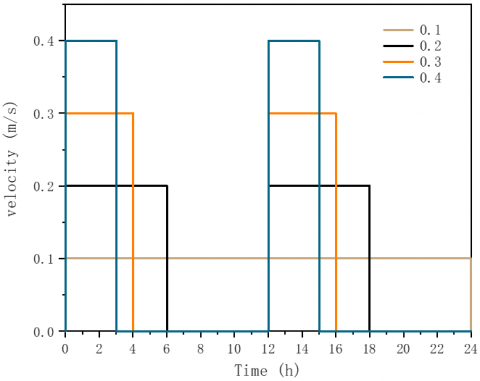
The Chifeng project can provide 14.7 m³ of 75℃ hot water per day to a single BHE [10, 17], and the faster the flow rate, the shorter the running time.
Figure 2 shows the operation mode at different velocities using User-Defined-Function for flow velocity control.
Figure 2. BHE operation mode at different velocities
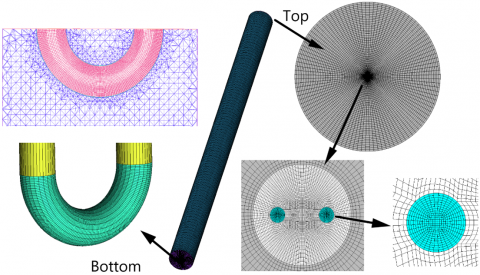
3.1 Grid independency
Mixed grids are used, with unstructured grids near the U-tube elbow and structured grids at the remaining locations. The grid details are shown in Figure 3.
Figure 3. BHE grid details
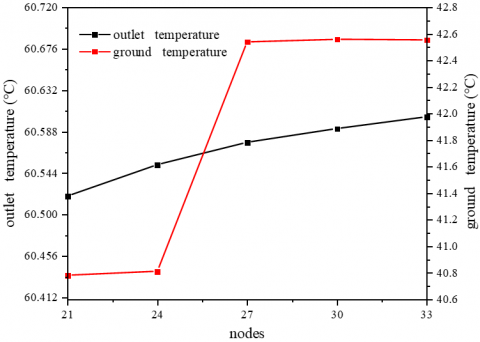
The grid has a significant impact on the accuracy and calculation time of the numerical simulation. The mesh independence is demonstrated in this article in both the radial and axial dimensions. The direct heat transfer with the pipe is backfill material, so the radial independence is verified by changing the in-pipe and backfill nodes. The grid was verified for five cases of 21, 24, 27, 30 and 33 nodes in the pipe, and the outlet temperature and the ground temperature at a depth of 40 m at 0.15 m from the center were recorded.
The ground region is not in direct contact with the fluid, so the grid of this region is not changed during the independence verification, and the number of nodes is 50. Figure 4 shows the radial grid-independence results. The outlet temperature only increases by 0.0842℃ when the nodes increase from 21 to 33. The ground temperature increases with the number of nodes in the tube, but the ground temperature also stabilizes when the number of nodes in the tube increases to 27, and finally 30 nodes in the tube are selected as the grid division scheme.
Figure 4. Radial grid-independence
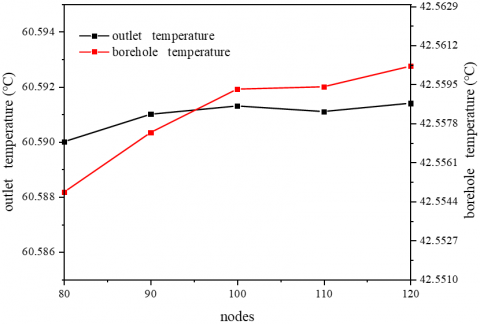
Axial grid-independence was verified for five cases with axial nodes of 80, 90, 100, 110, and 120. Figure 5 shows the grid-independent results for the axial direction. The axial grid has less impact on outlet temperature and detection point than the radial grid, and the variance in both the outlet temperature and the ground temperature is less than 0.1℃. Finally, 100 axial nodes were chosen based on computation time and stability.
Figure 5. Axial grid-independence
3.2 Model validation
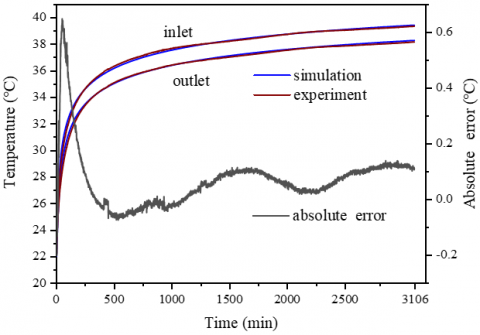
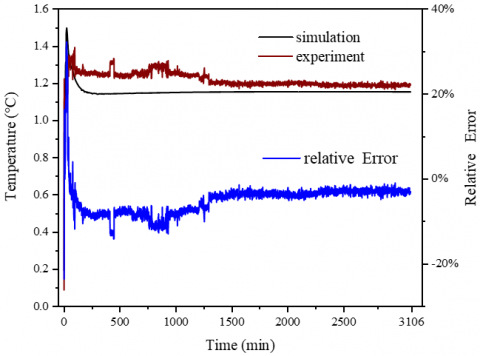
This research uses experimental data from published works as the basis for its model validation [32, 33]. Based on the experimental site, a geometric model of 1.8 m$\times $1.8 m$\times $18.3 m is created, and the fluid temperature, flow rate, wall temperature, and initial temperature are all consistent with the experimental data. Inlet and outlet temperatures, both simulated and experimental, are plotted in Figure 6. As shown in the figure, the numerical simulation's outlet temperature and the experimental results are rather close to one another. The average absolute error between the two is within 0.068℃. The maximum error appears at the beginning of the experiment, mainly because the system operation is unstable at the beginning of the simulation. Figure 7 shows the difference in inlet and outlet temperatures between the experiment and the simulation, and their relative errors. As shown in the figure, the simulated data is in good agreement with the experimental data, and the average relative error between the two is 5.09%.
Figure 6. Inlet and outlet temperature simulation and experimental values
Figure 7. Inlet and outlet temperature difference simulation and experimental values
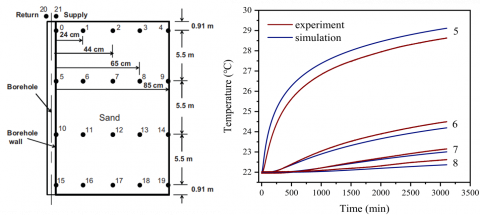
Figure 8 shows the comparison of experimental and simulated temperatures at different radial positions (5, 6, 7, 8). From Figure 8, the temperatures at these 4 points are in good agreement with the experimental values. The largest error occurs at point 5. The main reasons for this are that the aluminum tubes used as borehole walls in the experiments were not added in the simulation modeling and that the effect of groundwater seepage was neglected.
Figure 8. Experimental and simulated values of temperature at different radial positions
4.1 Flow velocity and inlet temperature
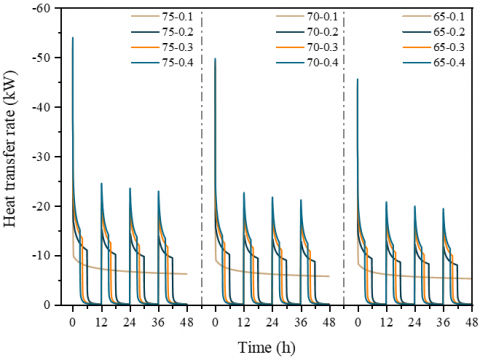
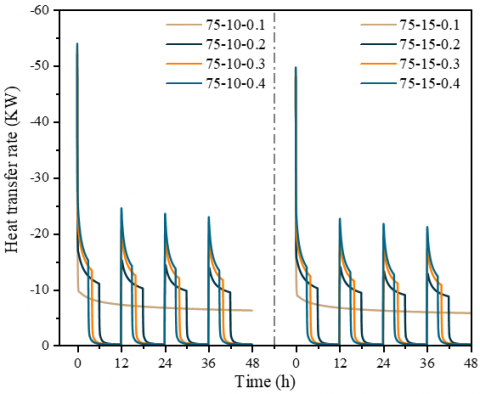
Figure 9 shows the heat transfer rate of BHE during 2 days at different fluid velocities (0.1, 0.2, 0.3, and 0.4 m/s) and temperatures (65, 70, and 75℃). As shown in Figure 9, with the increase of operation time, the heat exchange rate decreases, and this phenomenon is most obvious in the early stage of operation, which is due to the gradual decrease in heat exchange temperature difference with operation time. Furthermore, the heat transfer rate fluctuates at flow velocities of 0.2, 0.3, and 0.4 m/s. This is because intermittent operation relieves the heat buildup in the soil. The rate at which heat is transferred rises with both temperature and flow velocity. This results from an increase in the convective heat transfer coefficient between the fluid and the wall as flow velocity increases, and as the temperature rises, the heat transfer temperature differential grows.
Figure 9. Heat transfer rate of BHE at different flow velocities and temperatures
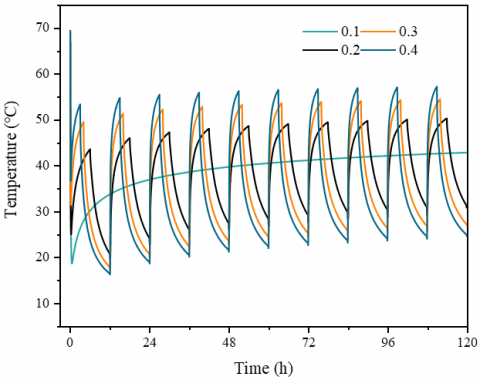
Figure 10 shows the outlet temperature of BHE at different speeds when the inlet temperature is 75℃ within 5 days. It can be seen from the figure that the outlet temperature of intermittent operation (0.2, 0.3, 0.4 m/s) fluctuates, but it is still higher than that of continuous operation (0.1 m/s) during the operation period, which indicates that the high flow rate makes the heat transfer insufficient. Meanwhile, the outlet temperature rises with the running time increases, and the temperature rise is more rapid at the beginning of running, which is related to the thermal accumulation of soil.
Figure 10. Outlet temperature of BHE at different fluid velocities
Figure 11 shows the soil temperature of the BHE at different velocities with an inlet temperature of 75℃. The soil temperature at 0.15 m and 0.5 m from the center at a depth of 40 meters on the inlet side was monitored. In Figure 11, the upper line represents the 0.15 m monitoring point, whereas the lower line represents the 0.5 m monitoring point. It can be seen from the figure that the soil temperature rises with the increase of operating time, and it is more significant in the early stage of operation. The soil temperature at 0.5 m has a larger lag than at 0.15 m, and the temperature fluctuations are less, but the two have the same trend as a whole. The soil temperature decreases with the increase of the flow velocity, which indicates that the low flow velocity can store more heat in the soil.
Figure 11. Soil temperature at different velocities
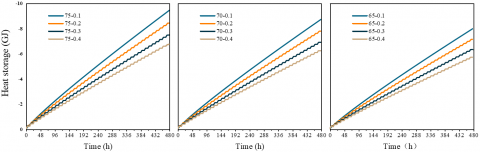
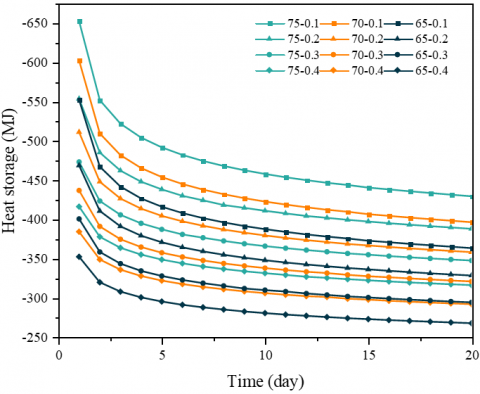
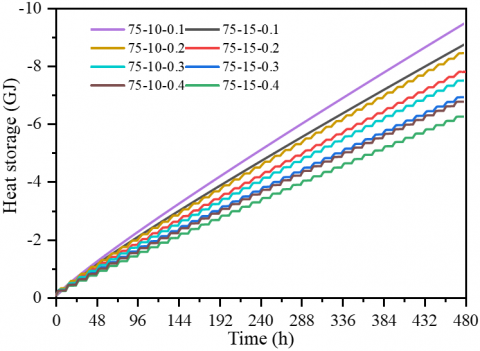
Figure 12 shows the heat storage amount of BHE at different fluid velocities and temperatures over 20 days. It can be seen that with the increase of operating time, there are obvious differences in the heat storage amount of BHE at different velocities and temperatures. As temperature rises, so does the amount of heat storage, which falls as flow velocity rises. Because an increase in flow velocity shortens the heat transfer time and results in insufficient heat transmission, this conclusion is consistent with the phenomenon indicated by the outlet temperature and soil temperature but differs from that indicated by the heat transfer rate. Table 1 shows the heat storage amount for 20 days of BHE operation at different fluid velocities and temperatures. From Table 1, the difference in heat storage between the flow velocities of 0.1 m/s and 0.2 m/s at 65, 70, and 75℃ is 859850, 938350, and 1029380 kJ, respectively, and the difference becomes larger with the increase in temperature, which also occurs at the flow velocities of 0.3 m/s and 0.4 m/s. Therefore, it can be indicated that the advantage of low flow velocity operation becomes more obvious with inlet temperature.
Figure 12. Heat storage amount of BHE at different flow velocities and temperatures
The change of daily heat storage amount can better reflect the overall change trend. Figure 13 shows the daily heat storage of BHE for different fluid velocities and temperatures. It can be seen that the daily heat storage at different temperatures decreases as the operating time increases, which is most obvious at the start of operation. It aligns with the declining heat exchange rate trend depicted in Figure 9 and the increasing trend of outlet temperature shown in Figure 10. The daily heat storage amounts decrease with increasing flow velocity, which supports the trend depicted in Figure 12 of total heat storage decreasing with increasing velocity and the increasing trend of soil temperature shown in Figure 11.
Figure 13. Daily heat storage amount of BHE at different flow velocities and temperatures
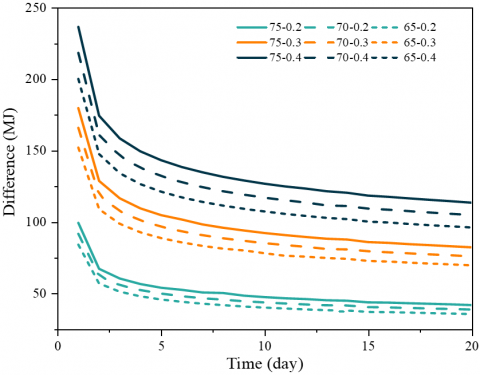
The Figure 13 analysis has shown that a flow velocity of 0.1 m/s can store more heat. Figure 14 shows the difference between the daily heat storage at fluid flow velocities of 0.2, 0.3, and 0.4 m/s and at flow rates of 0.1 m/s. From the figure, the difference of daily heat storage decreases with the running time, which is because the heat buildup phenomenon is more serious in continuous operation than in intermittent operation. Moreover, the heat storage difference increases with the flow velocity, which is consistent with the trend of decreasing daily heat storage with the increase of flow velocity shown in Figure 13. The heat storage differential increases with temperature, which is consistent with the result shown in Table 2 that the advantage of low flow velocity operation is greater as the temperature increases.
Table 2. Heat storage amount for 20 days of operation at different velocities and temperatures
|
${{T}_{\mathbf{in}}}~\left( {}^\circ \mathbf{C} \right)$ |
${{V}_{\mathbf{in}}}~\left( \mathbf{m}/\mathbf{s} \right)$ |
Heat Storage $\left( \mathbf{kJ} \right)$ |
|
75 |
0.1 |
9,479,620 |
|
0.2 |
8,450,240 |
|
|
0.3 |
7,496,040 |
|
|
0.4 |
6,767,080 |
|
|
70 |
0.1 |
8,745,800 |
|
0.2 |
7,807,450 |
|
|
0.3 |
6,920,990 |
|
|
0.4 |
6,248,250 |
|
|
65 |
0.1 |
8,016,980 |
|
0.2 |
7,157,130 |
|
|
0.3 |
6,344,300 |
|
|
0.4 |
5,727,080 |
Figure 14 shows that the daily heat storage amount gap gradually narrows. With the operation time increasing, the daily heat storage at the flow velocity of 0.2, 0.3 and 0.4 m/s will be equal to or even exceed the daily heat storage at the flow velocity of 0.1 m/s. However, when considering the fluid volume limitation, the reverse overrun will come later, and the faster the flow rate comes, the later it will come. Therefore, the above results show that continuous operation is better than intermittent operation, and the optimal flow rate is 0.1 m/s under the conditions of this study. In practical engineering, if the heat source is industrial waste heat coupled with solar energy or other forms, it can continuously provide circulating fluid for the BHE, and the recommended system operating flow velocity is 0.1 m/s. If the heat source cannot continuously provide circulating fluid, in order to reduce the size of the circulating water tank, it is recommended that the system operates at a flow velocity of 0.2 m/s or 0.15 m/s.
Figure 14. Differences in BHE daily heat storage amount at various flow velocities and temperatures
4.2 Initial ground temperature
Figure 15 shows the heat transfer rate of the BHE at different initial ground temperatures (10 and 15℃). It can be seen that the heat transfer rate decreases with the increase of operating time, which is most obvious at the beginning of the operation. When the initial ground temperature increased from 10℃ to 15℃, the heat transfer rate of BHE decreased.
Figure 16 shows the heat storage of BHE at different initial ground temperatures (10 and 15℃). It can be seen that with operating time, the heat storage amount of BHE under different working conditions is different. Because of the reduction in the heat transfer temperature differential caused by a rise in the starting ground temperature, the BHE's heat storage capacity diminishes as the ground temperature increases.
Figure 15. Heat transfer rate of BHE at different initial ground temperatures
Figure 16. Heat storage of BHE at different initial ground temperatures
Table 3 lists the heat storage amount of the BHE for 20 days at different fluid velocities and initial ground temperatures. It can be seen that when the initial ground temperature is 10 and 15℃, the difference in heat storage amount between 0.1 m/s and 0.2 m/s is 1,029,380 and 938,490 kJ, respectively, and the difference decreases with the increase of the initial ground temperature. This phenomenon also occurs at 0.3 m/s and 0.4 m/s. Therefore, it can be indicated that the lower the ground temperature, the more obvious the advantage of low flow velocity operation. Combined with the conclusion drawn above, the higher the inlet temperature, the more advantageous it is to operate at a low flow velocity. Then make the following summary: the greater the temperature difference between the fluid and the ground, the more obvious the advantage of low flow velocity operation.
Table 3. Heat storage amount for 20 days at different velocities and initial ground temperatures
|
${{T}_{\mathbf{in}}}~\left( {}^\circ \mathbf{C} \right)$ |
${{V}_{\mathbf{in}}}~\left( \mathbf{m}/\mathbf{s} \right)$ |
Heat Storage (kJ) |
|
10 |
0.1 |
9,479,620 |
|
0.2 |
8,450,240 |
|
|
0.3 |
7,496,040 |
|
|
0.4 |
6,767,080 |
|
|
15 |
0.1 |
8,745,850 |
|
0.2 |
7,807,360 |
|
|
0.3 |
6,920,330 |
|
|
0.4 |
6,248,010 |
In this paper, a three-dimensional vertical single U-tube BHE model is established based on engineering data. The grid independence is verified by the axial and radial directions. By comparing the simulation results with the experimental data in the literature, it is proved that the model is reliable in simulating fluid temperature and soil temperature. Based on this model, the heat storage of BHE was simulated for 480 hours, and the effects of inlet temperature (65℃, 70℃, 75℃), fluid velocity (0.1℃, 0.2℃, 0.3℃), and initial ground temperature (10℃, 15℃) on the heat storage performance of vertical single U-tube BHE were studied. The following can be concluded from this study:
Under constant temperature conditions, the heat exchange rate of BHE increases with increasing flow velocity. However, the heat exchange time of the fluid is shortened during high flow rate operation, the heat exchange is insufficient. Under the condition of limited fluid volume, the heat storage of BHE is greatest when the flow velocity is 0.1 m/s, and the heat storage of BHE diminishes as the flow velocity increases. When the temperature difference between fluid and soil increases, the advantage of operating at 0.1 m/s over 0.2, 0.3, and 0.4 m/s becomes more apparent. Under the conditions of this paper, the optimal heat storage flow velocity of BHE is 0.1 m/s.
The heat transfer rate and heat storage amount of BHE increase as fluid temperature rises and decrease as initial ground temperature rises.
Intermittent operation mode can alleviate the phenomenon of soil heat accumulation, which has certain advantages in long-term operation. However, under the condition of limited fluid volume, continuous operation has more sufficient heat transfer, thus having a greater heat storage amount. Under the conditions of this paper, continuous operation is preferable to intermittent operation.
Only the impacts of inlet temperature, flow velocity, and initial ground temperature on BHE heat storage performance were considered in this study. Many factors affecting BHE performance require further study. For example, installation depth, thermal conductivity and thermal diffusivity of grout, etc. These will need to be further studied.
This work is supported by the Inner Mongolia Autonomous Region Science and Technology Plan Project (Grant No.: 2021GG0253); Inner Mongolia Autonomous Region Natural Science Foundation (Grant No.: 2024MS05044); Young Scientific and Technological Talent (Grant No.: NJYT24012); Inner Mongolia Autonomous Region Scientific Research Projects of Universities (Grant No.: JY20220110).
[1] Borowski, P.F. (2022). Mitigating climate change and the development of green energy versus a return to fossil fuels due to the energy crisis in 2022. Energies, 15(24): 9289. https://doi.org/10.3390/en15249289
[2] Mahmood, H., Hassan, M.S., Meraj, G., Furqan, M. (2024). Agriculture's role in environmental sustainability: A comprehensive review of challenges and solutions. Challenges in Sustainability, 12(3): 178-189. https://doi.org/10.56578/cis120302
[3] Wang, Y., Guo, J., Gu, X. (2022). Current situation and future development trend of blue carbon economy in the era of energy crisis. Journal of Low Carbon Economy, 11: 54.
[4] Kabeyi, M.J.B., Olanrewaju, O.A. (2022). Sustainable energy transition for renewable and low carbon grid electricity generation and supply. Frontiers in Energy Research, 9: 743114. https://doi.org/10.3389/fenrg.2021.743114
[5] Khaleel, M., Yusupov, Z., Alderoubi, N., Abdul_jabbar, R.L., Elmnifi, M., Nassar, Y., Majdi, H.S., Habeeb, L.J., Abulifa, S. (2024). Evolution of emissions: The role of clean energy in sustainable development. Challenges in Sustainability, 12(2): 122-135. https://doi.org/10.56578/cis120203
[6] Zhang, Z., Ding, T., Zhou, Q., Sun, Y., Qu, M., et al. (2021). A review of technologies and applications on versatile energy storage systems. Renewable and Sustainable Energy Reviews, 148: 111263. https://doi.org/10.1016/j.rser.2021.111263
[7] Feng, P.H., Zhao, B.C., Wang, R.Z. (2020). Thermophysical heat storage for cooling, heating, and power generation: A review. Applied Thermal Engineering, 166: 114728. https://doi.org/10.1016/j.applthermaleng.2019.114728
[8] Zhou, Y., Min, C., Wang, K., Xie, L., Fan, Y. (2023). Optimization of integrated energy systems considering seasonal thermal energy storage. Journal of Energy Storage, 71: 108094. https://doi.org/10.1016/j.est.2023.108094
[9] Bolton, R., Cameron, L., Kerr, N., Winskel, M., Desguers, T. (2023). Seasonal thermal energy storage as a complementary technology: Case study insights from Denmark and The Netherlands. Journal of Energy Storage, 73: 109249. https://doi.org/10.1016/j.est.2023.109249
[10] Xu, L., Torrens, J.I., Guo, F., Yang, X., Hensen, J.L. (2018). Application of large underground seasonal thermal energy storage in district heating system: A model-based energy performance assessment of a pilot system in Chifeng, China. Applied Thermal Engineering, 137: 319-328. https://doi.org/10.1016/j.applthermaleng.2018.03.047
[11] Guo, F., Zhu, X., Zhang, J., Yang, X. (2020). Large-scale living laboratory of seasonal borehole thermal energy storage system for urban district heating. Applied Energy, 264: 114763. https://doi.org/10.1016/j.apenergy.2020.114763
[12] Wołoszyn, J. (2020). Global sensitivity analysis of borehole thermal energy storage efficiency for seventeen material, design and operating parameters. Renewable Energy, 157: 545-559. https://doi.org/10.1016/j.renene.2020.05.047
[13] Kerme, E.D., Fung, A.S. (2020). Heat transfer simulation, analysis and performance study of single U-tube borehole heat exchanger. Renewable Energy, 145: 1430-1448. https://doi.org/10.1016/j.renene.2019.06.004
[14] Brown, C.S., Kolo, I., Falcone, G., Banks, D. (2023). Repurposing a deep geothermal exploration well for borehole thermal energy storage: Implications from statistical modelling and sensitivity analysis. Applied Thermal Engineering, 220: 119701. https://doi.org/10.1016/j.applthermaleng.2022.119701
[15] Badenes, B., Mateo Pla, M.Á., Magraner, T., Soriano, J., Urchueguía, J.F. (2020). Theoretical and experimental cost–benefit assessment of borehole heat exchangers (BHEs) according to working fluid flow rate. Energies, 13(18): 4925. https://doi.org/10.3390/en13184925
[16] Li, W., Hu, Z., Geng, S., Wang, F., Liu, X., et al. (2023). Study on the influence of borehole heat exchanger structure and soil thermal property on soil heat storage characteristics of the HST-BHE system. Applied Thermal Engineering, 231: 120915. https://doi.org/10.1016/j.applthermaleng.2023.120915
[17] Guo, F., Yang, X. (2021). Long-term performance simulation and sensitivity analysis of a large-scale seasonal borehole thermal energy storage system for industrial waste heat and solar energy. Energy and Buildings, 236: 110768. https://doi.org/10.1016/j.enbuild.2021.110768
[18] Li, P., Guan, P., Zheng, J., Dou, B., Tian, H., Duan, X., Liu, H. (2020). Field test and numerical simulation on heat transfer performance of coaxial borehole heat exchanger. Energies, 13(20): 5471. https://doi.org/10.3390/en13205471
[19] Wang, X., Mao, R., Wu, H., Zhang, Z., Feng, R., Zhou, J., Chen, Y. (2025). Numerical study of influence of karst fracture water on heat transfer performance of borehole heat exchanger. Applied Thermal Engineering, 261: 125065. https://doi.org/10.1016/j.applthermaleng.2024.125065
[20] He, X., Li, J., Chen, Y., Niu, B. (2024). Analysis on heat transfer performance of coaxial borehole heat exchanger in a layered subsurface with groundwater. Heliyon, 10(18): e37442.
[21] Mousavi Ajarostaghi, S.S., Javadi, H., Mousavi, S.S., Poncet, S., Pourfallah, M. (2021). Thermal performance of a single U-tube ground heat exchanger: A parametric study. Journal of Central South University, 28(11): 3580-3598. https://doi.org/10.1007/s11771-021-4877-5
[22] Han, J. (2020). Comparison of heat transfer performance of vertical u-tube buried heat exchanger under different conditions. Hebei University of Science and Technology.
[23] Kerme, E.D., Fung, A.S. (2021). Comprehensive simulation based thermal performance comparison between single and double U-tube borehole heat exchanger and sensitivity analysis. Energy and Buildings, 241: 110876. https://doi.org/10.1016/j.enbuild.2021.110876
[24] Serageldin, A.A., Sakata, Y., Katsura, T., Nagano, K. (2020). Performance enhancement of borehole ground source heat pump using single U-tube heat exchanger with a novel oval cross-section (SUO) and a novel spacer. Sustainable Energy Technologies and Assessments, 42: 100805. https://doi.org/10.1016/j.seta.2020.100805
[25] Chowdhury, N.R., Toslim, A.H., Ali, M.H., Miyara, A. (2024). Numerical performance analysis of modified vertical U-tube ground heat exchangers by adjusting the impact of leg spacing. International Journal of Thermofluids, 24: 100959. https://doi.org/10.1016/j.ijft.2024.100959
[26] Jahanbin, A. (2020). Thermal performance of the vertical ground heat exchanger with a novel elliptical single U-tube. Geothermics, 86: 101804. https://doi.org/10.1016/j.geothermics.2020.101804
[27] Xu, L., Guo, F., Hoes, P.J., Yang, X., Hensen, J.L. (2021). Investigating energy performance of large-scale seasonal storage in the district heating system of Chifeng city: Measurements and model-based analysis of operation strategies. Energy and Buildings, 247: 111113. https://doi.org/10.1016/j.enbuild.2021.111113
[28] Eskilson, P. (1987). Thermal Analysis of Heat Extraction Boreholes.
[29] Zhang, L.M., Zhang, D., Cong, Y., Wang, Z.Q., Wang, X.S. (2023). Constructing a three-dimensional creep model for rocks and soils based on memory-dependent derivatives: A theoretical and experimental study. Computers and Geotechnics, 159: 105366. https://doi.org/10.1016/j.compgeo.2023.105366
[30] Yan, Y., Tu, J. (2023). Bioaerosol Characterisation, Transportation and Transmission. Singapore: Springer Nature Singapore, pp. 65-83. https://doi.org/10.1007/978-981-99-2256-7
[31] Li, C., Jiang, C., Guan, Y., Chen, K., Wu, J., Xu, J., Wang, J. (2024). Simplified method and numerical simulation analysis of pipe-group long-term heat transfer in deep-ground heat exchangers. Energy, 299: 131533. https://doi.org/10.1016/j.energy.2024.131533
[32] Zhang, L.M., Chao, W.W., Liu, Z.Y., Cong, Y., Wang, Z.Q. (2022). Crack propagation characteristics during progressive failure of circular tunnels and the early warning thereof based on multi-sensor data fusion. Geomechanics and Geophysics for Geo-Energy and Geo-Resources, 8: 172, https://doi.org/10.1007/s40948-022-00482-3
[33] Beier, R.A., Smith, M.D., Spitler, J.D. (2011). Reference data sets for vertical borehole ground heat exchanger models and thermal response test analysis. Geothermics, 40(1): 79-85. https://doi.org/10.1016/j.geothermics.2010.12.007