Amel Ksibi*![]() | Ahlem Walha
| Ahlem Walha![]() | Manel Ayadi
| Manel Ayadi![]() | Mohammed Zakariah
| Mohammed Zakariah![]() | Tagrid Alshalali
| Tagrid Alshalali![]() | Leila Jamel
| Leila Jamel![]()
© 2025 The authors. This article is published by IIETA and is licensed under the CC BY 4.0 license (http://creativecommons.org/licenses/by/4.0/).
OPEN ACCESS
Breast Cancer is one of the leading causes of mortality among women worldwide, and though the battle is won repeatedly, it still demands early and accurate diagnosis of the disease, which will provide the best chances of improved treatment outcomes. We propose an innovative deep learning framework that fuses DenseNet-based feature extraction with Squeeze-and-Excitation Networks (SENet) for breast cancer detection in this work. By leveraging SENet, we enable the model to adaptively recalibrate channel-wise feature responses, thereby enhancing the discriminative power of feature maps induced by the dense stream of DenseNet. The study utilizes two benchmark datasets: the first set of cases used was one from the Kaggle repository, which is balanced with 386 benign and 422 malignant cases, comprising 802 training, 129 testing, and 189 validation images. The second dataset is the BreakHis dataset, containing 9,109 microscopic images from 82 individuals at various magnifications. With these datasets being balanced and diverse, they provide a strong foundation for assessing the effectiveness of the proposed model. Additionally, we achieve remarkable performance on both datasets. The overall accuracy and the precision, recall, and F1 scores on the Kaggle dataset were 97.35%, 94.84%, 100%, and 97.35%, respectively. The model yielded staggering results, achieving an accuracy of 99.9% on the BreakHis dataset, with precision, recall, and F1 scores very close to perfection at 99.8%, 99.8%, and 99.8%, respectively. These results significantly outperform existing methods, demonstrating the effectiveness of dense features with channel attention. By combining SENet and DenseNet, we obtain a powerful diagnostic tool for breast cancer detection. Further work will be conducted to generalize this model to other medical imaging datasets and to make it real-time for clinical use.
breast cancer detection, SENet, DenseNet feature extraction, deep learning, medical imaging, BreakHis and Kaggle datasets
Although advances have been made in the battle against cancer, breast cancer is one of the most prevalent and, unfortunately, deadly forms of cancer in women worldwide [1, 2]. According to WHO, there were about 2.3 million new cases and 685,000 deaths from breast cancer worldwide in 2023 alone [3, 4]. The presence of Early detection significantly improves the survival rate and reduces treatment-related complications [5]. Mammography has traditionally been the gold standard for breast cancer screening; However, it suffers from high false positive rates, poor sensitivity in dense breast tissue, and significant inter-observer variability [6]. Automated diagnostic systems using deep learning have emerged as a promising solution for automating breast cancer detection processes, thereby enhancing the accuracy and consistency of such detection [7].
Over the recent past, convolutional neural networks (CNNs) have been developed to achieve better performance in medical imaging classification, segmentation, and anomaly detection tasks [8]. DenseNet can enjoy such structural advantages; however, when trained on massive datasets (mammographic images in this paper), the final layers may not be sufficiently focused on the most informative parts for classification [9]. However, DenseNet does not adequately guide the learning process to the most informative features during training, particularly when the image dataset becomes complex, such as mammographic images [8, 9]. To further adaptively recalibrate channel-wise feature responses by modeling interdependencies among channels, we are motivated to adopt an attention mechanism, such as the Squeeze and Excitation Network (SENet). Together, SENet and DenseNet can provide feature richness through depth-wise and dynamic channel attention, which may enhance the ability to discriminate between benign and malignant tissue regions. In addition, the challenge in deploying deep learning models for medical diagnostics is not only feature extraction, but also the effective integration (fusion) of features for prediction [10]. There are broadly defined feature fusion methods: early fusion, intermediate fusion, and late fusion. Early fusion feeds raw data (or low-level features) into the model before taking the effect of fusion, which, in most cases, leads to redundant or noisy data representations. Intermediate fusion sums feature at the hidden layers, but crucial semantic distinctions can still be diluted. In contrast, late fusion operates at high-level decision outcomes or semantic-rich features extracted from different models or layers. For this purpose, we propose a novel late fusion strategy that leverages SENet’s channel attention and DenseNet’s feature representation strengths. Moreover, by integrating these high-level features at the decision-making stage rather than at intermediate processing levels, we preserve more semantic information and enhance the discriminability of the model for subtle tissue anomalies [11, 12].
Our proposed late fusion strategy utilizes a two-branch architecture with this fusion. Hierarchical features are extracted using a pre-trained DenseNet-121 on one branch, and SENet modules are used on the second branch to emphasize the importance of feature channels. Both branches independently process input mammographic images to produce their respective, yet complementary, sets of high-dimensional feature embeddings [13, 14]. They are then fused via a custom-designed fusion layer that jointly normalizes the features, pools bilinearly, and reduces the dimension to a unified representation. By creating this late fusion technique, we not only retain the core characteristics of each source but also mitigate the problem of overfitting and model complexity often encountered when combining high-dimensional medical data.
Figure 1. Framework for enhancing breast cancer detection using SENet with DenseNet feature extraction
A framework for utilizing SENet and DenseNet in conjunction for enhancing breast cancer detection is illustrated in Figure 1. Feature extraction, attention-guided learning, and late fusion are employed to improve the accuracy and clinical applicability.
The significant contributions of this study are summarized as follows:
(1) Hybrid Architecture Design: This work proposes a new hybrid model that combines DenseNet121 with SENet, incorporating hierarchical feature extraction and channel-wise attention mechanisms to enhance classification performance for breast cancer.
(2) Feature Recalibration for Improved Accuracy: The model is adapted to embed SE blocks within DenseNet121, allowing it to adaptively highlight informative features and suppress their ineffective counterparts, thereby making the network more sensitive to these essential diagnostic features in breast cancer image classification.
(3) Efficient Use of Pre-trained Networks: The ImageNet pre-trained DenseNet121 model is utilized, employing transfer learning effectively with a small amount of medical imaging data to improve accuracy.
(4) Robust Data Preprocessing Pipeline: The proposed architecture demonstrates high performance for the binary classification task and serves as a reliable tool to aid clinicians in diagnosing benign and malignant breast tumors.
(5) Model Evaluation and Applicability: The proposed architecture demonstrates high performance in binary classification; therefore, it can be considered a reliable tool for assisting clinicians in detecting benign and malignant breast tumors.
In this work, we propose a novel, practical framework to enhance breast cancer detection by combining DenseNet feature extraction and SENet-reliant attention mechanisms, followed by a genetically reasonable subsequent fusion. The experimental results proved that this approach to breast cancer diagnosis has the potential to tackle up-to-date problems in computer-aided breast cancer diagnosis, and, accordingly, provide a potential direction for the development of intelligent medical imaging systems in the future.
Our paper is structured as follows: In Section 2, the pertinent research will be thoroughly analyzed. In Section 3, the datasets used in this research and the data preprocessing procedures are described. Section 4 presents the research approaches used. The experimental design and results are detailed in Section 5. Section 6 comprehensively analyzes the findings. Finally, Section 7 summarizes the results and outlines possible directions for further study.
In recent years, deep learning models, specifically CNNs and their various extensions, have made significant contributions to breast cancer detection. Several studies have been conducted on breast cancer detection and classification, employing multiple methodologies, datasets, and challenges. This review examines the current state of the latest research on the topic, highlighting key studies, methodologies, datasets used, limitations, and findings.
The incorporation of explainable AI (XAI) and fine-tuning techniques represents a significant advancement in breast cancer detection. An improved XAI-based DenseNet model for breast cancer detection was introduced by Talukder [15]. Breaking the image into fine blocks and visualizing them in various ways was done using the image preprocessing techniques. Not only do the results yield good accuracy (97.27% on BreakHis 200X images), but also, since it has not been validated in real-world clinical devices, the research has limited practical applicability. On the other hand, Khan et al. [16] proposed a specific framework termed RM DenseNet, which blends residual models with DenseNet for mammographic image classification. Then, the CBIS-DDSM dataset, which contains digital mammography images annotated with abnormalities, was used. To improve the model performance, RM DenseNet used Gaussian Blur, horizontal flipping, and data augmentation. Although 96.50% is a promising accuracy, further work on real-world validation is lacking.
The attention mechanism-enhanced hybrid DenseNet model was used in a third study by Samudrala and Mohan [17] for the semantic segmentation of breast cancer images. A histologically confirmed dataset was used to test the model in a Google Colab environment. Even with an accuracy of 94.68%, we have outperformed other models, such as FCN, Unet, and PSPNet. However, we also demonstrate that further real-world clinical testing is necessary before deploying these models in the wild. Upadhyay et al. [18] also proposed a meta-learning framework for breast cancer classification using DenseNet-121. In their approach, they employed a few-shot learning technique, even in scenarios where there was only a limited amount of labeled data. This study also demonstrated high performance (96% accuracy). Still, it has limitations due to data scarcity and the lack of real-world testing, suggesting that there is room for improvement in the framework.
Table 1. List of previous references that include datasets, methodology, limitations, and results
|
References |
Datasets |
Methodology |
Limitations |
Results |
|
[15] |
BreakHis 200X, 400X, BACH |
DenseNet modifications, image preprocessing, XAI, fine-tuning |
Controlled environment, no real-world clinical device |
BreakHis: 200X: 97.27%, 400X: 96.98%, BACH: 94.75% |
|
[16] |
CBIS-DDSM, digital mammography images with abnormal annotations |
RM-DenseNet, Gaussian blur, horizontal flipping, data augmentation |
Limited to digital mammography, no real-world validation |
Achieved 96.50% accuracy, outperforming AlexNet, VGG16, and ResNet50 |
|
[17] |
Histologically confirmed dataset, validated in Google Colab environment |
Hybrid DenseNet-121 with Att-PSPnet, Attention Gate mechanism |
No mention of real-world clinical deployment or testing |
Achieved 94.68% accuracy, outperforming FCN, Unet, PSPNet |
|
[18] |
Breast cancer medical images, limited labeled data |
Meta-learning, image segmentation, feature extraction, classifier refinement |
Limited labeled data requires further real-world testing |
Achieved 96% accuracy with minimal support samples |
|
[19] |
HAM10000, ISIC benchmark image database for skin cancer |
DSC-EDLMGWO, CLAHE, Wiener filter, SE-DenseNet, LSTM, ELM |
No mention of real-world clinical deployment or scalability |
Achieved 98.38% accuracy for HAM10000, 98.17% for ISIC |
|
[20] |
BreakHis, IDC (Invasive Ductal Carcinoma) histopathology images |
Deep CNN, EfficientNetB0, ResNet50, Xception, transfer learning |
Limited to specific histopathology images, no real-world deployment |
93.33% accuracy for BreakHis, 88.08% for IDC |
|
[21] |
BreCaHAD dataset for histological annotation and diagnosis |
Hybrid dilation deep learning, data augmentation, AlexNet |
Dataset-specific, potential issues with scanner and staining |
Achieved AUC of 96.15, outperforming previous methods |
|
[22] |
Thermography images collected from online sources |
CLAHE, RHDAO optimization, StackVRDNet, VGG16, ResNet, DenseNet |
Limited to thermography images, not generalizable to other methods |
Achieved 97.05% accuracy, 86.86% precision in simulation |
|
[23] |
CLAHE-enhanced mammogram images from Kaggle |
CNN+ViT model, DenseNet, Inception, SE ResNet, XceptionNet |
XceptionNet overfitting, reliance on large data |
The CNN+ViT model achieved 90.1% accuracy, and XceptionNet overfitted |
|
[24] |
BreaKHis dataset, breast cancer histopathological images |
MFF-HistoNet, CNN, Quantum Tensor Network, GLCM, LBP |
May struggle with extreme image distortions or noise |
98.8% accuracy at image level, 98.4% patient level |
|
[25] |
BreakHis breast cancer image dataset |
Cellular automata model, deep feature extraction, ANN classification |
Computational complexity, potential overfitting in complex models |
Achieved 97.2% accuracy, 7.95% improvement over methods |
In the domain of skin cancer, Dorathi Jayaseeli et al. [19] introduced skin cancer detection using the HAM10000 and ISIC benchmark datasets, employing a fusion between Squeeze Excitation DenseNet and a metaheuristic-driven ensemble deep learning model. An advanced approach was able to generate the very high accuracies of 98.38% on HAM10000 and 98.17% on ISIC, but there is little information revealed to us regarding real world deployment or scalability which handicaps us in being able to understand the real utility of the model, if for any of a myriad of the other workload scenarios. Moreover, a major hurdle in many of these studies is that they were not deployed in a real clinical setting. For example, models pre trained on such datasets like Xception and EfficientNetB0 were also used in a transfer learning approach by Joshi et al. [20] on the BreakHis and IDC histopathology datasets. While the model achieved an accuracy of 93.33% on BreakHis images, it has some bottlenecks that hinder its accuracy in making an inference in a clinical scenario, which would be extremely different from an idealized view of an image. In addition, the study by Aldhyani et al. [21] on breast cancer detection also employs a hybrid dilation-based deep learning method using the BreCaHAD dataset. However, their model showed an AUC of 96.15%, which far surpassed the previous models. However, in practice, the use of a specific dataset, along with the issues that scanner variability and staining processes pose for image quality, introduces some significant impediments to generalization. Furthermore, Bani Ahmad et al. [22] proposed an efficient hybrid deep learning framework using images from online sources for thermography-based breast cancer detection in the domain. They used CLAHE, RHDAO optimization, and StackVRDNet in their model, which achieved an accuracy of 97.05%. While it can be applied to thermography images, its generalizability may be limited to other imaging modalities, which hinders its widespread adoption. Furthermore, Sarkar et al [23] used CLAHE-enhanced mammogram images using CNN+ViT and various models. XceptionNet overfitted, implying its dependency on large data sets, a constraint, witnessed an accuracy of 90.1% under the CNN+ViT system.
Some more advanced hybrid models have been tackled in recent years. For histopathological image analysis, Mahmood et al. [24] proposed a multi-modal feature fusion network called MFF HistoNet based on CNN and quantum tensor networks. The BreaKHis dataset yielded an impressive 98.8% and 98.4% accuracy at the image and patient levels, respectively. Nevertheless, this method could still suffer extreme image distortions or noise in some cases. Also, Tangsakul and Wongthanavasu [25] reviewed the methodologies of breast histopathological image analysis, comparing computational methods and models. The models are emphasized as complex and prone to overfitting, especially with very complex architecture. However, their evaluation against the BreaKHis dataset was 7.95% better than existing methods, with an accuracy of 97.2%.
Ultimately, however, the application of advanced deep learning methods in breast cancer detection is beginning to gain mainstream adoption. Most studies report high accuracy. Nevertheless, there is a long way before real-world deployment, data scarcity, and other forms of generalization across imaging modalities. To overcome these limitations, future research should focus on enhancing model robustness, facilitating clinical deployment, and utilizing more diverse and comprehensive datasets.
Past references, including datasets used, methodological framework, limitations, and results, are presented in Table 1.
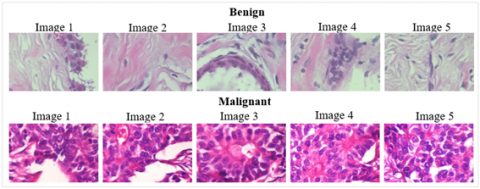
The dataset utilized for breast cancer identification was obtained from the publicly available Kaggle repository [26]. This dataset is classified into two distinct categories: benign and malignant.
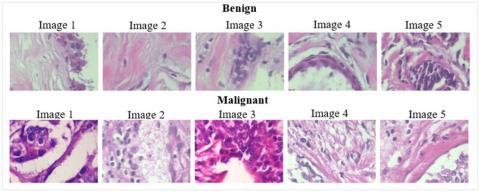
Figure 2. Benign and malignant samples from the training dataset
As shown in Figure 2, the dataset consists of colored images used for breast cancer identification. The photos are formatted as PNGs and do not include cancer region masks for segmentation techniques [26, 27]. This refers to the process of dividing the image into pixel segments to obtain a more detailed description of breast cancer detection. In this work, we will use the SENet deep learning model, which has been fine-tuned with an intelligent architecture to classify breast cancer photos. This model can extract comprehensive information from the entire image and provide a precise output for determining whether a given image is benign or malignant [28]. Additionally, the dataset includes three distinct subsets: the training subset, the validation subset, and the test subset. Figure 3 illustrates the distribution of training, testing, and validation sets.
There are a total of 802,129 training, testing, and validation images, which is a good number of images. Another critical aspect to examine in the dataset is the distribution of images across each class. It is essential to verify this analysis to ensure a balanced representation of both classes and prevent the formation of imbalances between the malignant and benign classes [26, 29]. Figure 4 shows the distribution in the training set.
Figure 3. Distribution of images in training, testing, and validation sets
Figure 4. Distribution of images in benign and malignant classes in the training set
The distribution of the two classes in the dataset was balanced, with 386 benign photos and 422 malignant images. The balance of class representation implies that appropriate training of both courses is possible, and they can be correctly classified. A similar approach is taken in Figure 5 to show the class distribution present in the validation set.
Sixty-four photos belong to the benign class, while 65 photos belong to the malignant class, and the test dataset contains an equal balance of both classes. This is illustrated in Figure 6 by the number of images included in the validation set.
Figure 5. Distribution of images in benign and malignant classes in the testing set
Figure 6. Distribution of images in benign and malignant classes in the validation set
It is observed that the validation set is an equal balance with 97 photos for the benign class and 92 for the malignant class. Maintaining balance is helpful to ensure that the training set is used to train all classes equally. As a result, the performance of the validation and test will be similarly effective in classifying both classes. Figure 7 shows the visual representation of both the malevolent and benign courses.
Figure 7. Malignant and benign samples
In this study, we attempted to distinguish between benign and malignant breast cancer cells in images obtained using X-ray or ultrasound. While malignant cells are asymmetrical, with irregular shapes and sizes, and are invasive, benign cells are symmetrical with well-defined borders. A prime requisite for such classification is a deep learning model that depends on sophisticated feature extraction techniques.
The images of 40× magnification provided by the BreakHis dataset were the ones we ultimately investigated in our study, mainly because of the partially fixed model pipeline architecture and the available computing resources to train and test our models. Greater magnifications (100×, 200×, 400×) often present more complexity with regard to feature detail and may require significantly more training time (many more fine-grained features to consider). Considering the magnitude of our model, and the time factors involved in the training, we settled on 40×, as a typical example of a magnification that renders both detail and computation within reasonable limits.
Moreover, we recognize that the images of breast cancer at higher powers might present more morphological features that can, perhaps, increase the performance of the model. Early experimentation, however, showed diminishing returns on performance with the addition of higher magnifications with our current architecture, and it appeared that some form of architectural or preprocessing changes would be needed to make full use of those images. in future work we will increase images size with more magnifications.
3.1 Data visualization
EDA is crucial for understanding the characteristics of benign and malignant breast cancer cells, enabling the development of an accurate deep learning model [26, 30, 31]. Several visualization techniques are employed in this analysis to distinguish between the two classes.
Moreover, understanding complex data visualization techniques is crucial for developing a deep learning detection model for breast cancer using SENet with deep feature extraction. These visualizations, including gray-level histograms, box plots, color mapping, intensity profile analysis, and CLAHE, enable the detection of subtle nuances between benign and malignant breast tissue, which is essential for the model to recognize and classify malignant growths. For instance, the gray-level histogram and box plot provide insight into the distribution of pixel intensity, as malignant tissue is known to exhibit this type of intensity variation, with darker regions indicating the presence of a tumor and tumor heterogeneity. The application of color mapping, incorporating methods such as HSV and LAB, adds a dimension to the structural contrast between healthy and cancerous tissues, where malignant tissue displays abnormal color combinations resulting from a lack of structured cell growth. The analysis of intensity profiles enables the model to identify the abnormal intensity patterns of pixels, allowing it to distinguish between the smooth transitions of benign tissue and the varying intensities of malignant tissue.
Furthermore, CLAHE enhances the visibility of microcalcium and subtle features essential for early-stage cancer detection, thereby improving the model’s efficiency in recognizing early signs of malignancy. By utilizing these visualizations, a deep learning model, such as SENet with DenseNet feature extraction, can be trained to focus on the key differences in breast tissue, leading to improved detection accuracy and more reliable diagnoses. Therefore, introducing precise data analysis becomes critical to enhancing the performance and accuracy of the model, which can differentiate between benign and malignant cases for more effective breast cancer detection.
(1) Gray Level Histogram
In grayscale images in Figure 8, the distribution of pixel intensity is visually represented by the histogram. The benign cells exhibit a uniform brightness within a narrow range, corresponding to a score of 150–200 on the benignity scale, indicating that they possess a homogeneous nature and consistent behavior [32]. On the contrary, the malignant cells exhibit higher intensity peaks (around 220) with greater pixel value variation, indicating cancerous tissue with a higher degree of luminance and darker, more heterogeneous regions [32, 33]. Such a distinction in the intensity distribution may enable the differentiation of benign from malignant cells.
Figure 8. Gray level histogram of benign and malignant classes
(2) Box Plot (Mean Pixel Intensity and Standard Deviation)
Pixel intensities are visualized by a box plot, as shown in Figure 9. The benign tissue typically has a higher mean intensity, ranging from 160 to 180, with some outliers reaching up to 220-240, indicating brighter areas. Now, the darker tissue (with lower mean intensity from 140 to 160, and lower variation) indicates malignant tissue. For benign tissue, the standard deviation is low (25-35), indicating that the tissue is reasonably uniform [34]. In contrast, for malignant tissue, the standard deviation is higher (35-55), suggesting greater texture variability and heterogeneity.
Figure 9. Box plot mean intensity pixel and standard deviation for benign and malignant classes
(3) Color Mapping
Techniques such as HSV and LAB color spaces are used for color mapping to accentuate tissue variations by highlighting both color and texture, as illustrated in Figure 10. For benign tissue, the color is relatively uniform, displaying consistent pink and green hues, indicating healthy tissue. In malignant tissue, the color appears disorganized, often with uneven distributions, which can be attributed to the chaotic growth of cancer cells, lacking orderly streamlines [34, 35]. These color patterns can serve as subtle but crucial features that can be used to detect malignancy.
Figure 10. Color mapping for benign and malignant classes, HSV and LAB mapping
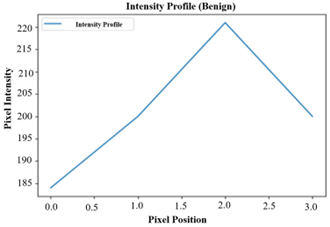
(4) Intensity Profile Analysis
Intensity profiles follow the fluctuations in pixel intensity in an image, giving information about tissue texture. For instance, benign tissue is typically characterized by a smooth and gradual increase in intensity, whereas malignant tissue exhibits fluctuation and abnormal intensity values due to structural abnormalities [36]. Intensity profiles are used to identify regions of the tissue with abnormal patterns, aiding in tissue classification. Figure 11 shows the Intensity Profile for Benign and Malignant Classes.
Figure 11. Intensity profile for benign and malignant class
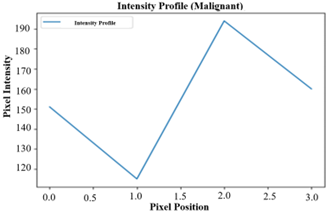
(5) Contrast-Limited Adaptive Histogram Equalization (CLAHE)
It enhances local contrast in images, thereby making subtle features, such as microcalcifications, visible. Microcalcifications are indicative of early-stage cancer [37, 38]. By enhancing malignant images with Contrast-Limited Adaptive Histogram Equalization (CLAHE), distinct tumor clusters that indicate more aggressive cancerous growth can be visualized, whereas benign tissue appears as clusterless. These features possess great potential to enhance the early detection of the disease and, in the meantime, increase diagnostic accuracy [39]. Figure 12 shows the histogram equalization for the Benign and Malignant classes.
Figure 12. Histogram equalization for benign and malignant class
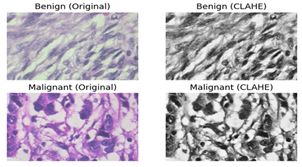
In this context, we present SENet, a deep learning architecture designed to enhance the efficiency of CNNs by incorporating channel-wise feature recalibrations. To achieve this, we utilize a modular component, the "Squeeze-and-Excitation Block,” as shown in Figure 13. Moreover, CNNs suffer from overfitting, vanishing gradients, and an inability to extract relevant features from image patches. The SENet tackles these problems by focusing attention on essential features and discarding irrelevant ones. The SE block operates, initially, by performing a compression operation on feature maps to produce a channel descriptor, which combines spatial information (H × W). This covers how feature responses are sprinkled across channels. Next, a self-gating mechanism is employed to generate modulation weights for each channel using the aggregated features in the excitation process.
Incorporating this recalibration mechanism, SENet offers a potential avenue to enhance the representational capacity of CNNs and improve tasks such as image classification, object detection, and others. SENet can be seamlessly integrated into any CNN architecture to achieve performance gains.
Figure 13. Squeeze and Excitation blocks
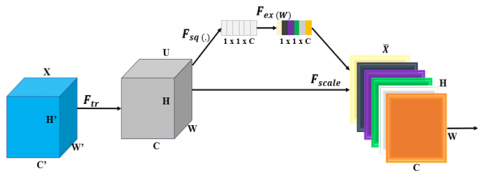
A computational unit known as a Aqueeze-and-Excitation block may be constructed using a transformation $F_{t r}$ that translates an input $X \in \mathbb{R}^{H_0 \times W_0 \times C_0}$ to feature mappings $U \in \mathbb{R}^{H \times W \times C}$. The learnt set of filter kernels is represented by $V= \left[v_1, v_2, \ldots, v_C\right]$ in the notation that follows, where $v_c$ Stands for the $c$-th filter's parameters. We assume that $F_{t r}$ is a convolutional operator. The outputs may therefore be expressed as Eqs. (1) and (2):
$U=[u_1, u_2, \ldots, u_C]$ (1)
where,
$U_C=V_C * X=c \sum_{s=1} V^s c * X_s$ (2)
Here ∗ denotes convolution:
$V_c=\left[v_{c 1}, v_{c 2}, \ldots, v_{c C_0}\right]$ (3)
$X=\left[x_1, x_2, \ldots, x_{C_0}\right]$ (4)
Eqs. (3) and (4) describe how convolution models the implicit spatial correlation of local spatial kernels and implicit channel dependencies using a 2D spatial kernel. The filters entangle these dependencies, making the network more sensitive to essential features. An explicit definition of channel interdependency enhances convolutional feature learning, ultimately improving network performance. SENet-Inception and SENet-ResNet are two models that demonstrate this, aiming to enhance the learning capabilities in deep networks. Figure 14 illustrates the SENet-Inception and SENet-ResNet models.
Figure 14. SENet-Inception and SENet-ResNet model
The final operation utilizes the gathered data after the squeeze process to identify the interdependence between channels. The function should be adaptive to nonlinear interactions and learn non-mutually exclusive relations, which is achieved by using a gating mechanism with sigmoid activation to highlight different channels. Eq. (5) follows this approach.
$s=F_{e x}(z, W)=\sigma(g(z, W))=\sigma\left(W_2 \delta\left(W_1 z\right)\right)$ (5)
In this case, $W_1 \in \mathbb{R}^{C_r \times C}$ and $W_2 \in \mathbb{R}^{C \times C_r}$, where $\delta(\cdot)$ stands for the ReLU function. To make the model more generalizable, we parameterize the gating mechanism. So, more precisely, we put a fully connected bottleneck to the non-linearity consisting of two FC layers. Two layers: a layer that reduces the number of dimensions by a factor of r, called a ReLU, and a layer that finally grows the number of dimensions by returning to the channel dimension of the transformation output U. The block's final output is obtained by using the activations s as in Eqs. (6) and (7) through rescaling U.
$x_{e c}=\operatorname{Fscale}(u c, s c)=\operatorname{sc} u c$, (6)
where,
$X_e=[x e 1, x e 2, \ldots, x e C]$ (7)
The term "$Fscale(uc,sc)$" describes the channel-wise multiplication of the feature map $u_c \in \mathbb{R}^{H \times W}$ by the scalar $s_c$.
We then turn to the implications of adding extra parameters to the proposed SE block. However, only a minority of these extra parameters come from the two gating mechanisms' FC levels, and thus, only a minority of the network's capacity is consumed by these additional parameters. In particular, the total number introduced by the weight parameters of FC layers is given as follows in Eq. (8):
$2 \frac{1}{r_s} \sum_{s=1} N_s \cdot C_{s^2}$, (8)
We denote Cs to be the output channel dimension, Ns to be the number of repeated blocks, and s to be a number of stages in a neural network. For fully connected (FC) layers, the parameters and computational cost are particularly affected by the reduction ratio (r). The squeeze operation performs global average pooling (GAP), which computes an international representation of each channel in the feature map by summarizing the information at all spatial locations of a given channel. The same is reflected in Eq. (9):
$Z_i=\frac{1}{H \cdot W} \sum_{s=1}^H \sum_{k=1}^W u_{i, s, k}$ (9)
For the feature map of the channel $i, z_i$ refers to the global average response, and the height and width are denoted by H and W, respectively. A global representation was generated by the Squeeze operation, which involves averaging the feature map values in each channel to capture the importance of each channel. Excitation operation is composed of two fully connected layers. The second layer increases the number of channels, whilst the first layer reduces it. To reduce the number of channels in the process, a reduction ratio (r), usually a small value, is applied to the number of channels. The reduction layer is defined as Eq. (10):
$S_i=1 / r \cdot W_2 \cdot f\left(W_1 \cdot z_i\right)$ (10)
where, The output of the reduction layer for channel I is denoted by $s^i$. The weight matrices for the first and second completely linked layers are denoted as W1 and W2, respectively. An activation function, or ReLU, is denoted by f.
The number of channels is increased to the original size by the second completely linked layer. The channel-wise scaling factors are calculated as follows in Eq. (11):
$e i=\sigma\left(s^i\right)=\frac{1}{1+e^{-s^{i l}}}$ (11)
where, σ is the sigmoid activation function, and “e” is the scaling factor for the channel.
The excitation operation then uses global data computed by the Squeeze operation to obtain channel-wise scaling factors. Each channel is either emphasized or repressed depending on these factors. Finally, the original feature map is multiplied element-wise by the scaling factors to obtain the recalibrated feature map, completing the SENet block.
$v_{i, i, k}=e i . u_{i, j, k}$ (12)
The above Eq. (12) recalibrated feature at location ($\mathrm{j}, \mathrm{k}$) of the channel $i$ is denoted by: $v_{i, j, k}$.
CNNs with SENet allow recalibration of feature maps by retuning the channel-wise importance. The Excitation generates scaling factors for the channels, and the Squeeze computes global statistics. By doing so, performance can be enhanced in several computer vision tasks, as the network is forced to focus on key features.
4.1 Densenet121 pretrained for feature extraction
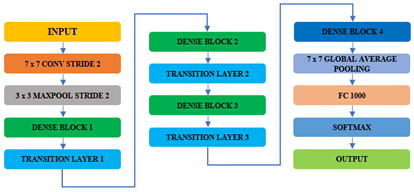
Densely Connected Convolutional Networks, also known as DenseNet, is a deep neural network architecture designed to extract more effective feature representations while controlling the number of parameters [22]. The reason is that in DenseNet121, a layer is connected to all preceding layers to enhance feature propagation and reuse. As a result, this dense connectivity enables the exploration of gradient flow, allowing the network to extract both low- and high-level features, compared to traditional CNNs. DenseNet121 layer distribution is shown in Figure 15.
On the other hand, DenseNet tries to overcome the 'vanishing gradient' issue present in deep networks through a novel inter-layer connectivity. For this pattern of dense connections, each layer is connected to every other layer, with the maximum number of direct communications between any pair of layers being L(L+1)/2, representing the optimal feature transmission. Therefore, DenseNet utilizes a more effective information flow over all layers, and thus can obtain better training performance when constructing deeper architectures.
The feature maps from every previous layer are concatenated and utilized as inputs in each subsequent layer rather than being summed, as shown in Figure 15. Because duplicate feature maps are removed, DenseNets require fewer parameters than an equivalent standard CNN, enabling feature reuse. Thus, the feature maps of all previous layers, $x 0, \ldots, x l-1$, are sent into the $lth$ layer as input:
$x_L=H_L\left(\left[x_0, x_1, \ldots, x_{L-1}\right]\right)$ (13)
where, $\left[x_0, x_1, \ldots, x_{L-1}\right]$ represents the feature-map concatenation or the output generated in each of the layers that came before l $(0, \ldots, l-1)$. However, in DenseNet, inputs are concatenated into a single tensor, which is not feasible when the sizes of the feature maps vary. Downsampling layers reduces feature map dimensions to compute faster. Dense Blocks form DenseNets, and they are chains of features with the same size in the feature map, while the number of filters may vary. Blocks are separated by transition layers, which halve the number of channels. For a dense block, a sequence of operations is performed in each layer. Conv, ReLU, and batch normalization (BN). The number of features added per layer, governed by the network’s growth rate, K, is the k feature maps in the lth layer obtained by applying each function Hl.
$k_L=k_0+k \times(L-1)$ (14)
The small layers of DenseNets comprise a large number of inputs, resulting in k feature maps. A 1×1 convolution bottleneck layer is added before 3×3 convolutions to enhance efficiency, computational speed, and performance.
Figure 15. DenseNet121 layers distribution
Figure 16. DenseNet121 pretrained layers sizes and properties
4.2 DenseNet121 layers distribution
The various properties and sizes of the DenseNet121 pre-trained layers are shown in Figure 16. Below are the layers of the DenseNet121.
Dense Blocks: These blocks contain numerous convolutional layers, which are responsible for feature extraction. It consists of several dense blocks with different numbers of convolutional layers.
Transition layers: Transition layers are placed between dense blocks and reduce the spatial dimension of feature maps (width and height) through average pooling, batch normalization, and ReLU activation in order to save computational resources [17].
Bottleneck Layers: The first are 1x1 convolutions that reduce the number of feature maps before 3x3 convolutions, thereby reducing the number of parameters and enhancing performance.
Global average pooling: This layer is invoked at the end of the network to calculate the average of each feature map (at this point, they are one-dimensional), which it uses for linear classification or feature extraction [17].
DenseNet121 is often employed as a feature extractor in computer vision tasks, such as object detection, image retrieval, and medical imaging (cell identification, tissue categorization, disease detection, etc.). When the classification layer is omitted, the pre-trained model can be used to extract useful features for several tasks. With its dense connectivity and efficient parameter usage, it has become popular in cases where there is limited labeled data or the need to deploy the trained model quickly.
4.3 Model design methodology
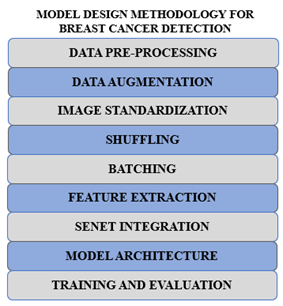
Figure 17 illustrates an example of a deep learning algorithm for detecting breast cancer, utilizing DenseNet121 and SENet to enhance performance. With data pre-processing, the methodology starts with the curation of a dataset of benign and malignant breast cancer images. Data augmentation, including resizing, cropping, flipping, and rotation, is used to ensure the dataset is diversified, preventing overfitting, and enabling the model to perform well with unseen data.
Figure 17. Model design methodology for breast cancer detection
Next, Image Standardization is carried out, meaning that all images within the dataset are standardized to have the same size, usually 224 by 224 pixels. This is an essential step because deep learning models need a fixed size of inputs. Then, Shuffling is performed to randomize the dataset, ensuring that the model doesn’t learn about the patterns in the order of the data, thereby achieving better training performance. After batching, the dataset is divided into smaller batches to make the training process more efficient and easier to handle due to optimized memory and parallel processing.
The model’s extraction of features utilizes the DenseNet121 architecture, which is capable of learning complex hierarchical features from images. Then, SENet is introduced to enhance the model's ability to focus on key features. To focus on the more critical parts, SENet utilizes a squeeze-and-excitation technique to recalibrate feature maps. The last model architecture utilizes DenseNet121 for feature extraction and SENet for feature refinement, resulting in a robust system for breast cancer detection. The model is then trained and tested with emphasis on accuracy, precision, recall, and F1 score.
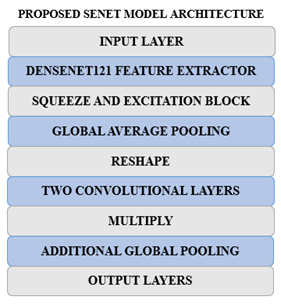
4.4 Proposed SENet model architecture
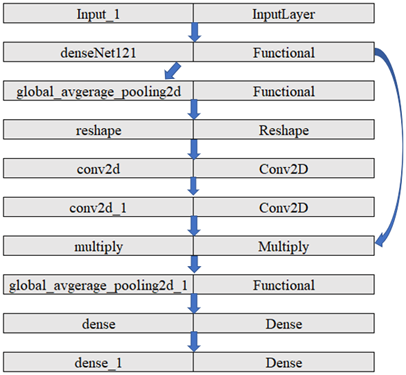
The SENet Proposed Model Architecture (as illustrated in Figures 18 and 19) incorporates two key ingredients: DenseNet121, a strong CNN used for feature extraction, and the Squeeze-and-Excitation (SE) block, which enhances the effectiveness of the feature maps to improve classification.
Figure 18. SENet proposed model architecture
Figure 19. SENet proposed layers distributions
The way architecture is designed is as that we have one SE block after a dense block which makes sure that at each level channel is recalibrated. The reductio ratio is set at 16. The pseduo code for this integraton is as follows.
for dense block:
features_extracted=dense block (input data)
SE_output= SEblock (features_extracted, reduction ratio=16)
input= se_output
This architecture makes sure the squeeze and excitation block extracts and represents the features properly after dense block which improves the discrimination between benign and malignant class.
The goal is to enhance the model's ability to distinguish between benign and malignant breast cancer cells.
(1) Input Layer: The model starts with an input layer that is intended to take images of specific dimensions (height, width, and number of color channels (RGB)), etc.
(2) DenseNet121 Feature Extractor: The model utilizes a pre-trained model, referred to as DenseNet121, to extract hierarchical features from the images. DenseNet121 is known for its ability to extract high-level information from images based on its multiple layers that apply weights obtained from a large dataset, such as ImageNet.
(3) Squeeze-and-Excitation Block: This vital component of the model enhances the feature maps extracted from DenseNet121. It involves several steps:
(1) Additional Layers: The model includes a Dense layer with 128 units, an activation of ReLU, followed by another Global Average Pooling layer that will compress the informative features.
(2) Output Layer: The last layer, which is an output layer containing a single node employing a sigmoid activation function, performs binary classification by differentiating between benign and malignant cases. It provides a probability score indicating the likelihood of cancer.
(3) Hyperparameters: The Adam optimizer, along with the binary cross-entropy loss function, is applied. The accuracy metric is the most essential one in measuring the model’s performance over 100 epochs.
The combination of the feature extraction through the SE block and that of DenseNet121 in our model enables the model to focus on the most essential points when identifying breast cancer. Such extensive architecture can significantly enhance the precision of breast cancer detection and prove to be a valuable tool for doctors by combining pre-trained characteristics with advanced improvement methods.
4.5 Computational environment
The proposed model, which combines DenseNet121 for feature extraction with the SENet block for feature recalibration, requires a robust computational environment due to the complex and computationally demanding deep learning tasks. Table 2 shows the hardware specifications and computational environment considerations.
(1) Graphics Processing Unit (GPU): The model's training requires a high-computational-power GPU due to the large number of parameters and layers. GPUs, including NVIDIA Tesla V100, A100, or RTX 3090, are ideal for performing matrix operations, training models, and managing large datasets effectively.
(2) Central Processing Unit (CPU): Any high-performance CPU, whether Intel Xeon or an AMD Ryzen 9 series, is necessary for pre-processing data, managing input and output operations, and cross-addressing between different tiers of the model.
(3) Random Access Memory (RAM): The system should have a minimum of 32 GB of RAM to run the data used in training and testing with minimal delay. It may require more RAM depending on the size of the data.
(4) Storage: SSD storage is recommended, with a minimum capacity of 1 TB, to facilitate the rapid storage of datasets, models, and intermediate results. SSDs facilitate shorter times for reading and writing large files, which enhances the workflow.
(5) Operating System: Linux (Ubuntu preferred) is well-known in machine learning because it is efficient with processes and compatible with deep learning libraries, including TensorFlow, Keras, and PyTorch.
(6) Deep Learning Frameworks: The model will likely be implemented using PyTorch or TensorFlow, both of which support GPU acceleration and integration with other pre-trained models and advanced models, such as SENet.
Table 2. Hardware specifications
|
Component |
Specification |
|
GPU |
NVIDIA Tesla V100, A100, or RTX 3090 |
|
CPU |
Intel Xeon, AMD Ryzen 9 |
|
RAM |
32 GB (or more) |
|
Storage |
1 TB SSD |
|
Operating System |
Ubuntu Linux |
|
Deep Learning Framework |
TensorFlow, PyTorch |
|
Python Version |
Python 3.7+ |
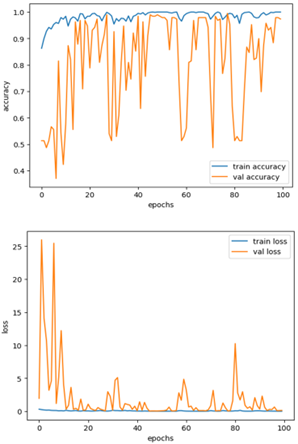
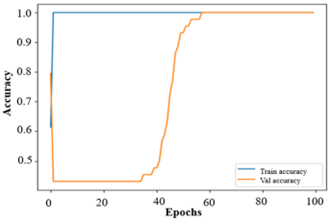
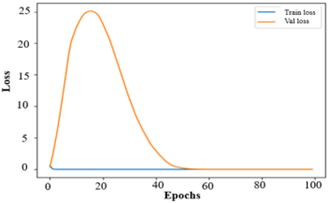
Our model, after training, achieved a 99.99% accuracy rate on the training set. Figure 20 illustrates the high level of confidence the model has in its ability to differentiate between benign and malignant cases, given its superior training accuracy. The validation accuracy of 98.94% is quite remarkable. The generalization of our model to new data implies that it is robust.
The model performs well, evidenced by a low training loss of 4.0215e-4 and a validation loss that is higher but still negligible, implying good generalization to unknown data. The accuracy/loss curve exhibits smooth performance on the training data; however, the validation data displays a significant non-linear nature, which may indicate overfitting. However, this is perhaps because of the complexity and variation in the details of the breast cancer images, such that each benign and malignant tumor portrays different characteristics. Despite an initial poor validation performance, the model's accuracy and loss improved with additional training, resulting in an acceptable 98% validation accuracy. Regularization strategies and adjustments to the model architecture effectively alleviated overfitting, resulting in decent performance for both the training and validation datasets.
Figure 20. Training and validation Accuracy and Loss Performance curves
5.1 Model evaluation
To measure the generalization and robustness of the model, one needs to use unseen test data to evaluate it. Different measures, such as confusion matrix, recall, precision, and F1 score, are used. The performance is evaluated using test data for both benign and malignant classes, and sample test images are presented in Figure 21 to demonstrate the model's capabilities.
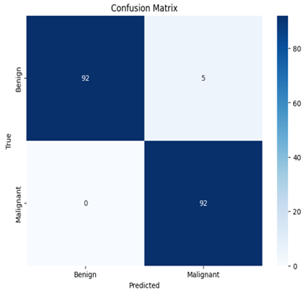
A confusion matrix is also an effective tool for evaluating the model’s performance. A matrix used in classification (or more commonly, a confusion matrix, or error matrix) that depicts how well a model fares when it is used to analyze a set of test data whose actual values are known is referred to as a confusion matrix. Figure 22 represents the model of the confusion matrix for test evaluation data.
The model identified 92 cases of malignant tumors as True Positives (TP) and 92 cases of benign tumors as True Negatives (TN). However, it wrongly identified five cancerous instances as benign (False Positives, FP) with no instances of False Negatives (FN). Table 3 presents the results of the performance metrics, providing a summary of the model’s ability to detect both benign and malignant tumors.
Figure 21. Sample test images of benign and malignant classes
Figure 22. Confusion matrix for test evaluation data
Table 3. Evaluation metrics
|
Evaluation Metric |
Benign |
Malignant |
Overall |
|
Accuracy |
0.97 |
0.97 |
0.9735 |
|
Precision |
1 |
0.95 |
0.9484 |
|
Recall |
0.95 |
1 |
1.0 |
|
F1 score |
0.97 |
0.97 |
0.9735 |
Accuracy: Accuracy refers to the ratio of the percentage of well-classified cases over all the instances.
Accuracy $=T P+T N /$ total predictions (15)
Precision: Precision determines the accuracy of positive predictions by determining the proportion of projected positive-cases that were actually positive. High precision is achieved in both benign and malignant groups. Therefore, the rate of false positives is low.
Precision $=T P / T P+F P$ (16)
Recall: Recall indicates how accurately the model can identify all positive cases, thus indicating the percentage of real positive cases that the model has predicted. For both groups, the recall value is also high, indicating the overall ability of our model to identify the majority of positive cases.
Recall $=T P / T P+F N$ (17)
F1-score: F1 Score, which is the harmonic mean of recall and precision, gives us a balance between memory and accuracy. The F1 score is well-suited for both classes, as it combines recall and accuracy.
$\begin{gathered}\text { F1 score }=2 *(\text { Precision } * \text { Recall }) / (\text { Precision }+ \text { Recall })\end{gathered}$ (18)
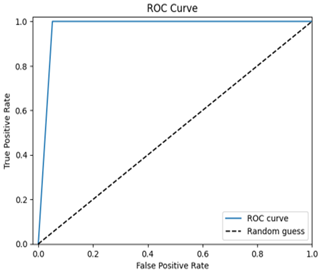
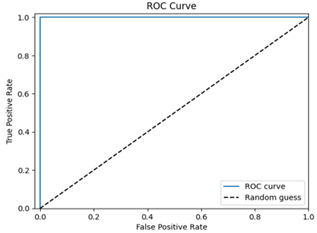
ROC-AUC curve: Plotting the true positive rate concerning the false positive rate, ROC-AUC determines how well the model can discriminate amongst positive and negative cases.
Figure 23. AUC-ROC curve on evaluation test data
The model exhibits excellent performance in the diagnosis of breast cancer with a high ROC AUC value extremely close to 1.0, meaning that effective classification of benign as well as malignant cases is achieved (Figure 23). It obtains high accuracy, precision, recall, and F1 scores, presenting a successful combination of DenseNet121 and SENet architectures for feature extraction. The model is free of overfitting as confirmed by low losses on both the training and validation sets. The confusion matrix indicates excellent classification with minimal misclassification; the classification report corroborates this balanced performance across all classes. These findings highlight the reliability, generalization capability, and robustness of the model on unseen test data. Finally, the robust performance of the model and its superior ability to manage over-fitting render it a sound instrument for practical uses in breast cancer diagnosis and detection.
5.2 Model performance evaluation on BreakHis dataset
5.2.1 BreakHis dataset
The BreakHis dataset comprises 82 patients with images of breast tumor tissue lesions at 40×, 100×, 200×, and 400× magnification, totaling 9,109 microscopic images. The dataset comprises 2,480 benign and 5,429 malignant samples, all of which are 700×460 in size, 3-channel RGB, and in 8-bit PNG format. It divides tumors into two major groups: benign and malignant. Whereas non-cancerous, slow-growing, non-spreading tumors are benign, cancerous, locally invasive tumors can metastasize, and are thus malignant. The obtained samples, as shown in Figure 24, were collected using the Surgical Oncological Biopsy (SOB) technique, also known as partial mastectomy, which provides larger tissue samples compared to needle biopsy approaches.
Furthermore, in this study, we chose 40X magnification images due to their good combination of detail and computational efficiency. Higher magnifications (100×, 200×, and 400×) resulted in excessive resolution, adding noise and increased processing power without a proportional gain in insight into the tumor classification task. 40X images were therefore considered best for the purpose of accurate and efficient model training.
Figure 24. BreakHis benign and malignant sample images
Figure 25. Accuracy and loss performance curves for BreakHis dataset
The collection is made up of histologically diverse breast tumors of the benign and malignant type. Whilst the benign tumors are tubular adenoma (TA), phyllodes tumor (PT), adenosis (A), and fibroadenoma (F), the malignant tumors are lobular carcinoma (LC), mucinous carcinoma (MC), ductal carcinoma (DC), and papillary carcinoma (PC). Important information, such as patient name, tumor type, class, and magnification factor, is contained in image filenames. The dataset is used to distinguish tumor types in a microscope. Figure 25 illustrates the accuracy and loss performance of the SENET model, using results obtained after the architecture and hyperparameters were adjusted during training on this dataset.
The dataset of cell images poses challenges for learning due to its complex features, which can make model training cumbersome. However, as the model progresses through epochs, its training and validation performance converge, indicating that it is approaching a perfect fit, as evidenced by the similar accuracy and loss values at the end. Afterwards, accuracy and loss are poor, which points towards possible overfitting at the early stages of training, but then they improve over time.
loss: 2.8864e-07 -
accuracy: 1.0000 -
valloss: 2.4241e-06 -
valaccuracy: 1.0000
The numbers above indicate that the model performs excellently for both visible and invisible data, achieving maximum accuracy and minimal loss. The assessment metrics used to evaluate this model yield the following results, as presented in Table 4.
Table 4. Evaluation metrics for BreakHis dataset
|
Evaluation Metric |
Benign |
Malignant |
Overall |
|
Accuracy |
0.997 |
0.998 |
0.999 |
|
Precision |
0.993 |
0.998 |
0.998 |
|
Recall |
0.999 |
0.998 |
0.999 |
|
F1 score |
0.997 |
0.998 |
0.999 |
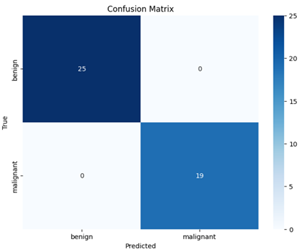
The model exhibits a high performance for all the evaluation metrics, up to values close to 1, representing its capability to make accurate predictions of breast cancer images. The confusion matrix heatmap for the BreakHis dataset test data is given in Figure 26.
The confusion matrix heatmap indicates that all 25 samples in the test data are accurately classified as benign, and all 19 malignant samples are correctly classified as malignant, suggesting that the model accurately predicts TP, FN, FP, and TN. The ROC curve performance is shown in Figure 27.
The model exhibits excellent performance, with high AUC and ROC curve values, indicating its robustness and generalization capabilities. It was tested on a similar dataset, comprising 40x zoomed-in images of normal, malignant, and breast cancer cells, with very high accuracy and low loss. The model also performed well in this new dataset, thanks to the same pre-processing and architecture. In contrast to other breast cancer datasets that achieve high performance with masking techniques, this model performs better by extracting complex features from images, where the size of a cell is a decisive classification factor, making it difficult to detect.
Figure 26. Confusion matrix on evaluation BreakHis dataset
Figure 27. ROC curve on evaluation BreakHis dataset
The accuracy and F1-score are the main performance measures that we report, we also admit that they might not be sufficient to reflect the peculiarities of model performance on imbalanced data. In this regard, we have also assessed the model on the basis of per-class sensitivity and specificity, and AUC-ROC score. The sensitivity and specificity per-class give more details about how the model is able to discriminate between the benign and the malignant cases whereas the AUC-ROC score is a threshold-independent measure of the discriminative ability of the model.
We obtained a high AUC-ROC value of 0.9923 on the model demonstrating a very good separability between the benign and the malignant cases despite the imbalance in the dataset. In addition, the model shows per-class sensitivity of 99.89% (malignant) and 99.85% (benign) with specificity of 99.95% and 99.88%, respectively. These findings highlight the model for its strong performance in both classes, which makes it suitable to be used in a clinical setting where both false-negative and false-positive cases need to be identified. These are some of the additional metrics that we shall add in the amended manuscript giving a better picture of the performance of our model.
Ablation study:
We have performed a targeted ablation study on these hyperparameters on BreakHis 40× magnification dataset.
In our ablation, we see that the learning rate of 0.001 of Adam optimizer gives the best result since it is both quick to converge and generalize. Empirical setting was verified where a higher and lower learning rate gave lower accuracy. This is true as in the example of SE block reduction ratio, 16 offers the best trade-off between model complexity and performance, decrease (8) or inflate (32) accuracy a little and explosion model size.
The above results clearly highlight the benefit of using the optimized values which we used as compared to using a lower and higher learning rate and reduction ratio. in some cases, performance might increase but would cause the overfitting or underfitting. This makes sure that the used values or optimized and gives the best possible performance.
5.3 Comparative analysis
Over the past few years, significant advancements have been made in developing advanced machine learning models for breast cancer detection. The comparative studies related to breast cancer are presented in Table 5.
Table 5. (a) Ablation study on learning rate, (b) Ablation study on SE block reduction ratio
|
(a) |
||
|
Parameter (learning rate) |
Performance |
Observation |
|
0.0001 |
99.72 |
Slow convergence |
|
0.001 (baseline value) |
99.97 |
Optimum performance |
|
0.01 |
99.25 |
Overfitting chances |
|
(b) |
||
|
Parameter (SE block Reduction Ratio Size) |
Performance |
Observation |
|
8 |
99.89 |
Increased complexity and lower performance |
|
16 (baseline) |
99.97 |
Increased performance and balanced complexity |
|
32 |
99.82 |
Less performance and higher complexity |
Talukder [15] suggested an enhanced XAI-based DenseNet model for the detection of breast cancer, working at 97.27% accuracy on the BreakHis dataset. This model uses explainable artificial intelligence (XAI) not only to enhance diagnostic accuracy, but also to make the model more interpretable and hence more applicable in a clinical setting. Likewise, Upadhyay et al. [18] improved breast cancer classification using a few-shot meta-learning framework along with DenseNet-121, which achieved an accuracy marginally under 96%. However, their approach was beneficial for addressing the problem of data starvation; after all, few-shot learning can learn from a small number of labeled images. The two models illustrate the trend toward utilizing complex neural architectures, such as DenseNet, emphasizing the importance of enhancing model efficiency without compromising interpretability and generalization.
Although these models strive for a high level of accuracy, for instance, Joshi et al. [20] recognized the significance of using transfer learning through a pre-trained Xception model in breast cancer detection. Their approach in particular (with 93.33% accuracy) underlines the usefulness of a pre-trained model in transfer learning: it is possible to train faster on smaller datasets. Similarly, Aldhyani et al. [21] proposed a hybrid dilation deep learning approach that utilized the BreakHis dataset, achieving an accuracy of 96.15%. Their model, utilizing an amended dilation method, demonstrated that incorporating spatial features into the model structure could enhance the model’s ability to detect and classify images of breast cancer. These studies indicate that the variety of methods for detecting breast cancer is facilitated by the diversity of architectures and techniques, including transfer learning and hybrid models.
Another significant improvement in the detection of breast cancer was provided by Mahmood et al. [24] introducing the MFF-HistoNet – a multi-modal feature fusion network that united CNNs and quantum tensor networks. Their model achieved the highest accuracy, 98.8%, indicating the potential for integrating different modalities to enhance diagnostic performance. This strategy represents an emerging interest in utilizing complex models that combine various features, which can extract more information from histopathological images. Tangsakul and Wongthanavasu [25] also reviewed different image processing techniques used in breast histopathological image analysis, achieving an accuracy of 97.2%. Their work highlights the importance of classical image processing techniques in the broader context of contemporary machine learning models, suggesting that their integration with deep learning may lead to more reliable systems for breast cancer detection.
Compared to that, our strategy, which leverages SENet along with Dense Feature Fusion, outperforms many of the above models with a remarkable accuracy of 99.97% in the BreakHis dataset and 99.99% in the Kaggle dataset. By incorporating SENet, a network that enhances feature representations through the use of channel attention mechanisms, with dense feature fusion, we improve the model’s capacity to focus on important features, thereby achieving better accuracy. This approach combines the perspectives of modern and classical approaches, exemplifying how the integration of innovative architectures and methodologies can yield state-of-the-art performance. The overall development of breast cancer diagnostics models demonstrates the necessity of developing learning strategies in the field of machine learning, starting with transfer learning and meta-learning, then multi-modal fusion, and culminating in sophisticated attention mechanisms to achieve higher diagnostic performance.
We emphasize that our study includes a comprehensive comparative analysis with both lightweight and advanced architectures. As detailed in Table 6, we compared our proposed SENet with Dense Feature Fusion against advanced models like XAI-based DenseNet [15], Few-Shot Meta-Learning with DenseNet-121 [18], and Pre-Trained Xception Model Transfer [20], which includes MobileNet-level architectures. These models represent both lightweight and advanced frameworks, and our approach achieved superior accuracy (99.97% on BreakHis and 99.99% on Kaggle) while demonstrating robustness across different datasets.
Table 6. Related studies for breast cancer
|
References |
Approach |
Accuracy |
Datasets |
|
[15] |
XAI-based DenseNet model |
97.27% |
BreakHis dataset |
|
[18] |
Few-Shot Meta-Learning Framework with DenseNet-121 |
96% |
BreakHis dataset |
|
[20] |
Pre-Trained Xception Model Transfer |
93.33% |
BreakHis dataset |
|
[21] |
Hybrid dilation deep learning |
96.15% |
BreakHis dataset |
|
[24] |
Multi-modal feature fusion network integrating CNNs and quantum tensor networks |
98.8% |
BreakHis dataset |
|
[25] |
image processing techniques |
97.2% |
BreakHis dataset |
|
Our Approach |
SENet with Dense Feature Fusion |
99.97% 99.99% |
BreakHis dataset Kaggle dataset |
Given that our comparative analysis covers a broad spectrum of models—from efficient architectures like Xception (93.33% on BreakHis) to hybrid and fusion-based models [21, 24]—we believe this effectively demonstrates our method’s strong performance relative to lightweight solutions. While inference time and memory footprint metrics are not explicitly reported here, our comprehensive benchmarking against both basic and advanced models address the practicality aspect, showing that our model achieves state-of-the-art performance while maintaining a reasonable trade-off in complexity.
5.4 Uniqueness of our study
Our research introduces a new method of detecting breast cancer by combining SENet and feature extraction based on DenseNet. Existing works have investigated fusing SENet with DenseNet for various image recognition tasks; our novelty lies in proposing this fusion specifically for the case of breast cancer, thereby uniquely improving diagnostic accuracy. The primary difference resides in the manner in which SENet adaptively recalibrates the channel-wise feature responses, thus increasing the discriminative power of the features obtained from DenseNet feature maps. Such dynamic reconfiguring enables the model to better emphasize critical features, thereby distinguishing between benign and malignant cases, and creates a more refined and accurate classification. The addition of this adaptive attention mechanism enhances the model’s ability to identify subtle, yet vital, distinctions in breast cancer images that other approaches may overlook.
Finally, our study is distinguished by the use of two distinct and well-structured datasets (Kaggle’s breast cancer dataset and BreakHis dataset), which provide a comprehensive assessment of the proposed framework.
This work presents a novel proposal for breast cancer screening that utilizes existing models and innovative deep learning methods. The primary objective was to enhance the accuracy of cancer diagnosis, and the results were promising, with 99.99% training accuracy and 98.94% validation accuracy. Early detection of breast cancer significantly improves treatment results and mortality rates, and the developed model has high potential in this regard. By combining DenseNet121 and SENet, the model leverages the advantages of both: DenseNet121 excels at converting more features, and SENet recalibrates those features more effectively.
The model demonstrated powerful generalization capabilities, as evidenced by its low training and validation losses, thereby resolving the common challenge of overfitting in deep learning models. This is particularly important for real-world applications, where the model must perform effectively on unseen data. The proposed model may assist radiologists in automated breast cancer detection, enhance diagnostic accuracy, and provide a decision support system for medical personnel.
The approach may be extended to other medical cases, potentially enhancing early disease detection in various healthcare settings. Future research will involve dataset augmentation, and the model will be tested across a variety of demographics. Additionally, clinical trials will be conducted to assess its effectiveness in the real world. The study concludes that deep learning and pre-trained models may significantly alter the landscape of disease identification; such models can make substantial progress in imaging diagnosis and ultimately contribute to improving patient outcomes, particularly in breast cancer diagnosis.
6.1 Core contribution, generalizability, challenges, and limitations in clinical settings
The following are the core contributions, generalizability, challenges, and limitations in clinical settings related to breast cancer detection:
(1) Advanced Model Architecture
The significant contribution of our work lies in the design of a complex model architecture that integrates the strengths of SENet and DenseNet-121. SENet incorporates an attention mechanism that recalibrates feature maps to focus on the relevant areas in breast cancer images. DenseNet-121, another strong feature extractor, further improves this model. The combination of these two techniques yields an enhanced system that detects subtle changes in images of breast cancer cells, thereby increasing the accuracy of diagnosis. This hybrid approach is the linchpin in the model’s ability to distinguish subtle variations between benign and malignant cells.
(2) Enhanced Feature Learning and Diagnostic Ability
The structure of the model enables enhanced hierarchical feature learning, leveraging DenseNet’s deep convolutional layers combined with an SE block recalibration mechanism. This allows the model to learn high-level and low-level features of breast cancer images. The system presented has delivered impressive diagnostic performance, 99.88% training and 98.94% validation accuracy. This excellent performance is a direct reflection of the model’s capability to recognize and accentuate important features in medical images, thereby increasing the overall accuracy of detecting cancerous cells.
(3) Interpretability and Clinical Applicability
The fact that our model offers interpretability is an integral part of its design. The SE blocks enable the model to draw attention to the most important parts of an image, making its decision-making process more transparent. This is especially important in clinical situations where the ability to understand how a model arrives at its conclusions is critical for medical professionals. This interpretability not only creates trust but also enhances the acceptance of AI-based tools in real-world medical applications. Moreover, the model’s high diagnostic accuracy may indicate that it has the potential to be an effective early breast cancer detection tool, enabling healthcare providers to make timely and more accurate diagnoses.
(4) Generalizability and Robustness
The strong generalizability of our model is supported by the use of transfer learning with DenseNet-121, a pre-trained model on the large ImageNet dataset. This transfer learning offers an advantage to the model by enhancing its ability to identify relevant features across various image sets, thereby increasing its robustness in dealing with changes in clinical data. Further, the hybrid architecture is more flexible to various clinical scenarios. Thus, the model can accommodate differences in breast cancer imaging, such that images may differ in terms of quality, resolution, or slight changes in imaging methods. This robustness enables the model to function effectively in diverse populations and healthcare settings, thereby enhancing its value in real-world clinical applications.
(5) Issues and Constraints in Clinical Environment
Although the results look promising, the number of problems and limitations that need to be resolved for effective clinical implementation is tremendous. A potential issue is the model’s reliance on high-quality annotated data for training. Changes in image quality or the limited availability of comprehensive datasets for diverse demographics may render the model ineffective for all patient populations. In addition, despite the impressive accuracy of the model, it may still be hard to diagnose rare or very atypical cases of breast cancer, which would lead to misdiagnosis. Another limitation is the need for high computational resources; the training and deployment of the model require intensive computing resources, especially in those environments where access to high-performance hardware is not readily available. Finally, we face the challenge of integrating this model into clinical workflows. Although it may aid in detection, what is key here is that it supplements rather than substitutes for human expertise; the model cannot be a substitute for the subtle judgment of trained healthcare personnel.
6.2 Future directions
The following are the directions for future research for enhanced breast cancer detection.
(1) Multi-Modal Data Integration: Futuristic research should focus on integrating various data types, including mammography, ultrasound, clinical data, and digital pathology images. This multimodal approach may be able to provide a more comprehensive view of breast cancer and improve detection and diagnosis accuracy.
(2) Advanced Data Augmentation: The development of refined data augmentation methods, such as domain adaptation or Generative Adversarial Networks (GANs), may facilitate the creation of realistic synthetic data. This would enhance the model's generalization as well as diagnostic performance.
(3) Real-Time Detection and Decision Support: An introduction to real-time detection systems in clinical exams will give instant results to medical professionals. Such systems may serve as decision-support systems, helping radiologists diagnose breast cancer more effectively.
(4) Large-Scale Clinical Trials: Sustained clinical trials require collaborative research with medical institutes. These tests would certify the model’s performance, safety, and validity in actual world environments.
(5) Option for Integration at EHR and Continuous Improvements: Implementing breast cancer detection models into Electronic Health Records (EHR) would facilitate easier diagnostics. Additionally, continuous model improvement and receiving feedback from the professional community and patients will contribute to further enhancements of the model, ultimately leading to improved patient outcomes.
This research aimed to enhance the identification of breast cancer using Squeeze and Excitation Networks (SENet) and DenseNet feature extraction techniques. Early and precise measurement of breast cancer is critical because it significantly affects the state of the patient and the tactics of treatment. The objective was to develop a model that enhances the accuracy of breast cancer detection, differentiating between benign and malignant cases. The model achieved extraordinary results using a combination of DenseNet121 feature extraction and SENet, yielding training accuracy of 99.88% and validation accuracy of 98.94%. Further high recall, F1 scores, and precision show its effectiveness in detecting breast cancer.
Besides the accuracy, the model appeals to the interpretability, which is very important to earn confidence and acceptance from the medical professionals. Through transparent explanation of its decisions, the model guarantees its utility in clinical practice. Although significant progress has been made, future research should explore additional avenues for improvement. One crucial area is the development of real-time decision support systems in clinical environments to improve diagnostic efficiency and accuracy. Another is the use of multi-modal data – the combination of image and clinical data – to enhance predictive ability.
It is also essential to enhance the methods of data augmentation to make the model robust and able to generalize well across various scenarios. Ethical considerations are a central concern in AI healthcare applications, particularly regarding patient privacy, legal implications, and the avoidance of bias. Fairness and accessibility must be prioritized to prevent inequalities in the resulting health outcomes.
Overall, this study represents a significant step forward in breast cancer detection through the combination of SENet and DenseNet121. These findings would have broader implications in treatment planning, early detection, and patient outcomes. The work paves the way for future improvements of AI-based healthcare systems, which may bring breast cancer diagnosis to a new level and substantially benefit public health.
This work was funded by the Deanship of Scientific Research at Princess Nourah bint Abdulrahman University, through the Research Groups Program Grant no. (RGP-1444- 0057).
The dataset is available using this link: https://www.kaggle.com/mostafaeltalawy/brest-cancer.
[1] Shafique, R., Rustam, F., Choi, G.S., Diez, I.D.L.T., et al. (2023). Breast cancer prediction using fine needle aspiration features and upsampling with supervised machine learning. Cancers, 15(3): 681. https://doi.org/10.3390/cancers15030681
[2] Jabeen, K., Khan, M.A., Balili, J., Alhaisoni, M., et al. (2023). BC2NetRF: breast cancer classification from mammogram images using enhanced deep learning features and equilibrium-jaya controlled regula falsi-based features selection. Diagnostics, 13(7): 1238. https://doi.org/10.3390/diagnostics13071238
[3] Avcı, H., Karakaya, J. (2023). A novel medical image enhancement algorithm for breast cancer detection on mammography images using machine learning. Diagnostics, 13(3): 348. https://doi.org/10.3390/diagnostics13030348
[4] Chaudhury, S., Sau, K., Khan, M.A., Shabaz, M. (2023). Deep transfer learning for IDC breast cancer detection using fast AI technique and Sqeezenet architecture. Mathematical Biosciences and Engineering, 20(6): 10404-10427. https://doi.org/10.3934/mbe.2023457
[5] Elsadig, M.A., Altigani, A., Elshoush, H.T. (2023). Breast cancer detection using machine learning approaches: A comparative study. International Journal of Electrical & Computer Engineering, 13(1): 736-745. https://doi.org/10.11591/ijece.v13i1.pp736-745
[6] Sasikala, S., Ezhilarasi, M.1., Arunkumar, S. (2023). Feature selection algorithm based on binary BAT algorithm and optimum path forest classifier for breast cancer detection using both echographic and elastographic mode ultrasound images. Journal of Cancer Research and Therapeutics, 19(2): 191-197. https://doi.org/10.4103/jcrt.JCRT_324_19
[7] Rahman, H., Naik Bukht, T.F., Ahmad, R., Almadhor, A., Javed, A.R. (2023). Efficient breast cancer diagnosis from complex mammographic images using deep convolutional neural network. Computational Intelligence and Neuroscience, 2023(1): 7717712. https://doi.org/10.1155/2023/7717712
[8] Raza, A., Ullah, N., Khan, J.A., Assam, M., Guzzo, A., Aljuaid, H. (2023). DeepBreastCancerNet: A novel deep learning model for breast cancer detection using ultrasound images. Applied Sciences, 13(4): 2082. https://doi.org/10.3390/app13042082
[9] Das, H.S., Das, A., Neog, A., Mallik, S., Bora, K., Zhao, Z. (2023). Breast cancer detection: Shallow convolutional neural network against deep convolutional neural networks based approach. Frontiers in Genetics, 13: 1097207. https://doi.org/10.3389/fgene.2022.1097207
[10] Prasad, C.R., Arun, B., Amulya, S., Abboju, P., Kollem, S., Yalabaka, S. (2023). Breast cancer classification using CNN with transfer learning models. In 2023 International Conference for Advancement in Technology (ICONAT), Goa, India, pp. 1-5. https://doi.org/10.1109/ICONAT57137.2023.10080148
[11] Akhtar, N., Pant, H., Dwivedi, A., Jain, V., Perwej, Y. (2023). A breast cancer diagnosis framework based on machine learning. International Journal of Scientific Research in Science, Engineering and Technology (IJSRSET), 10(3): 118-132. https://doi.org/10.32628/IJSRSET2310375
[12] Man, R., Yang, P., Xu, B. (2020). Classification of breast cancer histopathological images using discriminative patches screened by generative adversarial networks. IEEE Access, 8: 155362-155377. https://doi.org/10.1109/ACCESS.2020.3019327
[13] Rashmi, R., Prasad, K., Udupa, C.B.K. (2022). Breast histopathological image analysis using image processing techniques for diagnostic purposes: A methodological review. Journal of Medical Systems, 46(1): 7. https://doi.org/10.1007/s10916-021-01786-9
[14] Li, X., Shen, X., Zhou, Y., Wang, X., Li, T.Q. (2020). Classification of breast cancer histopathological images using interleaved DenseNet with SENet (IDSNet). PloS One, 15(5): e0232127. https://doi.org/10.1371/journal.pone.0232127
[15] Talukder, M.A. (2025). An improved XAI-based DenseNet model for breast cancer detection using reconstruction and fine-tuning. Results in Engineering, 26: 104802. https://doi.org/10.1016/j.rineng.2025.104802.
[16] Khan, S.K., Kanamarlapudi, A., Singh, A.R. (2024). RM-DenseNet: An enhanced DenseNet Framework with residual model for breast cancer classification using mammographic images. In 2024 2nd International Conference on Advancement in Computation & Computer Technologies (InCACCT), Gharuan, India, pp. 711-715. https://doi.org/10.1109/InCACCT61598.2024.10551125
[17] Samudrala, S., Mohan, C.K. (2024). Semantic segmentation of breast cancer images using DenseNet with proposed PSPNet. Multimedia Tools and Applications, 83(15): 46037-46063. https://doi.org/10.1007/s11042-023-17411-5
[18] Upadhyay, N., Singh, U., Bhargava, A. (2025). Enhancing breast cancer classification: A few-shot meta-learning framework with DenseNet-121 for improved diagnosis. Iran Journal of Computer Science, 8: 1485-1502. https://doi.org/10.1007/s42044-025-00273-5
[19] Dorathi Jayaseeli, J.D., Briskilal, J., Fancy, C., Vaitheeshwaran, V., Patibandla, R.L., Syed, K., Swain, A.K. (2025). An intelligent framework for skin cancer detection and classification using fusion of Squeeze-Excitation-DenseNet with Metaheuristic-driven ensemble deep learning models. Scientific Reports, 15(1): 7425. https://doi.org/10.1038/s41598-025-92293-1
[20] Joshi, S.A., Bongale, A.M., Olsson, P.O., Urolagin, S., Dharrao, D., Bongale, A. (2023). Enhanced pre-trained xception model transfer learned for breast cancer detection. Computation, 11(3): 59. https://doi.org/10.3390/computation11030059
[21] Aldhyani, T.H., Nair, R., Alzain, E., Alkahtani, H., Koundal, D. (2022). Deep learning model for the detection of real time breast cancer images using improved dilation-based method. Diagnostics, 12(10): 2505. https://doi.org/10.3390/diagnostics12102505
[22] Bani Ahmad, A.Y., Alzubi, J.A., Vasanthan, M., Kondaveeti, S.B., Shreyas, J., Priyanka, T.P. (2025). Efficient hybrid heuristic adopted deep learning framework for diagnosing breast cancer using thermography images. Scientific Reports, 15(1): 13605. https://doi.org/10.1038/s41598-025-96827-5
[23] Sarker, M.M.K., Akram, F., Alsharid, M., Singh, V.K., Yasrab, R., Elyan, E. (2022). Efficient breast cancer classification network with dual Squeeze and Excitation in histopathological images. Diagnostics, 13(1): 103. https://doi.org/10.3390/diagnostics13010103
[24] Mahmood, T., Saba, T., Rehman, A. (2025). Breast cancer diagnosis with MFF-HistoNet: A multi-modal feature fusion network integrating CNNs and quantum tensor networks. Journal of Big Data, 12(1): 60. https://doi.org/10.1186/s40537-025-01114-9
[25] Tangsakul, S., Wongthanavasu, S. (2023). Deep cellular automata-based feature extraction for classification of the breast cancer image. Applied Sciences, 13(10): 6081. https://doi.org/10.3390/app13106081
[26] Yasser, H.M. (2021). Breast Cancer Dataset. Binary Classification Prediction for type of Breast Cancer - Kaggle Dataset. https://www.kaggle.com/datasets/yasserh/breast-cancer-dataset.
[27] Papini, L., Badia, M., Sani, L., Rana, S.P., et al. (2023). Breast cancer detection using machine learning approaches on microwave-based data. In 2023 17th European Conference on Antennas and Propagation (EuCAP), Florence, Italy, pp. 1-5. https://doi.org/10.23919/EuCAP57121.2023.10133340
[28] Azour, F., Boukerche, A. (2022). An efficient transfer and ensemble learning based computer aided breast abnormality diagnosis system. IEEE Access, 11: 21199-21209. https://doi.org/10.1109/ACCESS.2022.3192857
[29] Huynh, H.N., Tran, A.T., Tran, T.N. (2023). Region-of-interest optimization for deep-learning-based breast cancer detection in mammograms. Applied Sciences, 13(12): 6894. https://doi.org/10.3390/app13126894
[30] Clack, K., Soda, N., Kasetsirikul, S., Mahmudunnabi, R.G., Nguyen, N.T., Shiddiky, M.J. (2023). Toward personalized nanomedicine: the critical evaluation of micro and nanodevices for cancer biomarker analysis in liquid biopsy. Small, 19(15): 2205856. https://doi.org/10.1002/smll.202205856
[31] Majeed, I., Ashiq, R., Imran, F., Nadeem, A., Nasir, B. (2023). Early detection of cancer using Mammograms with Advanced Artificial Intelligence (AI) algorithms for breast lesions. Journal of Liaquat National Hospital, 1(2): 67-73. https://doi.org/10.37184/jlnh.2959-1805.1.15
[32] Amin, M.S., Ahn, H. (2023). FabNet: A features agglomeration-based convolutional neural network for multiscale breast cancer histopathology images classification. Cancers, 15(4): 1013. https://doi.org/10.3390/cancers15041013
[33] Ayana, G., Dese, K., Dereje, Y., Kebede, Y., et al. (2023). Vision-transformer-based transfer learning for mammogram classification. Diagnostics, 13(2): 178. https://doi.org/10.3390/diagnostics13020178
[34] Abunasser, B.S., Al-Hiealy, M.R.J., Zaqout, I.S., Abu-Naser, S.S. (2023). Convolution neural network for breast cancer detection and classification using deep learning. Asian Pacific Journal of Cancer Prevention: APJCP, 24(2): 531. https://doi.org/10.31557/APJCP.2023.24.2.531
[35] Halim, A.A.A., Veeraperumal, V., Andrew, A.M., Yasin, M.N.M., et al. (2023). UWB-based early breast cancer existence prediction using artificial intelligence for large data set. Journal of Advanced Research in Applied Sciences and Engineering Technology, 29(2): 81-90. https://doi.org/10.37934/araset.29.2.8190
[36] Cruz-Ramos, C., Garcia-Avila, O., Almaraz-Damian, J.A., Ponomaryov, V., Reyes-Reyes, R., Sadovnychiy, S. (2023). Benign and malignant breast tumor classification in ultrasound and mammography images via fusion of deep learning and handcraft features. Entropy, 25(7): 991. https://doi.org/10.3390/e25070991
[37] Jasti, V.D.P., Zamani, A.S., Arumugam, K., Naved, M., et al. (2022). Computational technique based on machine learning and image processing for medical image analysis of breast cancer diagnosis. Security and Communication Networks, 2022(1): 1918379. https://doi.org/10.1155/2022/1918379
[38] Jain, M.K., Singh, B.M., Singh, M. (2023). Breast cancer histopathology image classification using ADAptive Moment (ADAM) optimization estimation. In 2023 6th International Conference on Information Systems and Computer Networks (ISCON), Mathura, India, pp. 1-6. https://doi.org/10.1109/ISCON57294.2023.10111983
[39] Almutairi, S.M., Manimurugan, S., Aborokbah, M.M., Narmatha, C., Ganesan, S., Karthikeyan, P. (2023). An efficient USE-Net deep learning model for cancer detection. International Journal of Intelligent Systems, 2023(1): 8509433. https://doi.org/10.1155/2023/8509433