Kumar Prakash*![]() | Viswanathan Chandrasekaran
| Viswanathan Chandrasekaran![]() | Shanmugam Anitha
| Shanmugam Anitha![]()
© 2025 The authors. This article is published by IIETA and is licensed under the CC BY 4.0 license (http://creativecommons.org/licenses/by/4.0/).
OPEN ACCESS
Pap smears, also known as pap tests, can identify abnormal cells early that develop cervical cancer, allowing for timely intervention and treatment. Even though the incidence rate is reduced in this modern era, it poses a significant risk to human life and should be taken very seriously. An accurate and rapid system for classifying pap smear images is necessary to provide appropriate therapy. Deep Neural Networks (DNNs) have garnered much interest in recent years and have shown outstanding categorization results in computer vision. An efficient Pap Smear Image Classification (PSIC) system with Efficient Weight Regularization (EWR) in DNN is presented in this study. The main problem with neural networks is that they have large weights that overfit the training data. To overcome this difficulty, the EWR approach is employed to penalize the large weights using grid search. The proposed non-invasive support system detects pap-smear images with cancerous cells. The HERLEV dataset comprises 675 digitized abnormal images, and 242 normal images are utilized for the classification task. When using the capabilities of the EWR-DNN combination, the proposed PSIC system can work at its absolute best. The concepts described in this study also provide a possible path to increase the categorization accuracy of all medical diagnoses. Results show that the PSIC system, which employs EWR approach achieves 98.9% classification accuracy, 99.3% specificity and 98.5% sensitivity using a regularization parameter of 10-3. The comparison study with other deep learning models such as VGG, ResNet, AlexNet and GoogleNet also shows the superior performance of the PSIC system.
deep learning, pap-smear images, cervical cancer, weight regularization, computer aided diagnosis
Cervical cancer is a serious health concern affecting millions of women worldwide. The Human Papilloma Virus (HPV) is the primary cause of this condition, which, if left untreated, may result in considerable morbidity and death [1]. Different techniques, such as Pap Smear (Pap test), colposcopy, endocervical curettage, biopsy, HPV testing, imaging tests (MRI, CT scan, or ultrasound), liquid-based cytology, and molecular testing are available to detect specific genetic or molecular abnormalities associated with cervical cancer. The early identification, diagnosis, and management of cervical cancer are all significantly aided by these diagnostic approaches, which eventually lead to improved patient outcomes via prompt intervention and treatment.
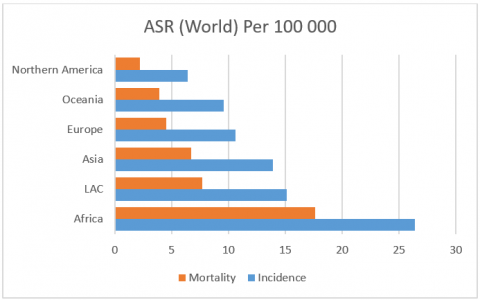
In the medical domain, incorporating image-based reasoning and perception requires radiologists to acquire considerable knowledge. To minimize interpretation errors, it is essential to use a well-designed Computer Aided Diagnosis (CAD) system, since radiologists have distinct analytical abilities. CAD systems can potentially raise therapeutic efficacy while lowering treatment costs and morbidity. The significant improvements that have been made in the process of acquiring medical images have resulted in the availability of more public databases. Because of this, there is renewed optimism that the researchers will be able to develop a pattern recognition system that is more accurate when identifying a variety of illnesses. The outcomes of the GLOBOCAN 2022 survey [1] about cervical cancer are shown in Figure 1.
Figure 1. Cervical cancer statistics- 2022
Figure 1 reveals that Africa has the largest incidence and death rate, as well as more than fifty percent of all cases. In comparison to other kinds of cancer, cervical cancer is notoriously difficult to cure since it is intimately connected to a great number of fundamental bodily processes.
Despite significant progress in automated cervical cancer detection using pap smear images, existing methods often struggle with challenges such as high false-positive rates, poor generalization, difficulty in handling variations in cell shapes, and the need for extensive preprocessing. The proposed method addresses these limitations by utilizing a novel deep learning architecture that incorporates both multi-scale feature extraction and EWR approach, resulting in improved classification accuracy.
Compared to conventional DNN, the proposed PSIC system gives more accurate results, demonstrating its effectiveness in providing more reliable diagnoses.
The organization of this paper is as follows: In Section 2, existing methods for diagnosing cervical cancer using more contemporary methods that include deep learning are discussed. Section 3 presents an efficient PSIC system with EWR approach in deep learning. Section 4 evaluates the developed system’s performances on a publicly available pap-smear image database. The last section summarizes the work, findings and suggestions for further research.
The interpretation of pap-smear images, particularly the use of image processing methods, is experiencing rapid growth. This surge in interest has led to the proposal of several CAD systems, which serve as potential solutions for the automatic classification of pap-smear images. Deep learning models for cervical cancer diagnosis are discussed by Tan et al. [2]. Thirteen pre-trained deep Convolutional Neural Network (CNN) models are evaluated and compared extensively. Among the models, the top-performing model is DenseNet-201, which stands out for its exceptional accuracy and performance. A cervical image classification model suggested by Li et al. [3] is based on multilayer hidden conditional random fields. It does not depend on segmentation techniques or unique features. To identify cervical cancer stages into well-differentiated or moderately differentiated, a weakly supervised learning approach is employed.
Zhang et al. [4] describe a strategy for direct deep feature-based classification of cervical cells using CNN, which bypasses the need for segmentation. CNN is first trained on a collection of real-world images. An adaptively re-sampled image patch set with the nuclei roughly in the center is used to fine-tune it on a cervical cell dataset. During testing, a group of comparable image patches are averaged to get their prediction scores. The image data are first pre-processed using ROI extraction and data augmentation [5]. Using pre-trained densely connected neural networks, a CAD approach is employed to categorize cervical pre-cancerous automatically. The extracted ROIs with data augmentation are used to identify higher-level abnormalities in cervical images.
Li et al. [6] developed a faster RCNN-FPN architecture for abnormal cervical cell classification from cytological images. This architecture includes a global contextual aware module alongside the Region Proposal Network (RPN) to enhance spatial correlation. Zhao et al. [7] describe a computer-assisted analytical method for detecting potentially harmful cells in whole slide cervical cell images. Unlike traditional algorithms that rely on segmentation, this method divides the images into blocks of a given size. An ensemble-based model trained on the pap-stained whole slide and single-cell images is described by Manna et al. [8]. The model comprises DenseNet-169, Xception, and Inception v3 models.
Bora et al. [9] study a cervical cancer categorization system that relies on characteristics such as color and texture. It follows the well-established Bethesda classification system, creating two level categories for normal and abnormal cervical dysplasia. Zhang and Liu [10] describe a feature screening method that utilizes the decision boundary of support vector machines. Unlike classic screening techniques such as augmented variance ratio and information gain, it eliminates the “independence” assumption while maintaining high computational efficiency. A bottom-up approach is employed to automatically detect cervical cancer in thin pap smear images. Cervical cell images are classified using a Levenberg-Marquardt MLP neural network [11]. Image preprocessing and the feedforward MLP neural network comprise the system as a semiautomated diagnostic method. Sato et al. [12] examine the viability of deep learning for colposcopy image categorization.
Alquran et al. [13] discuss a combination of feature fusion with Shuffle Net structural characteristics. The extracted attributes are given as input into five separate machine learning algorithms. Win et al. [14] investigate pap-smear images using image processing techniques for cervical cancer classification. A shape-based iterative technique finds the nuclei, and a marker-control watershed method separates the cytoplasm in cell segmentation. Dong et al. [15] study a CNN-based categorization that combines Inception v3 and artificial features to increase classification accuracy and overcome the limitations of existing classification methods.
Zhao et al. [16] add multi-residual blocks to the encoder framework for cervical cancer classification. In the feed forward network, the normalization layer standardizes data for non-linear processing (ReLU function). SMOTE-Tomek Links balances the source dataset by modifying image weights and samples. Transfer learning and Tokens-to-Token Vision Transformers improve categorization accuracy. Machine learning and deep learning-based CAD systems are intensively studied to categorize cervical pap cells [17]. Shi et al. [18] discuss a hybrid deep feature fusion approach, where CNNs use deep features to classify cervical cells, whereas traditional approaches rely on handcrafted features.
The human brain has a network of neural circuits that allows it to process information quickly and effectively. These neural circuits include a very large number of neurons. Compared with programmed computing, computation in the human brain differs in two key respects: i) the computation is distributed and parallel; ii) learning replaces a priori software design. Artificial neural networks (ANNs) are a biologically inspired computer paradigm. Its emergence was driven by the development of contemporary elemental based technology and the need to handle problems quicker and more economically. Since the 1950s, neural computing has mostly been driven by the development of threshold logic, in contrast to the traditional development of AND, OR, and NOT.
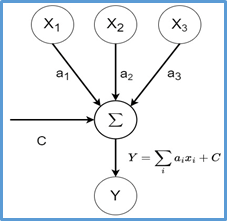
ANNs learn by changing their internal representation in response to external inputs so they can complete a task. Learning an ANN requires slowly altering the weights. The network repeatedly shows training instances, like how individuals learn through experience. Then the ANN may generalize about unknown instances. Figure 2 shows the neural network representation.
Figure 2. Neural network representation
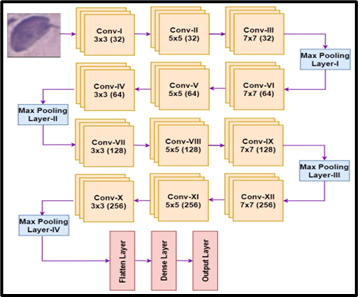
The neural network may represent the linear regression. In this case, each input is multiplied by an arbitrary weight, and then the products of that multiplication are added to a constant value, C, to produce the output. The hidden node is where the summing up takes place. Because the constant C and weights are randomly selected to begin with, the output does not typically correspond to the experimental data. As a result, the weights are trained by undergoing systematic adjustments until a description of the output obtained as a function of the inputs that provides the best possible fit. Though many networks have been built recently, backpropagation networks are utilized most often [19, 20]. In Backpropagation networks, the data are only sent into the network in one way, without any feedback; this means that the neurons in the same layer do not have any connections, and all the interconnections are unidirectional. Figure 3 shows the PSIC system architecture for pap-smear image classification.
Figure 3. Overall architecture of the PSIC system
3.1 Weight regularization
ANNs are designed to develop a set of weights that provide the most accurate mapping of inputs to outputs. A network with large network weights may indicate an unstable network, one in which even little shifts in the input might result in very different values for the output. This may indicate that the network has overfitted the training dataset, and thus has poor performance when generating predictions based on fresh data. One potential solution to address overfitting is to update the learning algorithm to direct the network to keep each weight at a low value. Weight regularization is a technique used to improve the generalization of a model and reduce overfitting by decreasing the instances of the dataset utilized for training.
A stochastic gradient descent approach is used to train the model’s weights. Increasing the duration of network training leads to the weights being increasingly tailored to the training data, resulting in overfitting. The size of the weights will increase so that they can adequately handle the particulars of the instances presented in the training data. The presence of large weights makes the network unstable. Even though the weights will be tailored to the training dataset, a little deviation from the predicted inputs or any statistical noise might result in significant shifts in the output. Thus, the ANN model has a wide variance and a modest bias. This means that the model is sensitive to the cases, as well as the statistical noise, in the dataset that it was trained on. A model with substantial weights is more difficult to understand than one with more manageable weights.
3.2 EWR approach
Two aspects must be considered when penalizing the model based on the magnitude of the weights. The first step is to determine the appropriate magnitude of the weights, and the second step is to determine how much consideration the optimization procedure needs to give to the penalty.
3.2.1 Computation of weight size
Because the weights of a neural network are actual numbers and hence may take on either a positive or negative value, it is not sufficient to add all the weights together. Calculating the size of the weights may be done using one of two primary methods: L1 norm and L2 norm. L1 strongly recommends that weights be set to 0.0 wherever practicable leading to fewer weights. L2 provides more subtlety by simultaneously punishing higher weights more harshly and resulting in fewer sparse weights because of this change. Ridge regression is often used to utilize L2 in linear and logistic regression.
Based on linear algebra, the weights might be regarded as a vector, and the linear algebra term for the magnitude of a vector is termed its norm. Because of this, the act of punishing the model depending on the magnitude of the weights is also known as a weight or parameter norm penalty. When computing the magnitude of the weights to be used as the penalty, including both the L1 and L2 methods is feasible. This is analogous to how the elastic net approach for linear and logistic regression makes advantage of both penalties available. The L2 method, also known as weight decay in more technical contexts, is most frequently used in neural networks. In statistics, this phenomenon is referred to as shrinkage, a term that prompts one to consider that the penalty influences the model weights as part of the learning process.
3.2.2 Impact of the penalty
During the training of the network, the loss objective function will have the determined size of the weights added to it. They may be weighted using a new hyperparameter named alpha or lambda (occasionally), rather than explicitly adding each weight to the penalty. This will save time. This determines how much focus the learning process should put on the consequence of failing to meet the requirement or the amount by which the model is penalized by the magnitude of the weights. The value of the alpha hyperparameter may range anywhere from 0.0 (indicating no penalty) to 1.0. (Full penalty). This hyperparameter determines the bias in the model, with values ranging from 0.0, which represents minimal bias (large variance), to 1.0, which represents severe bias (low variance).
If the penalty is too high, the model will fail to account for all the weights and will not be accurate enough to solve the issue. The model can inappropriately fit the training data if the penalty is insufficient. Instead of calculating the vector norm of the weights for the whole network, it is more common practice to do it for each layer. This provides additional freedom in the choice of the applied regularization type (for example, L1 for inputs and L2 elsewhere) and flexibility in the alpha value, even if it is customary practice to apply the same alpha value on each layer by default.
3.3 System parameters
During training, the cross-entropy loss at each spatial point is added together to get the total loss, and the weights are minimized by using stochastic gradient descent with the EWR approach. The cross-entropy loss is as follows:
$\operatorname{Loss}=-\sum_{j=1}^c t_j \log \left(p_j\right)$ (1)
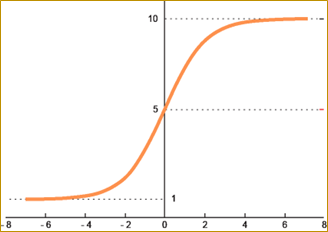
where, the probability for the jth class is pj and truth label is tj. The proposed PSIC system uses batch normalization to normalize the inputs and speed the learning process to improve categorization. The batch size that is used in the proposed system is 32. The hidden layers use the rectified linear activation function. Other activation functions, including softmax, sigmoid, and linear, may be utilized at the output layer. The sigmoid function has been chosen for this study since it uses probability distributions when classifying the data. The definition of softmax function for N output layer with the output value of ith layer (Xi) is,
$\operatorname{soft} \max (\mathrm{i})=\frac{\mathrm{e}^{\mathrm{x}_{\mathrm{i}}}}{\sum_{j=1}^{\mathrm{N}} \mathrm{e}^{\mathrm{x}_{\mathrm{j}}}}$ (2)
The softmax function is shown in Figure 4.
Figure 4. Softmax function
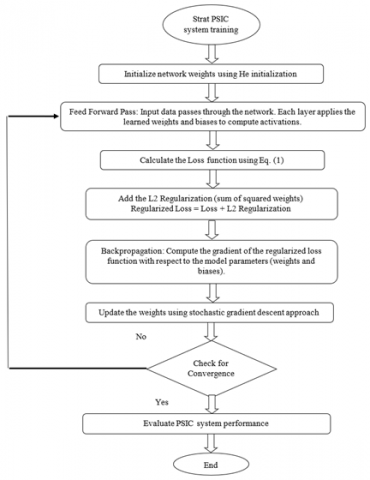
Figure 5 summarizes the steps of the proposed PSIC system with weight regularization.
Figure 5. Workflow of the proposed PSIC system with weight regularization
4.1 Herlev database images
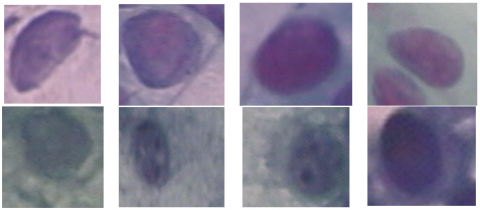
The HERLEV dataset is an invaluable resource for those working in cytology and medical image processing [21], which includes images of single cells from the cervical region. There are 675 digitized abnormal images, and 242 normal images are included in this collection. They are typically obtained via pap smear examinations, and the dataset has been annotated and tagged to identify various cellular properties. These qualities include cell shape, nucleus features, and the presence of abnormalities such as precancerous or cancerous cells respectively. Frequently, researchers make use of this dataset for activities such as cell categorization and segmentation. Cell categorization refers to categorize cervical cells into many groups based on their visual characteristics. These categories include normal, abnormal, and possibly malignant cells. Segmentation is the process of isolating and analyzing the properties of individual cells within an image based on their characteristics, such as the size and shape of the nucleus. The process of constructing models that can automatically identify abnormalities inside cervical cells, which may be of assistance in the early diagnosis and treatment of cervical cancer, was referred to as abnormality detection. Pap smear images taken from the HERLEV database are shown in Figure 6.
Figure 6. Pap smear images: Normal (top row) and abnormal (bottom row)
Class imbalance occurs when the distribution of classes in a dataset (number of images in each class) is not equal in a classification issue. The instances of the dominant class may greatly outnumber the instances of the minority class. Machine learning algorithms often struggle with class imbalance since they favor the dominant class, resulting in worse performance for the minority class. Data augmentation methods [22] may artificially increase the number of samples in the minority class. This can be achieved by performing rotation, scaling, or introducing noises. In this work, the samples of normal images increased from 242 to 675 to avoid the class imbalance problem by rotating the original images.
The proposed system uses random split approach to split the dataset into training and testing. In deep learning, 60-20-20 Split (60% training, 20% validation, 20% testing) is commonly used when a decent amount of data is available. It balances the need for sufficient training data while retaining enough validation and test data for reliable evaluation. The proposed PSIC system uses the same split ratio for training and testing.
4.2 Evaluation criteria
Classification accuracy is the proposed system's capacity to label all pap-smear images. Sensitivity and specificity quantify the system’s capacity to distinguish abnormal cervical cells from normal cells. To evaluate the effectiveness of the proposed PSIC system, it is necessary to calculate four crucial parameters using the results produced by the system. Using these values, a confusion matrix [23] like the one shown in Table 1 is constructed.
Table 1. Confusion matrix [23]
|
Predicted Class |
Actual Class |
|
|
Abnormal |
Normal |
|
|
Abnormal |
TP |
FP |
|
Normal |
FN |
TN |
In Table 1, the accurate classification of positive samples is represented by 'True Positive', and the accurate classification of negative samples is represented by 'True Negative'. Also, the incorrect classification of positive samples is represented by 'False Negative', and the incorrect classification of negative samples is represented by 'False Positive'. The evaluation indices for the proposed system are given below: The measure, Sensitivity (SN) shows the system's capability of distinguishing positive samples from negative ones. It is defined by:
$S N=\frac{T P}{T P+F N}$ (3)
The measure, Specificity (SP) shows the system's capability of distinguishing negative samples from positive ones. It is defined by:
$S P=\frac{T N}{T N+F P}$ (4)
The measure, Accuracy (ACC) shows the system's capacity to categorize MRI scans. It is defined by:
$A C C=\frac{T P+T N}{T P+F N+T N+F P}$ (5)
4.3 Experimental results and analysis
In the EWR approach, the best parameter is identified using the grid search method. When doing a grid search, searching through certain orders of magnitude between 0.0 and 0.1 is the best practice. Once a level has been identified, it is best practice to conduct a grid search on that level. By identifying the values to test, looping over each one, and documenting the performance of both the train and the test, grid search is executed across the orders of magnitude. Table 2 shows the performance of the EWR-DNN system for the first stage classification, and random split (60:20:20) is used to select images to train and test the PSIC system.
Table 2. Performance of the PSIC system for cervical cancer classification (normal/abnormal)
|
S. No. |
EWR parameter |
Confusion Matrix Parameters |
Performance Measures |
|||||
|
TP |
FN |
TN |
FP |
SN |
SP |
ACC |
||
|
1 |
10-1 |
116 |
19 |
117 |
18 |
85.9 |
86.7 |
86.3 |
|
2 |
10-2 |
120 |
15 |
121 |
14 |
88.9 |
89.6 |
89.3 |
|
3 |
10-3 |
133 |
2 |
134 |
1 |
98.5 |
99.3 |
98.9 |
|
4 |
10-4 |
131 |
4 |
129 |
6 |
97.0 |
95.6 |
96.3 |
|
5 |
10-5 |
130 |
5 |
129 |
6 |
96.3 |
95.6 |
95.9 |
|
6 |
10-6 |
130 |
5 |
129 |
6 |
96.3 |
95.6 |
95.9 |
It can be seen from Table 2 that the EWR-DNN system can achieve an accuracy of ~99% (EWR of 0.001) for the first-stage classification when it comes to classifying pap-smear images as normal or abnormal. It also provides a specificity of 99.3% by properly categorizing all normal images and a sensitivity of 98.5% by accurately diagnosing all abnormal images. Figure 7 shows the accuracy of the PSIC system obtained for different EWR parameters.
Figure 7. Accuracy of the PSIC system with different EWR parameters
Table 3 shows the PSIC system’s performance with state-of-the-art CNN models. Different deep CNN models, such as VGG architectures [24], AlexNet [25], ResNet [26] with 18 and 50 layers and GoogleNet [27] are used to compare performance with the PSIC system that uses EWR approach in DNN.
Table 3. Comparative analysis between the PSIC system and deep learning architectures
|
S. No. |
Models |
Confusion Matrix Parameters |
Performance Measures |
|||||
|
TP |
FN |
TN |
FP |
SN |
SP |
ACC |
||
|
1 |
VGG-16 |
119 |
16 |
120 |
15 |
88.1 |
88.9 |
88.5 |
|
2 |
VGG-19 |
121 |
14 |
123 |
12 |
89.6 |
91.1 |
90.4 |
|
3 |
AlexNet |
125 |
10 |
125 |
10 |
92.6 |
92.6 |
92.6 |
|
4 |
ResNet-18 |
125 |
10 |
126 |
9 |
92.6 |
93.3 |
93.0 |
|
5 |
ResNet-50 |
127 |
8 |
127 |
8 |
94.1 |
94.1 |
94.1 |
|
6 |
GoogleNet |
129 |
6 |
130 |
5 |
95.6 |
96.3 |
95.9 |
|
7 |
PSIC without EWR approach |
130 |
5 |
130 |
5 |
96.3 |
96.3 |
96.3 |
|
8 |
EWR-DNN |
133 |
2 |
134 |
1 |
98.5 |
99.3 |
98.9 |
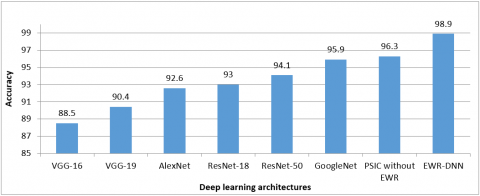
The comparison analysis of cervical cancer classification models in Table 3 reveals a spectrum of performance across various measures. VGG-19 emerges as a standout performer, exhibiting superior sensitivity, specificity, and accuracy compared to its VGG-16 counterpart. AlexNet demonstrates exceptional sensitivity, indicating its proficiency in detecting true positive cases, while ResNet-50 slightly outperforms ResNet-18, showcasing its robustness in classification tasks. GoogleNet demonstrates exceptional performance by using its cutting-edge architecture to extract features efficiently. PSIC system, when not using EWR and EWR-DNN, has high specificity. However, the latter is especially remarkable for its capability to reduce the occurrence of false positives. Each model has distinct advantages, addressing various needs in the detection of cervical cancer and emphasizing the need to select a model customized to the work’s goal. In summary, this research highlights various methods that may be used to classify cervical cancer. These methods have the potential to be combined to improve the accuracy of diagnosis and the patient outcomes. Figure 8 shows the PSIC system’s accuracy with other deep learning architectures.
Figure 8. Performance comparison of the PSIC system with different deep learning architectures
It can be seen from Figure 7 that the VGG architectures are the least performer for PSIC. The deep architectural design of VGG may lead to a higher risk of overfitting without careful regularization. AlexNet uses fewer filters than VGG and introduced dropout in the fully connected layers to reduce overfitting. It improves generalization performance of AlexNet compared to VGG architectures. Though AlexNet reduces the overfitting, it struggles with vanishing gradients problem. The residual connections in ResNet architectures allow gradients to flow more easily during backpropagation, preventing the vanishing gradient problem. Deeper networks without overfitting can learn more complex representations, which allows ResNet to outperform AlexNet. The inception module in GoogleNet captures features of varying sizes, allowing for better multi-scale feature extraction in a single layer. The proposed PSIC system provides better results due to its architectural design with weight sharing to prevent overfitting and multi-scale feature extraction by varying filter size.
The proposed PSIC system has the potential to revolutionize clinical workflows for cervical cancer diagnosis in numerous ways. By automating the diagnostic process, the PSIC system could significantly reduce the time required for pathologists to make a diagnosis. This could lead to earlier detection and treatment of cervical cancer. Moreover, the high accuracy demonstrated by the proposed system could assist clinicians in reducing misdiagnosis or human error, thereby providing more reliable results. Importantly, the implementation of the PSIC system in regions with limited access to trained medical professionals could be a game-changer, improving cervical cancer screening and potentially saving countless lives.
The availability of pap smear images for research is often severely limited due to several challenges. These images, which contain sensitive patient information, are subject to strict regulations regarding privacy and data protection. The difficulty in sharing these images for research purposes without patient consent is a significant hurdle. These challenges can have a profound impact on the development and validation of machine learning models for cervical cancer diagnosis. Furthermore, pap smear image datasets often suffer from class imbalance, with a significantly higher number of normal (healthy) images compared to abnormal (cancerous) ones. The proposed PSIC system used data augmentation to avoid class imbalance problem. In the future, cost-sensitive learning can be utilized in which different weights are assigned to classes during training. Minority class instances are given higher weights, while majority class instances are given lower weights. A larger and more diverse dataset can be used to improve the robustness and generalizability of the model. The proposed system should be refined to handle lower-quality images and conditions that may occur in actual clinical settings.
This study proposes a scientific technique for classifying different types of pap smear cells. The pap-smear images may reveal either low-level or high-level textures, either caused by disease processes or are impacted by them. The quantification of these different textures has the potential to provide helpful indicators of disease states; the creation of such markers is the focus of this work. Neural networks overfit training data due to larger weights. The EWR approach penalizes larger weights utilizing grid search to address this problem. The non-invasive diagnosis method has two stages. First, establish whether the image is abnormal and then categorize it into different abnormal cell types. The HERLEV database is used for performance evaluation. The findings lead to the conclusion that the assessment of global texture using pap-smear images might help the diagnosis of cervical cancer in its early stages. In addition, the proposed PSIC system presented in this work for detecting changes in tissue texture in pap-smear images has the potential to diagnose and treat various abnormalities.
[1] Bray, F., Laversanne, M., Sung, H., Ferlay, J., Siegel, R.L., Soerjomataram, I., Jemal, A. (2024). Global cancer statistics 2022: GLOBOCAN estimates of incidence and mortality worldwide for 36 cancers in 185 countries. CA: A Cancer Journal for Clinicians, 74(3): 229-263. https://doi.org/10.3322/caac.21834
[2] Tan, S.L., Selvachandran, G., Ding, W., Paramesran, R., Kotecha, K. (2024). Cervical cancer classification from pap smear images using deep convolutional neural network models. Interdisciplinary Sciences: Computational Life Sciences, 16(1): 16-38. https://doi.org/10.1007/s12539-023-00589-5
[3] Li, C., Chen, H., Zhang, L., Xu, N., Xue, D., Hu, Z., Ma, H., Sun, H. (2019). Cervical histopathology image classification using multilayer hidden conditional random fields and weakly supervised learning. IEEE Access, 7: 90378-90397. https://doi.org//10.1109/ACCESS.2019.2924467
[4] Zhang, L., Lu, L., Nogues, I., Summers, R.M., Liu, S., Yao, J. (2017). DeepPap: Deep convolutional networks for cervical cell classification. IEEE Journal of Biomedical and Health Informatics, 21(6): 1633-1643. https://doi.org//10.1109/JBHI.2017.2705583
[5] Zhang, T., Luo, Y.M., Li, P., Liu, P.Z., Du, Y.Z., Sun, P., Dong, B., Xue, H. (2020). Cervical precancerous lesions classification using pre-trained densely connected convolutional networks with colposcopy images. Biomedical Signal Processing and Control, 55: 1-11. https://doi.org/10.1016/j.bspc.2019.101566
[6] Li, X., Xu, Z., Shen, X., Zhou, Y., Xiao, B., Li, T.Q. (2021). Detection of cervical cancer cells in whole slide images using deformable and global context aware faster RCNN-FPN. Current Oncology, 28(5): 3585-3601. https://doi.org/10.3390/curroncol28050307
[7] Zhao, M., Wu, A., Song, J., Sun, X., Dong, N. (2016). Automatic screening of cervical cells using block image processing. Biomedical Engineering Online, 15(14): 1-20. https://doi.org/10.1186/s12938-016-0131-z
[8] Manna, A., Kundu, R., Kaplun, D., Sinitca, A., Sarkar, R. (2021). A fuzzy rank-based ensemble of CNN models for classification of cervical cytology. Scientific Reports, 11(1): 1-18. https://doi.org/10.1038/s41598-021-93783-8
[9] Bora, K., Chowdhury, M., Mahanta, L.B., Kundu, M.K., Das, A.K. (2017). Automated classification of Pap smear images to detect cervical dysplasia. Computer Methods and Programs in Biomedicine, 138: 31-47. http://dx.doi.org/10.1016/j.cmpb.2016.10.001
[10] Zhang, J., Liu, Y. (2004). Cervical cancer detection using SVM based feature screening. In International Conference on Medical Image Computing and Computer-Assisted Intervention, pp. 873-880. https://doi.org/10.1007/978-3-540-30136-3_106
[11] Sokouti, B., Haghipour, S., Tabrizi, A.D. (2014). A framework for diagnosing cervical cancer disease based on feedforward MLP neural network and ThinPrep histopathological cell image features. Neural Computing and Applications, 24: 221-232. https://doi.org/10.1007/s00521-012-1220-y
[12] Sato, M., Horie, K., Hara, A., Miyamoto, Y., Kurihara, K., Tomio, K., Yokota, H. (2018). Application of deep learning to the classification of images from colposcopy. Oncology Letters, 15(3): 3518-3523. https://doi.org/10.3892/ol.2018.7762.
[13] Alquran, H., Alsalatie, M., Mustafa, W.A., Abdi, R.A., Ismail, A.R. (2022). Cervical net: A novel cervical cancer classification using feature fusion. Bioengineering, 9(10): 578. https://doi.org/10.3390/bioengineering9100578
[14] Win, K.P., Kitjaidure, Y., Hamamoto, K., Myo Aung, T. (2020). Computer-assisted screening for cervical cancer using digital image processing of pap smear images. Applied Sciences, 10(5): 1-22. https://doi.org/10.3390/app10051800
[15] Dong, N., Zhao, L., Wu, C.H., Chang, J.F. (2020). Inception v3 based cervical cell classification combined with artificially extracted features. Applied Soft Computing, 93: 106311. https://doi.org/10.1016/j.asoc.2020.106311
[16] Zhao, C., Shuai, R., Ma, L., Liu, W., Wu, M. (2022). Improving cervical cancer classification with imbalanced datasets combining taming transformers with T2T-ViT. Multimedia Tools and Applications, 81(17): 24265-24300. https://doi.org/10.1007/s11042-022-12670-0
[17] Rahaman, M.M., Li, C., Yao, Y., Kulwa, F., Wu, X., Li, X., Wang, Q. (2021). DeepCervix: A deep learning-based framework for the classification of cervical cells using hybrid deep feature fusion techniques. Computers in Biology and Medicine, 136: 1-12. https://doi.org/10.1016/j.compbiomed.2021.104649
[18] Shi, J., Wang, R., Zheng, Y., Jiang, Z., Zhang, H., Yu, L. (2021). Cervical cell classification with graph convolutional network. Computer Methods and Programs in Biomedicine, 198: 105807. https://doi.org/10.1016/j.cmpb.2020.105807
[19] Alagirisamy, M. (2021). Micro statistical descriptors for glaucoma diagnosis using neural networks. International Journal of Advances in Signal and Image Sciences, 7(1): 1-10. https://doi.org/10.29284/ijasis.7.1.2021.1-10
[20] Uçar, G., Dandıl, E. (2024). Enhanced detection of white matter hyperintensities via deep learning-enabled MR imaging segmentation. Traitement du Signal, 41(1): 1-21. https://doi.org/10.18280/ts.410101
[21] Jantzen, J., Norup, J., Dounias, G., Bjerregaard, B. (2005). Pap-smear benchmark data for pattern classification. Nature Inspired Smart Information Systems (NiSIS 2005), 1-9.
[22] Wagle, S.A., Harikrishnan, R., Sampe, J., Mohammad, F., Md Ali, S.H. (2021). Effect of data augmentation in the classification and validation of tomato plant disease with deep learning methods. Traitement du Signal, 38(6): 1657-1670. https://doi.org/10.18280/ts.380609
[23] Cao, Y., Cao, J., Zhou, Z., Liu, Z. (2021). Aircraft track anomaly detection based on MOD-Bi-LSTM. Electronics, 10(9): 1007. https://doi.org/10.3390/electronics10091007
[24] Simonyan, K., Zisserman, A. (2014). Very deep convolutional networks for large-scale image recognition. arXiv preprint arXiv:1409.1556. https;//doi.org/10.48550/arxiv.1409.1556
[25] Alex, K., Ilya, S., Hinton, G.E. (2012). ImageNet classification with deep convolutional neural networks. Advances in Neural Information Processing Systems, 60(6): 1097-1105. https://doi.org/10.1145/3065386
[26] He, K., Zhang, X., Ren, S., Sun, J. (2016). Deep residual learning for image recognition. In IEEE Conference on Computer Vision and Pattern Recognition, Las Vegas, USA, pp. 770-778. https://doi.org/10.1109/CVPR.2016.90
[27] Szegedy, C., Liu, W., Jia, Y., Sermanet, P., Reed, S., Anguelov, D., Erhan, D., Vanhoucke, V., Rabinovich, A. (2015). Going deeper with convolutions. IEEE Conference on Computer Vision and Pattern Recognition, Boston, USA, pp. 1-9. https://doi.org/10.1109/CVPR.2015.7298594