Abdelwhab Ouahab![]()
© 2025 The author. This article is published by IIETA and is licensed under the CC BY 4.0 license (http://creativecommons.org/licenses/by/4.0/).
OPEN ACCESS
Cancer ranks among the top causes of death, primarily due to its tendency to be diagnosed at a late stage and its highly aggressive nature. Lung cancer, in particular, has one of the highest mortality rates due to delayed diagnosis. The purpose of this study is to address this issue by applying cutting-edge deep learning methods for the prompt identification of lung cancer from CT scan images. In particular, various Convolutional Neural Network (CNN) architectures are utilized to distinguish between cancerous and non-cancerous CT scan images. To further enhance classification accuracy, a spatial attention mechanism is integrated into the models, enabling them to focus on relevant image regions. The developed models are assessed using a publicly accessible dataset and assessed based on various performance indicators, including precision, recall, accuracy and the F1-score. The findings highlight the superior performance of the attention-enhanced DenseNet model, achieving significant improvements in classification metrics compared to other architectures. The research supports the improvement of reliable computer-aided diagnosis systems for lung cancer, with a focus on the effectiveness of embedding attention modules within CNNs for medical imaging tasks.
lung cancer, deep learning, CNN, attention mechanism, medical imaging, classification
Among various illnesses, cancer stands out as a highly fatal condition with a substantial likelihood of leading to death. It moved from the ninth rank to the sixth rank in terms of diseases that are most fatal to humans [1, 2].
Cancer results from a combination of environmental, lifestyle, and genetic factors. Cancer development is closely linked to environmental carcinogens, including tobacco smoke, air pollutants, and hazardous chemicals. Moreover, individual lifestyle decisions, such as poor diet, lack of exercise, smoking, and alcohol use, significantly increase susceptibility to the disease. Genetic predisposition also increases susceptibility, where mutations in specific genes may lead to the uncontrolled growth of cells. Cancer can be broadly classified into several types, including carcinomas [3] (affecting skin or organ linings), sarcomas [4] (connective tissues like bone and muscle), leukemias [5] (blood and bone marrow), lymphomas [6] (lymphatic system), melanomas [7] (skin pigment cells), and [8] brain or spinal cord tumors.
Lung cancer leads to high rates of mortality in developing and industrialized countries. For example, in India, the mortality rate is estimated at 0.3% per year [3]. Studies have shown that women who smoke are more susceptible to lung disease than men [2]. One of the key difficulties in preventing cancer lies in its insidious nature—it often shows signs and symptoms only in the later stages, by which time the disease may have progressed to a point where effective treatment becomes extremely difficult or, in some cases, impossible. Late-stage detection remains a major concern, particularly for lung cancer, where prompt diagnosis plays a vital role in improving patient prognosis. Extensive research has been dedicated to developing methods that detect lung cancer using CT scan data [1, 9-17].
To address the urgent demand for early lung cancer diagnosis, this research concentrates on designing a system that employs advanced Convolutional Neural Network (CNN) models alongside CT imaging to detect lung nodules at an early stage. Lung nodules are often the first visible signs of lung cancer in imaging tests, and detecting them at an early stage is crucial for timely intervention [4]. CT scans [5] are commonly used in healthcare to create detailed body images, which are essential for detecting lung cancer effectively. Figure 1 illustrates the CT scan images utilized to identify the presence of a lung nodule, which is indicative of a cancerous tumor. CNNs have shown exceptional performance in image analysis tasks. Due to their capability to autonomously learn and extract meaningful features from visual data, CNNs are highly effective for medical image analysis. In this research, a range of CNN architectures will be utilized to examine CT scan images to detect lung cancer in its beginning stages. One of the primary objectives is to classify the CT images into cancerous and non-cancerous categories. The categorization of CT scan images is done with various CNN models such as VGG-19, VGG-16, MobileNet and DenseNet. Through a comparative analysis of different CNN models, the objective is to identify the architecture that offers optimal performance in classifying lung cancer from CT scans, based on indicators including precision, accuracy, and processing efficiency. Additionally, with the aim of enhancing model efficiency, an attention mechanism will be incorporated into the CNN models. The attention mechanism is incorporated to enable the model concentrating towards the most critical regions within the image—such as tumors or nodules—while minimizing the influence of non-relevant areas and overcoming the limitations of traditional CNN architectures. This mechanism helps the model to improve its feature extraction by assigning higher weights to critical areas and enabling more accurate classification.
Figure 1. The lung nodules [1]
The key contributions of our suggested research are outlined below:
This work explores multiple deep learning approaches applied to CT scan data for the purpose of lung cancer detection.
The models used are VGG-16, VGG-19, MobileNet, DenseNet, AlexNet, InceptionResnet and ResNetMobile.
We developed CNN models with integrated spatial attention mechanisms to enhance feature extraction and select relevant features.
We carefully tested how well the deep learning models work by using different evaluation measures.
Numerous researchers have employed artificial intelligence and deep learning to tackle classification challenges, particularly in the medical domain. Several studies have focused on the application of Convolutional Neural Networks (CNNs) for detecting and classifying lung cancer using various imaging techniques, including histopathological images and computed tomography (CT) scans.
Wang et al. [6] introduced a multi-crop CNN architecture that automatically classifies lung nodules from CT scans by extracting specific features necessary for lung nodule classification. This architecture utilizes a novel multi-crop pooling technique that crops different regions from convolutional feature maps and applies max-pooling multiple times. Their extensive experiments demonstrated that this approach not only achieves state-of-the-art performance in classifying nodule malignancy but also accurately captures critical nodule characteristics such as diameter, margin, and subtlety, which are essential for predicting malignancy.
Mundra et al. [7] developed a 3D CNN architecture consisting of two primary modules. The first module, a 3D region proposal network, identifies potential nodules, while the second module evaluates the five most confidently detected nodules to estimate their likelihood of being cancerous. The outputs are integrated using a leaky noisy-OR gate to estimate the overall probability of lung cancer. Both components of this network are based on a modified U-Net architecture. This model demonstrated its effectiveness by securing first place in the 2017 Data Science Bowl.
Inoue et al. [8] employed six deep learning models that combine CT scan data with histopathological images to detect lymph node metastasis. Among these, the CNN Gradient Descent model achieved the highest performance, with an accuracy of 97.86%, precision of 96.39%, sensitivity of 96.79%, specificity of 97.40%, and an F-score of 97.96%. This methodology presents a promising approach for lung cancer diagnosis and could be further enhanced by incorporating fuzzy genetic optimization techniques.
In the study by Aljuhani et al. [4], image processing techniques were employed in conjunction with machine learning methods, including Support Vector Machines (SVM), to classify CT images into normal and abnormal lung conditions. Tandon et al. [9] proposed a multi-view CNN approach for detecting pulmonary nodules in CT scans, which received inputs from three distinct detectors designed to identify large, solid, and subsolid nodules.
Pang et al. [10] aimed to identify imaging biomarkers to aid in recognizing and staging non-small cell lung cancer (NSCLC) by applying various machine learning techniques to features extracted from CT images. Their findings suggest that CT image features can reliably predict the pathological stage of NSCLC.
Fan et al. [11] designed and assessed a deep neural network based on DenseNet, combined with the adaptive boosting technique, to differentiate between normal and malignant lung images in CT scans. The dataset included 201 images, with 85% allocated for training and the remaining 15% for testing, resulting in a classification accuracy of 90.85%.
Pennisi et al. [12] presented an automated computer-aided diagnosis system named Lung-Deep, which utilizes digital CT scans and deep learning techniques to detect six categories of lung nodules without the need for complex image pre-processing. The system integrates CNNs, RNNs, and softmax classifiers. Evaluated on a dataset of 1,200 CT images containing 3,250 nodules, the model achieved a sensitivity of 88%, specificity of 80%, and an AUC of 0.98, surpassing the effectiveness of existing diagnostic methods.
Nasser et al. [13] introduced a novel approach that integrates computational intelligence by combining Swarm Intelligence techniques with Deep Learning for identifying and classifying malignant pulmonary nodules in CT images. This methodology involves utilizing seven swarm intelligence algorithms alongside CNNs on the LIDC-IDRI dataset. The primary objective was to evaluate whether swarm-based optimization outperforms conventional training methods such as backpropagation and gradient descent. The findings revealed that models trained using swarm intelligence exhibited superior performance in terms of accuracy, precision, sensitivity, specificity, and training efficiency, with the highest-performing model achieving 93.71% accuracy, 93.53% precision, 92.96% sensitivity, and 98.52% specificity, accompanied by a 25% reduction in training time.
Liu et al. [14] utilized a combination of DenseNet and attention modules. The integration of attention into DenseNet demonstrated a marked improvement in performance metrics, indicating its effectiveness compared to the baseline DenseNet without attention. The model demonstrated an average increase of 20% in accuracy and 19.66% in precision.
This section outlines the methodological framework of the study, including the dataset utilized, preprocessing techniques, deep learning architectures implemented, and the evaluation metrics employed to assess model performance.
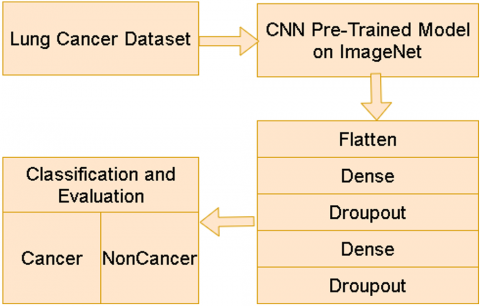
The primary goal of this work is to assess the impact of incorporating a spatial attention mechanism into deep learning architectures for classifying lung CT scan images. Two model configurations are evaluated: one includes a Spatial Attention Layer, while the other does not. Both architectures are based on pre-trained Convolutional Neural Networks (CNNs) sourced from ImageNet, aiming to enhance classification accuracy between malignant and benign nodules. Figures 2 and 3 present the respective workflow diagrams for models with and without attention mechanisms.
Figure 2. The flowchart of lung cancer detection using CNNs without attention module
Figure 3. Flowchart illustrating the process of lung cancer detection using CNNS enhanced with an attention module
3.1 Dataset
The dataset utilized in this study is the Lung Image Database, which is available for free on Kaggle. This dataset consists of a collection of lung CT scan images, annotated by multiple radiologists. The annotations provide ground-truth information regarding cancerous and non-cancerous nodules. Table 1 gives the details about how many images are used for training and testing.
Table 1. The number of CT images used for training and test
|
Training |
Test |
||
|
cancerous |
non-cancerous |
cancerous |
non-cancerous |
|
1124 |
871 |
1124 |
871 |
3.2 Preprocessing steps
To make the CT scan data suitable for model training, essential preprocessing procedures are applied in advance. To standardize input for CNN models, each image is resized to a fixed dimension. In this work, images are resized to 224×224 pixels, which is suitable for most deep learning architectures, including VGG, DenseNet, and MobileNet. To aid model convergence during training, pixel intensities are normalized to a [0, 1] range by scaling each pixel value with a factor of 1/255. Additionally, data augmentation techniques are employed to expand the training dataset and reduce the risk of overfitting. These techniques include random rotations, horizontal and vertical flips, zooming, and slight translations. Data augmentation artificially inflates the dataset and ensures that the models learn to generalize from various representations of the same image. Specifically, we employed transformations such as horizontal and vertical flipping, zooming, rotation, and slight shifts, using the ImageDataGenerator in Keras. These augmentations were applied uniformly across both classes to reduce overfitting and enhance the diversity of training samples, especially for the minority class.
3.3 CNN models
Both proposed architectures incorporate various advanced pre-trained Convolutional Neural Network (CNN) models such as VGG-16, VGG-19, MobileNet, DenseNet, and InceptionResNet. These networks, initially trained on the extensive ImageNet dataset, offer a robust baseline by utilizing features learned from millions of labeled images, making them well-suited for image classification tasks.
3.3.1 VGG-16 and VGG-19
With 16 and 19 layers, respectively, VGG-16 and VGG-19 are deep CNN architectures. The parameter count for VGG-16 is around 138 million, and for VGG-19, it's about 144 million. In VGG-16, the architecture follows a sequence of 13 convolution layers and 5 pooling operations, ending with two dense layers and a softmax function for classification. VGG-19 extends this structure by adding three additional convolutional layers. Both models employ ReLU activation functions and apply dropout in the fully connected layers to prevent overfitting [14].
3.3.2 ResNet
ResNet is a deep CNN network that introduces the residual learning. One of the important advantages of ResNet is its ability to avoid bad results while increasing network depth [8]. ResNet also improves computational efficiency and training capabilities. Skip connections apply across two or three layers containing ReLU and batch normalization. ResNet performs well in image classification by effectively extracting image features [15].
3.3.3 MobileNet
MobileNet is a deep CNN network specifically designed for low-powered devices like smartphones and embedded systems, introduced by Google in 2017. This model employs depthwise separable convolutions—a method that breaks the traditional convolution operation into two distinct stages. Initially, depthwise convolution processes each input channel using distinct filters. Subsequently, pointwise convolution employs a 1×1 kernel to merge the outputs across all channels into a unified representation. This method significantly decreases both computational cost and parameter count, without compromising accuracy [16].
3.3.4 InceptionResNetV2
InceptionResNetV2 streamlines the traditional inception modules by integrating residual connections from ResNet. These connections facilitate the training of deeper architectures and enhance overall model performance. Studies have shown that InceptionResNetV2 accelerates the training of Inception models due to these residual connections [17].
3.3.5 DenseNet
DenseNet effectively tackles common issues in deep networks, such as vanishing gradients and suboptimal parameter utilization. Its primary contribution lies in dense connectivity, where each layer is connected to all previous layers in a feedforward fashion. This architecture improves gradient flow and learning efficiency. The dense block, a fundamental component of the network, ensures that every layer receives features maps from all earlier layers and forwards its own output, encouraging feature reuse throughout the model. DenseNet also includes shortcut connections to prevent vanishing gradients, making training more efficient.To control complexity, DenseNet uses transition layers between dense blocks, which combine convolution and pooling to reduce channels and downsample spatial dimensions. DenseNet uses parameters more effectively than traditional models, requiring fewer parameters while improving accuracy and training performance. This architecture is particularly well-suited for image classification and is extensively utilized in various computer vision applications [18].
3.3.6 NaseNetMobile
NasNetMobile, a model introduced by Google Brain in 2016, incorporates a framework consisting of three primary elements: architecture search space, the algorithm used for searching, and performance estimation techniques. The search space includes operations such as convolutions, fully connected layers, and max-pooling, along with exploring how these operations are interconnected. To identify suitable neural network architectures, the search strategy employs methods like random search and reinforcement learning. The goal of performance estimation is to optimize resource efficiency by reducing the time and computational effort needed for model evaluation [19].
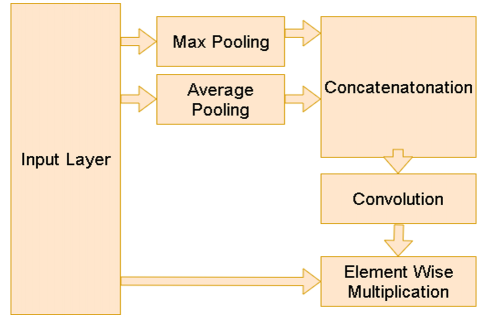
3.4 Spatial attention layer
The Spatial Attention Layer in this model enhances the ability of the network to concentrate on relevant spatial regions within an image by applying a dynamic attention mechanism. It first computes two pooled feature maps—one via average pooling, which captures global patterns, and the other via max pooling, which emphasizes the strongest activations. The resulting pooled feature maps are combined and processed through a convolutional layer, producing a spatial attention map that emphasizes significant areas by assigning greater weights to the most relevant regions. The attention map is integrated with the original feature map using element-wise multiplication, allowing the model to concentrate on the most significant regions for binary classification. This attention mechanism enhances classification performance by allowing the model to concentrate on critical image regions [20-29]. The configuration of the attention module is depicted in Figure 4.
Figure 4. The spatial attention layers
In the spatial attention layer, there are two poling layers which are average layer and max pooling layer. The average layer is computed as:
$F_{a v g}(x, y)=\frac{1}{C} \sum_{k=1}^C F(x, y, k)$ (1)
where, C is number of channels (or depth) of the feature map.
$F_{max }(x, y)=\max _{1 \leq k \leq C} \sum_{c=1}^C F(x, y, k)$ (2)
The $F_{a v g}$, $F_{max}$ are concatenated using the following equation:
$F_{concat}(x, y)={concat}\left(F_{avg}, F_{max}\right)$ (3)
In the final stage, the spatial attention mask is applied to the input feature map by conducting an element-wise multiplication between the input feature map F and the spatial attention map $F_{concat}$:
$F_{spatial}(x, y)=F(x, y) \odot F_{ {concat }}(x, y)$ (4)
$F_{{spatial }}$ is the refined feature map, which is now weighted by the spatial attention mask. As a result, the spatial attention mechanism amplifies the most relevant regions while diminishing the influence of less important regions.
Figure 5 visualizes the attention maps generated by our model. The attention mechanism is visualized by overlaying a heatmap onto the original image, where the attention areas are represented with a heatmap. As shown in the generated visualizations. The attention maps concentrate on important regions within the images.
Figure 5. Model attention visualization
3.5 Performance metrics
To assess and contrast the effectiveness of the various architectures, a set of essential performance metrics is employed.
3.5.1 Confusion matrix
The confusion matrix is an important tool for measuring the performance of each architecture. It evaluates how the system classifies the samples into predicted and actual classes. In the context of our work about cancer detection, four measures of the confusion matrix are defined as follows:
TP: Refers to the cases where the model correctly identifies the presence of lung cancer.
FN: Occurs when the model fails to identify lung cancer, mistakenly classifying a cancerous case as non-cancerous, resulting in a missed diagnosis.
True Negative (TN): Represents the total cases where the model accurately classifies individuals as free from lung cancer. If the model predicts "no lung cancer" and the actual condition is also "no lung cancer," it counts as a true negative.
False Positive (FP): The number of cases where the model incorrectly predicts "lung cancer," but the actual condition is "no lung cancer." These represent false alarms or incorrect diagnoses.
3.5.2 Accuracy
As a frequently used measure, it quantifies the number of correct predictions divided by the total predictions, reflecting the model’s general effectiveness [30]. The formula used to compute it is as follows:
$Accuracy =\frac{T P+T N}{T P+T N+F N+F P}$ (5)
3.5.3 Precision
Precision is a performance indicator which is commonly applied in classification problems within machine learning and statistics to assess the reliability of a model's positive predictions [31]. Precision quantifies the proportion of correctly predicted positive cases out of all cases that the model classified as positive. It is mathematically represented as:
$Precision =\frac{T P}{T P+F P}$ (6)
3.5.4 Sensitivity
Sensitivity measures the fraction of true positive cases that the model successfully detects. In medical diagnostics, maintaining high sensitivity is essential to minimize the risk of overlooking cancerous cases, since false negatives may lead to serious outcomes. The mathematicl expression for Sensitivity is:
$Recall =\frac{T P}{T P+F N}$ (7)
3.5.5 Specificity
Specificity represents the fraction of true negative instances—i.e., non-cancerous cases—that are accurately detected by the model. It serves as a complement to sensitivity and plays a critical role in minimizing false positive outcomes. The calculation is as follows:
$Specificity=\frac{T N}{F P+T N}$ (8)
3.5.6 F1-score
The F1 score is the harmonic mean of precision and recall, providing a balanced measure of the model’s performance, especially when dealing with imbalanced datasets.
$F 1- score=2 \times \frac{{ Recall } \times { Precion }}{{ Recall }+ { Precision }}$ (9)
This part outlines the performance outcomes of the implemented deep learning models utilized for predicting lung cancer based on CT scan imagery.
To mitigate overfitting, especially considering the limited dataset size, we employed several regularization techniques such as dropout layers (with a rate of 0.5), early stopping based on validation loss, and frozen base layers during initial training phases. Additionally, data augmentation was applied using ImageDataGenerator to enhance data diversity.
The models were evaluated on various indicators including: accuracy, precision, recall, specificity and F1-score. The obtained values of these metrics are shown in Table 2. The confusion matrices of the two models are shown in Figures 6 and 7. Figure 8 shows the model accuracy comparison with and without the attention module. The accuracy and loss functions are shown in Figures 9 and 10.
Table 2. The computed values for the evaluation criteria
|
|
Accuracy |
Precision |
Recall |
Specificity |
F1-Score |
|
VGG-16 without attention module |
0.9682 |
0.9593 |
0.9743 |
0.9648 |
0.9667 |
|
VGG-16 with attention module |
0.9848 |
0.9748 |
0.9927 |
0.9781 |
0.9836 |
|
VGG-19 without attention module |
0.9477 |
0.9841 |
0.9179 |
0.9826 |
0.9498 |
|
VGG-19 with attention module |
0.966 |
0.9458 |
0.9779 |
0.9524 |
0.9606 |
|
DenseNest201 without attention module |
0.9962 |
0.9930 |
1.0000 |
0.9918 |
0.9965 |
|
DenseNest201 with attention module |
0.997 |
0.997 |
1 |
0.997 |
0.998 |
|
InceptionResNetV2 without attention module |
0.9611 |
0.9294 |
0.9908 |
0.9359 |
0.9591 |
|
InceptionResNetV2 with attention module |
0.9881 |
0.9846 |
0.9954 |
0.9867 |
0.9900 |
|
MobileNet without attention module |
0.9992 |
0.9982 |
1.0000 |
0.9984 |
0.9991 |
|
MobileNet with attention module |
1 |
1 |
1 |
1 |
1 |
|
NasNetMobile without attention module |
0.9962 |
0.9918 |
1.0000 |
0.9930 |
0.9959 |
|
NasNetMobile with attention module |
1 |
1 |
1 |
1 |
1 |
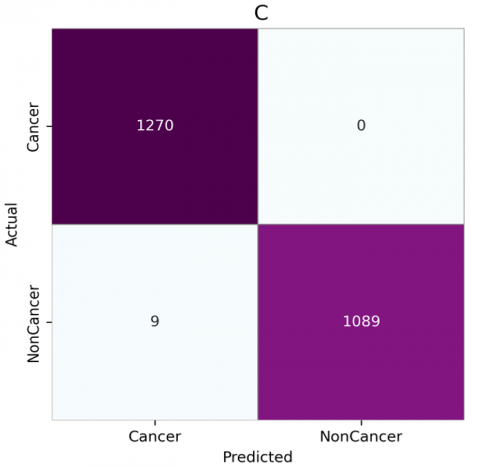
Figure 6. Confusion matrices for CNN architectures without attention: (a) VGG-16, (b) VGG-19, (c) DenseNet201, (d) InceptionResNetV2, (e) MobileNet, (f) NasNetMobile
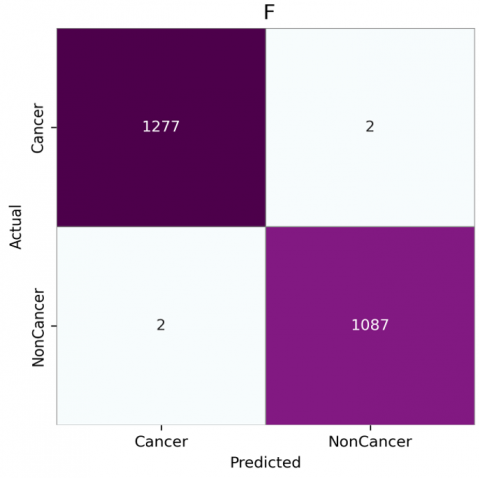
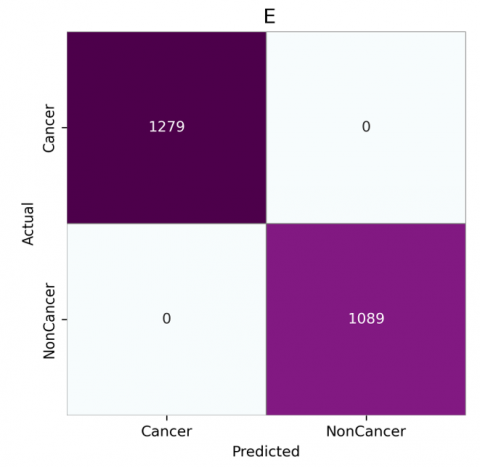
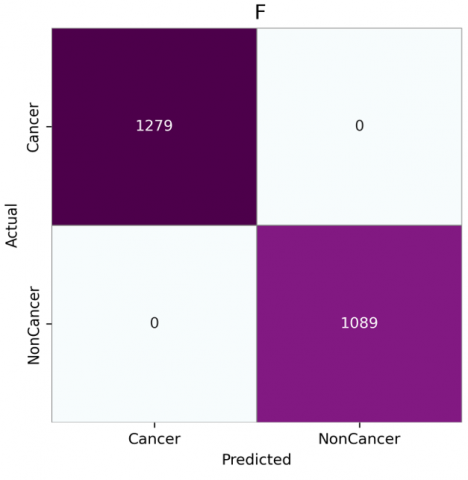
Figure 7. Confusion matrices for CNN architectures with attention: (a) VGG-16, (b) VGG-19, (c) DenseNet201, (d) InceptionResNetV2, (e) MobileNet, (f) NasNetMobile
Figure 8. Accuracy comparison with and without attention module
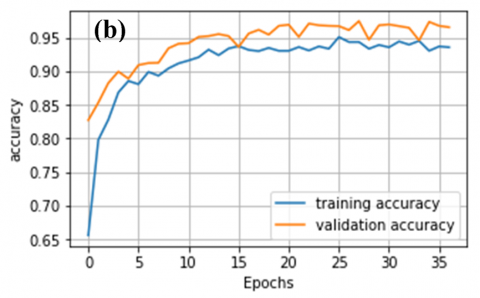
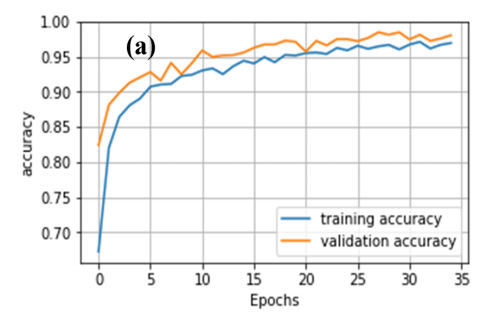
Figure 9. Accuracy plots for CNN models without attention mechanisms: (a) VGG-16, (b) VGG-19, (c) DenseNet201, (d) InceptionResNetV2, (e) MobileNet, (f) NasNetMobile
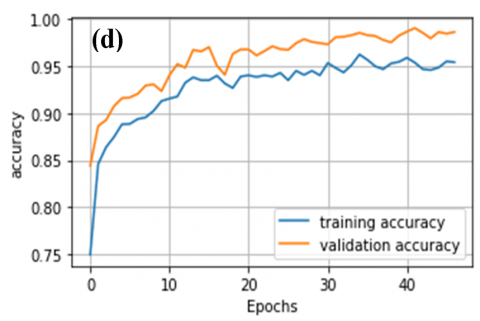
Figure 10. Accuracy plots for CNN models with attention mechanisms: (a) VGG-16, (b) VGG-19, (c) DenseNet201, (d) InceptionResNetV2, (e) MobileNet, (f) NasNetMobile
Table 2 provides a comparative evaluation of six deep learning models, analyzing their performance with and without the inclusion of an attention mechanism across five key metrics. Overall, the integration of attention modules leads to improved performance in all evaluated criteria. For instance, VGG-16 shows a significant improvement in accuracy from 0.9682 to 0.9848 when attention is added, along with increases in Precision, Recall, Specificity, and F1-score. VGG-19 similarly benefits from the attention module, improving in Accuracy from 0.9477 to 0.966, and showing an increase in F1-score from 0.9498 to 0.9606.
DenseNet201, which already performs highly even without attention, achieves nearly perfect scores with its attention-integrated version, increasing its Accuracy from 0.9962 to 0.997 and maintaining a Recall of 1.0000 in both versions. InceptionResNetV2 also sees an uplift from the addition of attention, with Accuracy rising from 0.9611 to 0.9881 and F1-score from 0.9591 to 0.9900. It is noteworthy that MobileNet and NasNetMobile achieved perfect performance across all evaluation metrics—including Accuracy, Precision, Recall, Specificity, and F1-score—when combined with the attention module, emphasizing its strong influence on enhancing these models. Overall, the accuracy comparison as shown in Figure 8 reveals that most models perform better with the attention module.
Figure 11. The prediction time per sample for the model with attention module
The confusion matrices, as shown in Figures 6 and 7, reveal that models generally perform better with the attention module, especially in reducing false positives and false negatives. Without attention, VGG16 and VGG19 have higher misclassification rates, as seen by false negatives and false positives (e.g., VGG16 shows 45 false positives and 28 false negatives). However, with the attention module, both VGG16 and VGG19 show improvement. VGG16 reduces false positives from 45 to 28 and false negatives from 28 to 8, indicating enhanced detection of both cancerous and non-cancerous cases. DenseNet201, InceptionResNetV2, MobileNet, and NasNetMobile perform consistently well, particularly with attention. They achieve nearly perfect classification with minimal or no false positives and false negatives. MobileNet and NasNetMobile, notably, achieve flawless performance both with and without attention, emphasizing their robustness. Overall, the integration of attention mechanisms significantly reduced false negatives across various models. Notably, MobileNet and NasNetMobile achieved perfect classification performance, with zero false positives and zero false negatives, both with and without the attention module. This indicates their robustness and potential reliability in clinical settings.
The histogram illustrated in Figure 11 clearly demonstrates the variation in prediction time per sample among different deep learning models enhanced with attention modules.
MobileNet emerges as the fastest high-performing model, requiring only 0.44182 seconds to predict a single sample while maintaining perfect evaluation metrics. It offers the best trade-off between speed and accuracy. In contrast, NASNetMobile also achieving perfect accuracy, has the highest prediction time of 4.2945 seconds. Similarly, DenseNet20 and InceptionResNetV2 demonstrate high accuracy but with much longer prediction times (2.7975s and 3.0319s, respectively). The VGG models, especially VGG-16 provide a balanced alternative, offering good accuracy with lower prediction times (0.376s).
As shown in Figure 10, the MobileNet model enhanced with the attention mechanism achieved flawless classification results, while also recording one of the shortest prediction times per sample. This highlights its strong potential for deployment in real-time, resource-constrained clinical settings where low latency and computational efficiency are essential.
The study presents a comparative framework for using CNNs in lung cancer detection. Results indicate that incorporating an attention mechanism into CNN architectures significantly improves model performance by directing focus toward relevant features. The DenseNet and InceptionResNet architectures, when integrated with spatial attention mechanisms, exhibited enhanced accuracy and strong feature extraction abilities, making them well-suited for the challenging task of early lung cancer identification.
While the proposed approach demonstrated strong performance on the Kaggle dataset used in this study, a notable limitation is the lack of evaluation on external datasets such as LIDC-IDRI. This limitation hinders a comprehensive evaluation of the model’s generalizability across various imaging techniques and patient demographics.
Future research will focus on testing the model with more diverse and publicly accessible datasets to enhance its robustness and real-world clinical relevance.
[1] Shah, A.A., Malik, H.A.M., Muhammad, A., Alourani, A., Butt, Z.A. (2023). Deep learning ensemble 2D CNN approach towards the detection of lung cancer. Scientific Reports, 13(1): 2987. https://doi.org/10.1038/s41598-023-29656-z
[2] Gilad, S., Lithwick-Yanai, G., Barshack, I., Benjamin, S., Krivitsky, I., et al. (2012). Classification of the four main types of lung cancer using a microRNA-based diagnostic assay. The Journal of Molecular Diagnostics, 14(5): 510-517. https://doi.org/10.1016/j.jmoldx.2012.03.004
[3] Wang, F., Yang, Y., Du, X., Zhu, X., Hu, Y., et al. (2023). Claudin18. 2 as a potential therapeutic target for primary ovarian mucinous carcinomas and metastatic ovarian mucinous carcinomas from upper gastrointestinal primary tumours. BMC Cancer, 23(1): 44. https://doi.org/10.1186/s12885-023-10533-x
[4] Aljuhani, W., Alanazi, A., Alshehri, E., Alageel, M.K., Masuadi, E., Zolaly, M., Bobsait, A. (2024). Descriptive analysis of incidence, demographic characteristics, and survival outcomes of soft-tissue sarcoma of the extremities in Saudi Arabia. Scientific Reports, 14(1): 29123. https://doi.org/10.1038/s41598-024-79716-1
[5] Khawaja, S.A., Farooq, M.S., Ishaq, K., Alsubaie, N., Karamti, H., et al. (2024). Prediction of leukemia peptides using convolutional neural network and protein compositions. BMC Cancer, 24(1): 900. https://doi.org/10.1186/s12885-024-12609-8
[6] Wang, J., Yau, C.E., Low, C.E., Bin Hasan Mohamed, M.H., Cheng, C.L., et al. (2024). Indolent nodal T follicular helper cell lymphomas—A case series. Blood Cancer Journal, 14(1): 205. https://doi.org/10.1038/s41408-024-01163-y
[7] Mundra, P.A., Dhomen, N., Rodrigues, M., Mikkelsen, L.H., Cassoux, N., et al. (2021). Ultraviolet radiation drives mutations in a subset of mucosal melanomas. Nature Communications, 12(1): 259. https://doi.org/10.1038/s41467-020-20432-5
[8] Inoue, A., Ikata, T., Katoh, S. (1996). Spinal deformity following surgery for spinal cord tumors and tumorous lesions: Analysis based on an assessment of the spinal functional curve. Spinal Cord, 34(9): 536-542. https://doi.org/10.1038/sc.1996.97
[9] Tandon, R., Agrawal, S., Rathore, N.P.S., Mishra, A.K., Jain, S.K. (2024). A systematic review on deep learning-based automated cancer diagnosis models. Journal of Cellular and Molecular Medicine, 28(6): e18144. https://doi.org/10.1111/jcmm.18144
[10] Pang, F., Shi, D., Yuan, L. (2023). Screening and identification of key genes for cervical cancer, ovarian cancer and endometrial cancer by combinational Bioinformatic analysis. Current Bioinformatics, 18(8): 647-657. https://doi.org/10.2174/1574893618666230428095114
[11] Fan, X., Lu, Y., Hou, J., Lin, F., Huang, Q., Yan, C. (2023). DMC-UNet-based segmentation of lung nodules. IEEE Access, 11: 110809-110826. https://doi.org/10.1109/ACCESS.2023.3322437
[12] Pennisi, A., Bloisi, D.D., Suriani, V., Nardi, D., Facchiano, A., Giampetruzzi, A.R. (2022). Skin lesion area segmentation using attention squeeze U-Net for embedded devices. Journal of Digital Imaging, 35(5): 1217-1230. https://doi.org/10.1007/s10278-022-00634-7
[13] Naseer, I., Akram, S., Masood, T., Rashid, M., Jaffar, A. (2023). Lung cancer classification using modified u-net based lobe segmentation and nodule detection. IEEE Access, 11: 60279-60291. https://doi.org/10.1109/ACCESS.2023.3285821
[14] Liu, K. (2022). Stbi-yolo: A real-time object detection method for lung nodule recognition. IEEE Access, 10: 75385-75394. https://doi.org/10.1109/ACCESS.2022.3192034
[15] Horry, M.J., Chakraborty, S., Pradhan, B., Paul, M., Zhu, J., et al. (2023). Full-resolution lung nodule localization from chest X-Ray images using residual encoder-decoder networks. IEEE Access, 11: 143016-143036. https://doi.org/10.1109/ACCESS.2023.3343451
[16] Mohamed, T.I., Ezugwu, A.E.S. (2024). Enhancing lung cancer classification and prediction with deep learning and multi-omics data. IEEE Access, 12: 59880-59892. https://doi.org/10.1109/ACCESS.2024.3394030
[17] Rahane, W., Dalvi, H., Magar, Y., Kalane, A., Jondhale, S. (2018). Lung cancer detection using image processing and machine learning healthcare. In 2018 International Conference on Current Trends towards Converging Technologies (ICCTCT), Coimbatore, India, pp. 1-5. https://doi.org/10.1109/ICCTCT.2018.8551008
[18] Ouahab, A. (2021). Multimodal convolutional neural networks for detection of covid-19 using chest x-ray and CT images. Optical Memory and Neural Networks, 30(4): 276-283. https://doi.org/10.3103/S1060992X21040044
[19] Shen, W., Zhou, M., Yang, F., Yu, D., Dong, D., et al. (2017). Multi-crop convolutional neural networks for lung nodule malignancy suspiciousness classification. Pattern Recognition, 61: 663-673. https://doi.org/10.1016/j.patcog.2016.05.029
[20] Liao, F., Liang, M., Li, Z., Hu, X., Song, S. (2019). Evaluate the malignancy of pulmonary nodules using the 3-d deep leaky noisy-or network. IEEE Transactions on Neural Networks and Learning Systems, 30(11): 3484-3495. https://doi.org/10.1109/TNNLS.2019.2892409
[21] Rajasekar, V., Vaishnnave, M.P., Premkumar, S., Sarveshwaran, V., Rangaraaj, V. (2023). Lung cancer disease prediction with CT scan and histopathological images feature analysis using deep learning techniques. Results in Engineering, 18: 101111. https://doi.org/10.1016/j.rineng.2023.101111
[22] Setio, A.A.A., Ciompi, F., Litjens, G., Gerke, P., Jacobs, C., et al. (2016). Pulmonary nodule detection in CT images: False positive reduction using multi-view convolutional networks. IEEE Transactions on Medical Imaging, 35(5): 1160-1169. https://doi.org/10.1109/TMI.2016.2536809
[23] Yu, L., Tao, G., Zhu, L., Wang, G., Li, Z., Ye, J., Chen, Q. (2019). Prediction of pathologic stage in non-small cell lung cancer using machine learning algorithm based on CT image feature analysis. BMC Cancer, 19: 1-12. https://doi.org/10.1186/s12885-019-5646-9
[24] Kalaivani, N., Manimaran, N., Sophia, S., Devi, D.D. (2020). Deep learning based lung cancer detection and classification. IOP Conference Series: Materials Science and Engineering, 994(1): 012026. https://doi.org/10.1088/1757-899X/994/1/012026
[25] Abbas, Q. (2017). Lung-deep: a computerized tool for detection of lung nodule patterns using deep learning algorithms detection of lung nodules patterns. International Journal of Advanced Computer Science and Applications, 8(10): 112-116. https://doi.org/10.14569/IJACSA.2017.081015
[26] de Pinho Pinheiro, C.A., Nedjah, N., de Macedo Mourelle, L. (2020). Detection and classification of pulmonary nodules using deep learning and swarm intelligence. Multimedia Tools and Applications, 79(21): 15437-15465. https://doi.org/10.1007/s11042-019-7473-z
[27] Uddin, J. (2024). Attention-based densenet for lung cancer classification using CT scan and histopathological images. Designs, 8(2): 27. https://doi.org/10.3390/designs8020027
[28] Ali, I., Muzammil, M., Haq, I.U., Amir, M., Abdullah, S. (2021). Deep feature selection and decision level fusion for lungs nodule classification. IEEE Access, 9: 18962-18973. https://doi.org/10.1109/ACCESS.2021.3054735
[29] Gupta, I., Singh, S., Gupta, S., Nayak, S.R. (2024). Classification of brain tumours in MRI images using a convolutional neural network. Current Medical Imaging, 20(1): E270323214998. https://doi.org/10.2174/1573405620666230327124902
[30] Taşar, B. (2023). SkinCancerNet: Automated classification of skin lesion using deep transfer learning method. Traitement du Signal, 40(1): 285-295. https://doi.org/10.18280/ts.400128
[31] Nayak, T.K., Rao, A.C.S., Nayak, S.R. (2024). A novel patch-based ensembling approach with perceptual attention for skin lesion classification. Traitement du Signal, 41(5): 2233-2247. https://doi.org/10.18280/ts.410502