Shyam Babu*![]() | Arun Kumar Wadhwani
| Arun Kumar Wadhwani![]()
© 2024 The authors. This article is published by IIETA and is licensed under the CC BY 4.0 license (http://creativecommons.org/licenses/by/4.0/).
OPEN ACCESS
Epilepsy is a complicated neurological disorder that causes rapid and frequent seizures in both adults and children. EEG signals are emerging as non-invasive methods for analyzing epilepsy. However, processing and analyzing large volumes of EEG data requires significant time and expertise from neurophysiologists. This research presents a novel method to effectively differentiate between focal EEG and non-focal EEG data using the DAGSVM classifier. The suggested method utilizes the Bern Barcelona dataset and applies the Discrete Fourier Transform to EEG signals to identify time-frequency characteristics. We use 7,000 EEG signals, with 700 for testing and 6,800 for training. Results suggest that the DAGSVM classifier significantly exceeds existing approaches, achieving an accuracy of 99.71%. High accuracy improves patient results by facilitating the early diagnosis and care of epilepsy.
electroencephalogram, directed acyclic graph SVM, epilepsy, discrete wavelet transform, machine learning
Epilepsy is a complicated neurological condition marked by recurring seizures and has significant effects on brain growth. Approx 65 million people worldwide live with the condition. Alharthi et al. [1] analyzed epileptic seizure diagnosis using EEG data and apply advanced signal processing and machine learning methods. A study suggests that it is now easier to detect seizures, which could improve diagnosis and outcomes for people with epilepsy. Vandana and Nirali [2] explored the application of machine learning in EEG data analysis for neurological disease diagnosis, highlighting the annual impact on 2.4 million individuals. Their manuscript emphasizes the potential of machine learning classifiers to enhance diagnostic accuracy. Alturki et al. [3] diagnosed neurological disorders using discrete wavelet transform (DWT) and machine learning algorithms on EEG data. Their analysis examines how DWT separates EEG data into multiple frequency bands and extracts essential features for study. EEG signal analysis uses signal processing methods to observe and interpret neurological conditions by computing the electrical action of brain neurons. Alkawadri [4] summarized the benefits of iEEG and BCI procedures to improve the details of epilepsy seizure and its management.
Abiri et al. [5] included extensive EEG studies based on BCI paradigms. This work examines BCI systems and highlights their weaknesses and challenges. Bera [6] pointed out the flexibility of EEG techniques in clinical environments and their compatibility with frontier technologies. Gao et al. [7] used Deep CNN on electroencephalography data to improve the precision and efficacy of analysing epileptic seizure episodes. Xu et al. [8] suggested a CNN architecture for processing EEG signals to increase the quality and reliability of diagnostic applications using EEG data. Jaya et al. [9] investigated using a backpropagation neural network for frequency-based epileptiform wave classification. Their main objective is to enhance the diagnostic accuracy of the EEG analysis for examining and identifying epilepsy. Subathra et al. [10] suggested splitting focal and non-focal EEG data using FWHT and ANN Techniques.
Choubey and Pandey [11] proposed integrating a feature extraction method based on MFDFA and HFD with an ANN classifier to examine the EEG data for a more precise fractal features study. Miltiadous et al. [12] used online EEG datasets to study machine-learning classifiers for epileptic seizure detection. Molla et al. [13] used EEG signal processing techniques and a GEDFS approach to increase the accuracy of epilepsy detection.
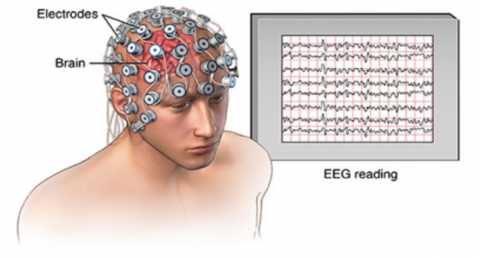
Al-Jumaili et al. [14] used computational approaches to increase the accuracy and efficacy of epilepsy diagnosis by classifying EEG seizure signals using supervised machine learning algorithms. Alturki et al. [15] examined the efficacy of combining discrete wavelet transform with support vector machine techniques to assess EEG data for epilepsy and autism. As shown in Figure 1, an EEG recording uses electrodes on the scalp to capture the brain's electrical activity. The signals show brainwave patterns from different regions during the recording.
Figure 1. A visualization of an EEG recording [15]
Abdolzadegan et al. [16] suggested using DBSCAN clustering in conjunction with feature selection to use EEG data for early detection of autism spectrum disorder. This technique enhances diagnostic precision by significant EEG patterns and organizing data effectively. de Filippis et al. [17] investigate machine learning methods for using structural and functional MRI datasets to diagnose schizophrenia and comprehend its neurobiological sources.
Sharma et al. [18] utilized an automated method for identifying concentrated EEG signals. This method significantly improves the accuracy of feature extraction and classification.
Fraiwan and Alkhodari [19] proposed an advanced diagnosis method for epilepsy that enhances EEG data processing through machine learning algorithms. Single-channel EEG data and Long Short-Term Memory (LSTM) algorithms accurately classify epileptic patients into focal and non-focal categories.
Srinath and Gayathri [20] proposed ML techniques to recognize and classify EEG data related to epilepsy diagnosis. Their investigation also focuses on improving diagnostic accuracy through advanced computational methods applied to EEG data.
Saminu et al. [21] reported a study that uses deep learning and Wavelet Transform Synchro squeezing Transform (WT-SST) algorithms to localize epileptogenic zones using electroencephalogram data.
Xin et al. [22] presented a wavelet convolution neural network approach based on attention for classifying non-epileptic and epileptic EEG data. This method decomposes EEG data using wavelet analysis and classifies the resulting CNNs using attention processes. This method achieves high accuracy rates of 99.70% and 98.89% on test datasets.
Anuragi et al. [23] suggested using geometrical characteristics from an FBSE-EWT rhythm's second-order difference plot to differentiate between focal and non-focal EEG data. This method promotes the accuracy of epilepsy diagnosis more than standard approaches by addressing the complex and nonlinear nature of EEG signals.
Andrzejak et al. [24] used statistical practices to determine detailed EEG signals and comprehend nonlinearity in EEG recordings from epileptic patients. Their study significantly advances epilepsy research and offers a deep knowledge of brain activity in people with epilepsy.
1.1 EEG signal processing and analysis
Alturki et al. [15] assessed EEG band power using DWT and SVM algorithms. This method enhances the rate and accuracy of diagnosing brain disorders and suggesting potential medical applications. de Filippis et al. [17] used structural and functional MRI data to study neurological illnesses using machine learning algorithms. Despite the challenges in the practical application of their study, it greatly enhances our understanding of the brain's substrates for these conditions and significantly improves diagnostic accuracy. They also offer an automated method to identify focal EEG signals by examining higher-order statistical moments, which can differentiate between focal and non-focal signals. The process involves four steps: preparation, feature extraction, processing, and analysis of the results.
The study examines preprocessing techniques, including down-sampling and artifact handling.
(1) Down-sampling: The data collected by EEG equipment is down-sampled to lower resolutions. Studies may down-sample to lower sampling rates (16Hz, 64Hz, 512Hz, 256Hz, and 2400Hz to 600Hz) according to the application and its need.
(2) Artifact Handling: Several human physiological signals may contaminate EEG data, leading to artifacts. We can categorize artifact signals into two groups based on their origin: (i) Extrinsic artifacts: Technical issues or external factors, such as incorrect electrode placement, cause these artifacts. (ii) Internal artifacts: These artifacts come from the muscular action, electrical noise and incorrect electrode placement [22-24].
This present study offers significant advances in two main domains. First, it presents preprocessing approaches that efficiently reduce noise artifacts using the Discrete Fourier Transform. Second, it develops detailed techniques for extracting features from EEG data, improving the diagnosis of epilepsy by using machine learning classifiers. These advances pledge to improve the accuracy and reliability of epilepsy diagnosis.
The study ensures that the DAGSVM classifier is more effective than conventional machine learning models in detecting epilepsy.
The study explains the introduction in Section 1 and the techniques and methods in Section 2. Section 3 presents the results, and Section 4 discusses the research conclusions.
In this research, we analyze the EEG signal to diagnose epilepsy disorders. The following section explains the diagnosis procedure.
2.1 Data acquisition and preprocessing
We use the Bern-Barcelona EEG Dataset for both training and testing purposes. This dataset is publicly available online. Five patients' EEG signals, studied 80 hours at Bern University Department of Neurology, are included in this dataset, which consists of 7,500 EEG signal pairs categorized into non-focal and focal signals. All signals were sampled and tested at 512Hz for 20 seconds, and 3750 focal and 3750 non-focal EEG data were utilized for the evaluation. For further analysis, we divided 3400 focal and 3400 non-focal EEG data into the training set and 350 focal and 350 non-focal EEG signals into the testing set. The major partitioning allows the evaluation of the proposed methodology for epilepsy diagnosis. We recorded the EEG signals during preprocessing and used the Discrete Fourier Transform (DFT) method to remove noise artifacts and interferences [25].
2.2 Feature extraction
The present investigation used DWT since it is an appropriate method for analyzing nonlinear and non-stationary signals. This research examines the classification of epileptic EEG data and evaluates performance. This study compares multiple classifiers [26]. The DWT uses a single function known as the mother wavelet, to investigate signal features in the frequency and temporal domains [27].
$\psi(t)=\frac{1}{\sqrt{2}} \psi \frac{(t-y)}{x} \quad x, y, \in S, x>0$ (1)
x and y represent the scaling and shifting parameters, while S represents the wavelet space parameter. We illustrate the Wavelet Transform as follows:
$F(x, y)=\frac{1}{\sqrt{x}} \int \psi \frac{(t-y)}{x} d t$ (2)
$\begin{aligned} F(t)= & \sum_{k=-\infty}^{k=+\infty} D_{n, k} \emptyset\left(2^{-n} t-k\right) +\sum_{k=-\infty}^{k=+\infty} \sum_{k=-\infty}^{k=+\infty} 2^{\frac{-j}{2}} A_{j, k} \psi\left(2^{-j} t-\right)\end{aligned}$ (3)
where, Aj,k and Dn,k are the approximate coefficients, $\psi$ is the scaling function, and n is the depth. EEG signal analysis involves descriptive coefficients at each phase and approximating coefficients at the final phase. We create feature vectors using the following signal:
Logarithmic band power (LBP)
$L B P=\log \left(\frac{1}{N} \sum_{n=1}^N|S(n)|^2\right)$ (4)
where, number of signal samples implies by N whereas S(n) is a discrete signal with n=1,2, 3....N.
Standard deviation (SD)
$S D=\sqrt{\frac{1}{N} \sum_{n=1}^N(S(n)-\mu)^2}$ (5)
Variance (VAR)
$\operatorname{Var}=\frac{1}{N} \sum_{n=1}^N(S(n)-\mu)^2$ (6)
Kurtosis (KUR)
$K U R=E\left[\left(\frac{S(n)-\mu}{\sigma_s}\right)^4\right]$ (7)
The predicted value shown by E[], We represent the Mean with µ, while σs denotes the standard deviation of the sample signal.
Average energy (AE)
$A E=\sum_{n=1}^N|S(n)|^2$ (8)
Root Mean Square (RMS)
$R M S=\sqrt{\sum_{n=1}^N|S(n)|^2}$ (9)
Further, to extract spatial patterns, the common spatial filtering is applied using the below equations:
$\begin{aligned} C_{P D} & =\frac{E_{P D} E_{P D^{\prime}}}{\operatorname{trace}\left(E_{P D} E_{P D^{\prime}}\right)} \\ C_{H C} & =\frac{E_{H C} E_{H C^{\prime}}}{\operatorname{trace}\left(E_{H C} E_{H C^{\prime}}\right)}\end{aligned}$ (10)
where, EPD EHC denote the EEG segments respectively.
2.3 Feature selection
In this work, features extracted by DWT are based on their linear correlation with the target variable, as defined by the Pearson correlation coefficient (PCC). Computing the Pearson correlation coefficient for each feature can help identify the most significant features with a strong linear link to the target.
$P(x, y)=\frac{\operatorname{Cov}(x, y)}{\sigma_x \sigma_y}$ (11)
$\operatorname{Cov}(x, y)$ indicates a covariance between x and y, whereas $\sigma_x$ and $\sigma_y$ are the corresponding standard deviations of x and y [28].
2.4 Classification model
A support vector machine (SVM) is a supervised machine learning model used for regression and classification. It finds the feature space hyperplane that most successfully separates classes [29]. The approach adopted in SVM is to find relevant patterns and differentiate non-epileptic and epileptic patients using EEG dataset recordings.
Decision DAG Classification Tree-DDAG tree has internal nodes that describe decision rules based on features, and leaf nodes indicate class labels. In their findings, Montanés et al. [30] suggested an outline of multiclass classification.
DAGSVM Classifier- DAGSVM is a machine-learning classifier for epilepsy diagnosis. It uses directed acyclic networks, which are ideal for making complex relations in EEG patterns. The process for detecting epileptic seizures described in this paper assembles binary classifiers in a directed acyclic graph and employs layered multiclass SVM and fuzzy-rule-based sub-band features. This method increases classification processing efficiency and high accuracy [31].
In contrast to existing multiclass SVM algorithms, this approach has more rapid testing and training times.
According to a power law $T={c m}^\gamma$, where m is the iteration count $\gamma \approx 2$ for decomposition-based algorithms, and c is a constant of proportionality. The training data generates all N classifiers using the conventional l-v-r multiclass SVM training technique.
Training for l-v-r takes,
$T_{\mathrm{l}-\mathrm{v}-\mathrm{r}}=c N m^\gamma$ (12)
If the classes are all the same size, the number of training examples needed to train each l-v-I SVM is merely 2m/N. Therefore, training in K l-v-I SVMs would be needed.
$T_{\mathrm{l}-\mathrm{v}-\mathrm{r}}=c \frac{N(N-1)}{2}\left(\frac{2 m}{N}\right)^\gamma \approx 2^{\gamma-1} c N^{2-\gamma} m^\gamma$ (13)
Training all 1-v-1 SVMs takes twice as long as training a solitary 1-v-r SVM, but this duration is independent of N. Therefore, we recommend a combination method for training one 1-v-1 SVM, where γ=2.
The paper proposes large-margin Directed Acyclic Graphs (DAGs) for multiclass classification. Their technique uses big-margin concepts to optimize classification accuracy while decreasing computational complexity by arranging SVM classifiers in a DAG framework [32].
Figure 2 represents the diagram of the three-layer classification decision DAG. The Decision DAG have internal and leaf nodes, each of which may belong to a distinct class. Until reaching a final diagnosis, the algorithm navigates through the Decision DAG, eliminating classifications along the way.
Figure 2. Decision DAG classification tree [30]
Figure 3 illustrates epilepsy diagnosis using Decision DAGs, and we provide the steps for this process.
Figure 3. Epilepsy diagnosis using decision DAGs
Execution of Epilepsy Diagnosis Using Decision DAG:
Decision DAGs are part of DAGSVM, which provides an improved representation of decision trees by allowing for the removal of unnecessary repetitions and redundancies between nodes. These are especially helpful for issues involving numerous classes, such as epilepsy diagnosis and generalizing the class of Decision Trees.
In Figure 4, the proposed methodology for EEG signal analysis and epilepsy disease diagnosis is shown.
Figure 4. Proposed methodology
2.5 Proposed algorithm for EEG signal analysis and epilepsy disease diagnosis
Start
Step 1: Read the Bern-Barcelona EEG dataset as input variable → X
Step 2: Preprocessing (sampling, Noise artifact removal, Bandpass elliptic filtering, segmentation) using DFT (Discrete Fourier Transform):
$X_{ {preprocessed }}=$ $preprocess$ $(X)$
Step 3: Feature extraction using DWT (Discrete Wavelet Transform):
$D W T_{ {features }}=$$Extract$ $D W T$ $features$ $\left(X_{ {preprocessed }}\right)$
Step 4: Feature selection using Pearson correlation coefficient (PCC):
When comparing two characteristics, x and y, the PCC is considered as follows:
$P(x, y)=\frac{\operatorname{Cov}(x, y)}{\sigma_x \sigma_y}$
Selectedfeatures=Select Features (DWTFeatures)
Step 5: Classification using ML models (SVM, LS-SVM, DAGSVM, KNN, RF):
Model=Train Model (Selectedfeatures)
Step 6: Test the model by classifying the test data as focal and non-focal EEG signals:
$Test \,data$ = $LoadTesData ()$
$Predictions$$=$ $Model.predict$$(Test$$_{ {data }})$
Step 7: Performance evaluation using (acc., press., recall, F-1 score):
Truelables=LoadTrueLables()
Metrics=Evaluate Model (Predictions, Truelables)
where,
X: Raw EEG signal dataset, $X_{ {preprocessed }}$: EEG data after preprocessing.
$D W T_{ {features }}$: Feature set obtained from Discrete Wavelet Transform.
$Selected _{ {features }}$: Feature set after feature selection.
Model: Trained ML model, ${Test}_{ {data }}$: Unseen test data for validation.
Predictions: Predicted labels (focal and non-focal) for the test data.
$True _{{labels }}$: True labels for the test data.
Metrics: Evaluation metrics, including accuracy, precision, specificity, and sensitivity
End
The proposed approach uses preprocessing, feature extraction, feature selection, and DAGSVM classification to enhance efficiency and address EEG data complexities. This novel method provides an accurate automated epilepsy diagnosis, which validates further real-time implementation and clinical validation for wider healthcare significance.
This section provides details about the dataset and the evaluation metrics we considered. We follow this with a result analysis, comparing the proposed model with other previously developed methods.
3.1 Evaluation metrics
In this analysis, we assessed the efficacy using the following performance evaluation metrics to gauge its effectiveness and accuracy:
Accuracy-Accuracy measures the performance of the classification network, expressed as follows:
$Accuracy$ $=\frac{T P+T N}{T P+F P+T N+F N}$ (14)
Precision-It refers to a performance metric that measures the accuracy of positive predictions as follows:
$Precision$ $=\frac{T P}{T P+F P}$ (15)
Specificity-Specificity measures the distinctions between the focal and non-focal regions of an epileptic seizure.
$Specificity$ $=\frac{T N}{T N+F P}$ (16)
Sensitivity-Sensitivity gauges how the network responds to EEG in focal areas and during seizures are as follows:
$Sensitivity$ $=\frac{T P}{T P+F N}$ (17)
Positive Prediction Rate (PPR)-Proportion of correctly predicted positive instances in EEG signal classification.
$P P R=\frac{T P}{T P+F P}$ (18)
Negative Prediction Rate (NPR)-NPR measures the rate of correct non-event predictions in EEG signal classification.
$N P R=\frac{T N}{T N+F N}$ (19)
TP classifies as a correct outcome, TN classifies as an incorrect outcome, FP negatively classifies as a proper outcome, and FN negatively classifies as an incorrect outcome.
3.2 Result analysis
Feature extraction is a crucial step in classifying EEG signals. The DWT coefficients of the x and y time series EEG signal pairs make the features. Subsequently, we use these features to train the machine learning classifier, creating training patterns during the classifier training phase. ML classifiers categorize the extracted features from test EEG data based on these patterns. When run in classification mode, ML classifiers provide a binary result, indicating either a low or high-value.
Test EEG signal is classified as focal EEG if the value is low and non-focal if it is high. Figure 5 illustrates the distinction between focal and non-focal EEG signals. Additionally, Figure 6 represents the 'x time series' of EEG signal pairs. And Figure 7 shows the 'y time series' respectively. These visualizations assist in understanding the EEG signal characteristics used in the classification process. Each signal, denoted by "x" and "y," included 10,240 samples recorded at 512Hz. These recordings offer valuable insights into epilepsy-related brain activity for research and analysis.
Figure 5. Comparison between focal with non-focal EEG signal
(a) Focal EEG signal
(b) Non-Focal EEG signal
Figure 6. "y" time series plot (a) Focal EEG signal, (b) Non-Focal EEG signal, depicting distinct patterns
(a) Focal EEG signal
(b) Non-Focal EEG signal
Figure 7. "x" time series plot (a) Focal EEG signal, (b) Non-Focal EEG signal, depicting distinct patterns
Table 1 outlines the system specifications used for the analysis, describing the platform, operating system, RAM capacity, and GPU model necessary for effectively performing the proposed methods.
Table 1. System specification
|
Application |
Specification |
|
Platform |
Google Colab |
|
System |
Windows 10 pro with 16GB RAM |
|
GPU |
GeForce RTX 4070Ti |
3.3 Comparative assessment
In this study, we estimate the DAGSVM classifier using accuracy, sensitivity, and specificity benchmarks and compare it with conventional machine learning classifiers.
By comparing the DAGSVM classifier's performance with traditional classifiers. The DAGSVM model performs better than conventional techniques when improved by DWT for feature extraction and standard spatial filtering for noise reduction. In multiclass classification problems, this combination yields more significant accuracy and resilience to noise.
This excellent performance of the DAGSVM machine learning classifier has meaningful implications for enhancing epilepsy diagnosis and patient cure.
This study presents a novel machine-learning approach for classifying EEG signals. The EEG data is preprocessed using Discrete Wavelet Transforms to extract time and frequency domain features. With a 99.71% accuracy, 99.71% precision, 99.43% sensitivity, 99.71% specificity, 99.71% positive predictive rate (PPR), and 99.42% negative predictive rate (NPR), the DAGSVM classifier achieves the most suitable results. It better classifies EEG signals from all the classifiers used in this study.
Figure 8 shows the discrimination of features at different DWT (Discrete Wavelet Transform) decomposition levels. It illustrates the distinct behaviors and significance of the feature values for EEG signal analysis throughout the wavelet decomposition stages.
Figure 8. Analysing feature discrimination across various DWT levels
In Table 2, P-values were determined and displayed to assess the discriminative features and their effectiveness. The fifth-level approximation sub-band signal's log energy entropy shows the lowest p-value, representing superior discriminative power among all features.
Table 3 contrasts the accuracy rates of several machine-learning methods that classify EEG signals. The sample EEG signals consisted of 350 focal and 350 non-focal signals. RF, KNN, SVM, LSSVM, and DAGSVM classified the signals as 342 focal and 345 non-focal, 347 focal and 345 non-focal, and 349 focal and 349 non-focal, respectively. RF obtains the lowest accuracy at 98.1%, while DAGSVM gets the best accuracy at 99.71%.
Figure 9 contrasts the accuracy rates of these models are as follows: DAGSVM (99.71%), KNN (98.80%), LSSVM (99.40%), RF (98.1%), and SVM (98.8%).
Table 2. Analysing feature discrimination across various DWT levels
|
Features |
Level Two |
Level Three |
Level Four |
Level Five |
|
Variance |
5.265×10⁻⁴ |
8.415×10⁻⁸ |
2.575×10⁻⁷ |
8.548×10⁻⁷ |
|
Average Energy |
2.332×10⁻⁶ |
8.760×10⁻⁵ |
6.565×10⁻⁵ |
1.092×10⁻⁵ |
|
LBP |
1.336×10⁻⁷ |
2.090×10⁻² |
3.379×10⁻¹ |
7.000×10⁻⁴ |
|
Shannon Entropy |
2.890×10⁻² |
1.901×10⁻⁶ |
1.638×10⁻¹ |
2.690×10⁻² |
|
Log Energy Entropy |
2.510×10⁻² |
5.766×10⁻¹ |
1.026×10⁻⁷ |
3.254×10⁻¹⁰ |
Table 3. Machine learning models for EEG signal classification
|
Machine Learning Model |
EEG Signals |
Accuracy (%) |
|
|
|
Focal (350) |
Non-focal (350) |
|
|
RF |
342 |
345 |
98.1 |
|
KNN |
347 |
345 |
98.8 |
|
SVM |
348 |
344 |
98.8 |
|
LSSVM |
347 |
349 |
99.4 |
|
DAGSVM |
349 |
349 |
99.71 |
Figure 9. Machine learning models for EEG signal classification
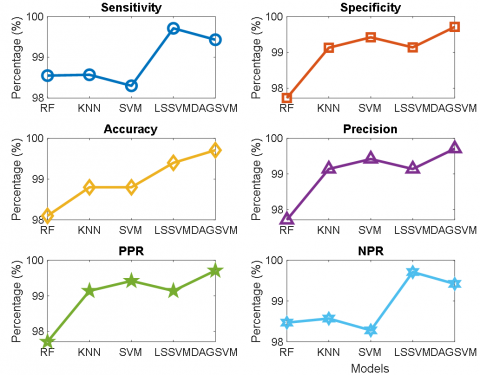
Table 4 compares the performance of several machine-learning techniques for classifying EEG signals. It also displays PPR, NPR, accuracy, sensitivity, specificity, and precision. Table 4 illustrates that the DGSVM classifier attains the maximum sensitivity (99.43), specificity (99.71), precision (99.71), PPR (99.71), and NPR (99.42) among all the ML classifiers.
Table 5 compares the DAGSVM model with conventional techniques, presenting accuracy, sensitivity, and specificity values for SVM, Bidirectional LSTM, and Random Forest classifiers from different references.
Table 4. Machine learning models for performance analysis
|
ML Model |
Sensitivity % |
Specificity % |
Accuracy % |
Precision % |
PPR % |
NPR % |
|
RF |
98.55 |
97.73 |
98.1 |
97.71 |
97.71 |
98.47 |
|
KNN |
98.57 |
99.13 |
98.8 |
99.14 |
99.14 |
98.57 |
|
SVM |
98.30 |
99.42 |
98.8 |
99.42 |
99.42 |
98.28 |
|
LSSVM |
99.71 |
99.14 |
99.4 |
99.14 |
99.14 |
99.71 |
|
DAGSVM |
99.43 |
99.71 |
99.71 |
99.71 |
99.71 |
99.42 |
Table 5. DAGSVM model comparison with various traditional methods
|
Reference |
Classifier |
Accuracy |
Sensitivity |
Specificity |
|
[17] |
SVM |
99% |
98.68% |
99.32% |
|
[19] |
Bidirectional LSTM |
99.6% |
99.55% |
99.65% |
|
[25] |
RF |
99.4% |
99.7% |
99.65% |
|
[21] |
DCNN-WTSST |
99.70% |
99.5% |
99.70% |
|
[22] |
WCNN |
99.70% |
99.79% |
99.65% |
|
[23] |
KWS-VIKOR |
98.70% |
98.8% |
98.4% |
|
Current Study |
DAGSVM |
99.71% |
99.43% |
99.71% |
Figure 10. Machine learning models for performance analysis
Figure 11. Performance metrics for different models
Figures 10 and 11 visually display the assessment of machine learning models using performance metrics such as accuracy, sensitivity, specificity, precision, positive predictive rate (PPR), and negative predictive rate (NPR).
There was no specific grant from any governmental, commercial, or nonprofit funding agency for this research. Furthermore, Dr. Anil Kumar, a medical imaging specialist and senior radiologist from the Vidhya Imaging Centre in Gwalior, Madhya Pradesh, India, provided partial help for the analysis measure.
|
CP |
Common Spatial Patterns |
|
g |
Gamma (used in power law for training times of SVM algorithms, specifically in the DAGSVM context) |
|
N |
Number of signal samples or classifiers |
|
m |
Iteration count or number of training examples |
|
T |
Training time |
|
SD |
Standard Deviation |
|
Var |
Variance |
|
KUR |
Kurtosis |
|
AE |
Average Energy |
|
RMS |
Root Mean Square |
|
TP |
True Positives |
|
TN |
True Negatives |
|
FP |
False Positives |
|
FN |
False Negatives |
|
Greek symbols |
|
|
ψ (Psi) |
Mother function in Discrete Wavelet Transform (DWT) |
|
µ (Mu) |
Mean of signal samples |
|
σ (Sigma) |
Standard deviation of signal samples |
|
γ (Gamma) |
Used in the power law for SVM training times |
|
E |
Expected value (used in the context of kurtosis calculation) |
[1] Alharthi, M.K., Moria, K.M., Alghazzawi, D.M., Tayeb, H.O. (2022). Epileptic disorder detection of seizures using EEG signals. Sensors, 22(17): 6592. https://doi.org/10.3390/s22176592
[2] Vandana, J., Nirali, N. (2021). A review of EEG signal analysis for diagnosis of neurological disorders using machine learning. Journal of Biomedical Photonics & Engineering, 7(4): 40201. https://doi.org/10.18287/JBPE21.07.040201
[3] Alturki, F.A., AlSharabi, K., Abdurraqeeb, A.M., Aljalal, M. (2020). EEG signal analysis for diagnosing neurological disorders using discrete wavelet transform and intelligent techniques. Sensors, 20(9): 2505. https://doi.org/10.3390/s20092505
[4] Alkawadri, R. (2019). Brain-computer interface (BCI) applications in mapping of epileptic brain networks based on intracranial-EEG: An update. Frontiers in Neuroscience, 13: 191. https://doi.org/10.3389/fnins.2019.00191
[5] Abiri, R., Borhani, S., Sellers, E.W., Jiang, Y., Zhao, X. (2019). A comprehensive review of EEG-based brain–computer interface paradigms. Journal of Neural Engineering, 16(1): 011001. https://doi.org/10.1088/1741-2552/aaf12e
[6] Bera, T.K. (2021). A review on the medical applications of electroencephalography (EEG). In 2021 Seventh International Conference on Bio Signals, Images, and Instrumentation (ICBSII), Chennai, India, pp. 1-6. https://doi.org/10.1109/ICBSII51839.2021.9445153
[7] Gao, Y., Gao, B., Chen, Q., Liu, J., Zhang, Y. (2020). Deep convolutional neural network-based epileptic electroencephalogram (EEG) signal classification. Frontiers in Neurology, 11: 375. https://doi.org/10.3389/fneur.2020.00375
[8] Xu, G., Shen, X., Chen, S., Zong, Y., Zhang, C., Yue, H., Liu, M., Chen, F., Che, W. (2019). A deep transfer convolutional neural network framework for EEG signal classification. IEEE Access, 7: 112767-112776. https://doi.org/10.1109/ACCESS.2019.2930958
[9] Jaya, A.I., Soemarno, G., Puspita, J.W. (2018). Classification of epileptiform waves based on frequency by using backpropagation neural network. In Journal of Physics: Conference Series. IOP Publishing, 1028(1): 012048. https://doi.org/10.1088/1742-6596/1028/1/012048
[10] Subathra, M.S.P., Mohammed, M.A., Maashi, M.S., Garcia-Zapirain, B., Sairamya, N.J., George, S.T. (2020). Detection of focal and non-focal electroencephalogram signals using fast Walsh-Hadamard transform and artificial neural network. Sensors, 20(17): 4952. https://doi.org/10.3390/s20174952
[11] Choubey, H., Pandey, A. (2019). A new feature extraction and classification mechanisms for EEG signal processing. Multidim Syst Sign Process, 30: 1793-1809. https://doi.org/10.1007/s11045-018-0628-7
[12] Miltiadous, A., Tzimourta, K.D., Giannakeas, N., Tsipouras, M.G., Glavas, E., Kalafatakis, K., Tzallas, A.T. (2022). Machine learning algorithms for epilepsy detection based on published EEG databases: A systematic review. IEEE Access, 11: 564-594. https://doi.org/10.1109/ACCESS.2022.3232563
[13] Molla, M.K.I., Hassan, K.M., Islam, M.R., Tanaka, T. (2020). Graph eigen decomposition-based feature-selection method for epileptic seizure detection using electroencephalography. Sensors, 20(16): 4639. https://doi.org/10.3390/s20164639
[14] Al-Jumaili, S., Duru, A.D., Ibrahim, A.A., Uçan, O.N. (2022). Classification of brain tumours using MRI images based on convolution neural network and supervised machine learning algorithms. In International Symposium on Multidisciplinary Studies and Innovative Technologies, Ankara, Turkey, pp. 822-827. https://doi.org/10.1109/ISMSIT56059.2022.9932690
[15] Alturki, F.A., AlSharabi, K., Aljalal, M., Abdurraqeeb, A.M. (2019). A DWT-band power-SVM based architecture for neurological brain disorders diagnosis using EEG signals. In 2019 2nd International Conference on Computer Applications & Information Security (ICCAIS), Riyadh, Saudi Arabia, pp. 1-4. https://doi.org/10.1109/CAIS.2019.8769492
[16] Abdolzadegan, D., Moattar, M.H., Ghoshuni, M. (2020). A robust method for early diagnosis of autism spectrum disorder from EEG signals based on feature selection and DBSCAN method. Biocybernetics and Biomedical Engineering, 40(1): 482-493. https://doi.org/10.1016/j.bbe.2020.01.008
[17] de Filippis, R., Carbone, E.A., Gaetano, R., Bruni, A., Pugliese, V., Segura-Garcia, C., De Fazio, P. (2019). Machine learning techniques in a structural and functional MRI diagnostic approach in schizophrenia: A systematic review. Neuropsychiatric Disease and Treatment, 1605-1627. http://doi.org/10.2147/NDT.S202418
[18] Sharma, R., Sircar, P., Pachori, R.B. (2020). Automated focal EEG signal detection based on third order cumulant function. Biomedical Signal Processing and Control, 58: 101856. https://doi.org/10.1016/j.bspc.2020.101856
[19] Fraiwan, L., Alkhodari, M. (2020). Classification of focal and non-focal epileptic patients using single channel EEG and long short-term memory learning system. IEEE Access, 8: 77255-77262. https://doi.org/10.1109/ACCESS.2020.2989442
[20] Srinath, R., Gayathri, R. (2021). Detection and classification of electroencephalogram signals for epilepsy disease using machine learning methods. International Journal of Imaging Systems and Technology, 31(2): 729-740. https://doi.org/10.1002/ima.22486
[21] Saminu, S., Xu, G., Shuai, Z., Kader, I.A.E., Jabire, A.H., Ahmed, Y.K., Karaye, I.A., Ahmad, I.S. (2022). Application of deep learning and WT-SST in localization of epileptogenic zone using epileptic EEG signals. Applied Sciences, 12(10): 4879. https://doi.org/10.3390/app12104879
[22] Xin, Q., Hu, S., Liu, S., Zhao, L., Zhang, Y.D. (2022). An attention-based wavelet convolution neural network for epilepsy EEG classification. IEEE Transactions on Neural Systems and Rehabilitation Engineering, 30: 957-966. https://doi.org/10.1109/TNSRE.2022.3166181
[23] Anuragi, A., Sisodia, D.S., Pachori, R.B. (2023). Classification of focal and non-focal EEG signals using optimal geometrical features derived from a second-order difference plot of FBSE-EWT rhythms. Artificial Intelligence in Medicine, 139: 102542. https://doi.org/10.1016/j.artmed.2023.102542
[24] Andrzejak, R.G., Lehnertz, K., Mormann, F., Rieke, C., David, P., Elger, C.E. (2001). Indications of nonlinear deterministic and finite-dimensional structures in time series of brain electrical activity: Dependence on recording region and brain state. Physical Review E, 64(6): 061907. https://doi.org/10.1103/PhysRevE.64.061907
[25] Universitat Pompeu Fabra. Nonrandomness, Nonlinear Dependence, and Nonstationarity of Electroencephalographic Recordings from Epilepsy Patients. https://www.upf.edu/web/ntsa/downloads/-/asset_publisher/xvT6E4pczrBw/content/2012-nonrandomness-nonlinear-dependence-and-nonstationarity-of-electroencephalographic-recordings-from-epilepsy-patients.
[26] Saday, A., Ozkan, I.A. (2021). Classification of epileptic EEG signals using DWT-based feature extraction and machine learning methods. International Journal of Applied Mathematics Electronics and Computers, 9(4): 122-129. https://doi.org/10.18100/ijamec.988691
[27] Albaqami, H., Hassan, G.M., Subasi, A., Datta, A. (2021). Automatic detection of abnormal EEG signals using wavelet feature extraction and gradient boosting decision tree. Biomedical Signal Processing and Control, 70: 102957. https://doi.org/10.1016/j.bspc.2021.102957
[28] Saidi, R., Bouaguel, W., Essoussi, N. (2019). Hybrid feature selection method based on the genetic algorithm and pearson correlation coefficient. Machine Learning Paradigms: Theory and Application, Springer, Cham, 3-24. https://doi.org/10.1007/978-3-030-02357-7_1
[29] Tomar, A.S., Jayaswal, P. (2024). Rolling element bearing fault investigation based on translation invariant wavelet means denoising and empirical mode decomposition (EMD). Journal of The Institution of Engineers (India): Series C, 105: 127-140. https://doi.org/10.1007/s40032-023-01016-w
[30] Montanés, E., Barranquero, J., Díez, J., Del Coz, J.J. (2013). Enhancing directed binary trees for multi-class classification. Information Sciences, 223: 42-55. https://doi.org/10.1016/j.ins.2012.10.011
[31] Platt, J., Cristianini, N., Shawe-Taylor, J. (1999). Large margin DAGs for multiclass classification. Advances in Neural Information Processing Systems, 12.
[32] Hu, S., Zheng, J., Huang, L. (2020). Gait phase detection of exoskeleton robot based on optimized DAG-SVM. In Proceedings of the 4th International Conference on Computer Science and Application Engineering, pp. 1-6. https://doi.org/10.1145/3424978.3425081