Aditya Dubey*![]() | Pradeep Yadav
| Pradeep Yadav![]() | Subhash Chandra Patel
| Subhash Chandra Patel![]() | Chandra Prakash Bhargava
| Chandra Prakash Bhargava![]() | Archana Tomar
| Archana Tomar![]()
© 2024 The authors. This article is published by IIETA and is licensed under the CC BY 4.0 license (http://creativecommons.org/licenses/by/4.0/).
OPEN ACCESS
Among the most prevalent diseases affecting people and a major factor in the rising mortality rate is lung cancer. Using a lung nodule as an example, medical professionals consider that early identification of lung cancer utilizing computed tomography (CT) testing can minimize mortality. Considering the enormous number of CT scans might lessen the risk. Still, the CT scan images contain an enormous amount of data regarding nodules, and as an outcome of the increasing number of images, radiologists have a very difficult time accurately assessing them. Traditional diagnostic techniques, including chest X-rays, and positron emission tomography (PET) scans, provide essential visualization of lung abnormalities but are often constrained by factors such as radiation exposure, cost, and the risk of false positives and negatives. Recently, a number of approaches had been proposed based on handicraft to help radiologists. For giving a thorough analysis of various techniques, we analyzed numerous potential methods created in the Computer-Aided Design (CAD) system to identify and categorize the nodule with the analysis of CT images. The review addresses the challenges faced in lung cancer diagnosis, such as the high variability in tumor appearance and the need for large, annotated datasets for training robust models. Additionally, we discuss the potential of CAD systems in clinical practice and their impact on patient outcomes.
lung cancer, sputum test, CAD, multimodal CAD systems, 2D-CNN, F1 score, confusion matrix
Lung cancer came in as the third-leading cause of death for women and leading cause of dying for men according to the World Cancer Observatory database created by the IARC. Nearly 1.8 million deaths from lung cancer were recorded in 2018, accounting for about 18.4% of all cancer-related deaths [1]. Because of the concerning increase in deaths from lung cancer and the disease's excessively high incidence in nature, several cancer control researches and early detection techniques have been developed to reduce mortality. Efficient diagnostic techniques lead to lower incidence rates for lung cancers, and early disease discovery is typically necessary for lung cancer recovery.
Currently, seven methods can be used to treat lung cancer, including breath analysis, cytology sputum, positron emission tomography (PET), magnetic resonance imaging (MRI), computed tomography (CT) scans, and chest radiographies (CXRs) [2]. As indicated in Table 1, each of the lung cancer identification strategies now in use has a range of markers and distinct detection level. The CT, septum, and CXR are radiation-prone, and PET and MRI have limits in the identification and staging of lung cancer. These techniques also have certain drawbacks. Additionally, serum constitutes an invasive procedure, and its low level of early detection specificity and sensitivity makes it unacceptable. On the other hand, because of gene promoter methylation, sputum still required further testing but had the ability to identify lung cancer at an early stage [3]. Additionally, VOC in urine had a high level of specificity and sensitivity but needed a larger sample size [3], while CXR possesses a low level of sensitivity and frequently produces false-negative results [4, 5]. The most reliable method for finding lung cancer recently is CT imaging, which provides precise information on the positions and sizes of nodules. Early-stage cancer tumors were found by the low-dose CT testing. In comparison to conventional radiography methods, it led to a 20.0% reduction in mortality and a considerable rise in the rate of positive screening tests [6].
Table 1. Techniques for early identification of lung cancer
|
Techniques |
Markers |
Level of Detection |
|
Sputum test |
Methylated gene promoters and abnormal cells |
Molecule or Cell level |
|
Serum test |
Circulation of telomerase, plasma proteins, circulating DNA, tumor cells, etc. |
Molecule or Cell level |
|
PET |
Neoplastic tissue |
Tissue level |
|
Urine test |
Urine volatile odorants |
Molecule level |
|
CXR |
Neoplastic tissue |
Tissue level |
|
CTs |
Neoplastic tissue |
Tissue level |
|
Breath examination |
Non-Volatile and Volatile-organic compounds |
Molecular level |
While the nodule is tiny and isolated, the condition of lung cancer may be identified. The lung nodules often have a diameter of 3 mm. Radiologists divided nodules into benign and malignant categories based on CT scans. By cutting into a variety of 2D sections, the 3D-lung voxels must be carefully examined. The evaluation needs to be highly precise in order to classify nodules as benign or malignant because of the CTs' extensive inclusion of information. Radiologists generally find it challenging to examine 3D lung voxels slice through slice from 2D CTs since a CT scan offers an enormous quantity of details concerning lung nodules and made it challenging to interpret and identify cells derived from CT images. Human error has a significant negative impact on lung nodule identification. Therefore, employing CAD systems as radiologists' support for the precise classification and identification of malignancies, the diagnosis of lung cancer has been simplified. It has been proved that this strategy is effective for helping radiologists. In this research, this paper presents many CAD systems for classification and detection that have been recently created. The major goal of this paper is to compile important information from many prominent the most advanced Convolutional Neural Network (CNN) architectures in table style and conduct a comparison of all CNN on various criteria. This paper also highlights several critical elements that are important for researchers to remember while recognizing and classifying lung nodules, as well as the recently created models that are employed in these procedures. The paper is discussed as per the following sections:
A description of the CAD technology is presented in Section II. It entails an analysis of two different CAD systems: a learnt CAD system and a handcrafted based CAD approach. The third section focuses on several cutting-edge CNN architectures, which are the fundamental building blocks of the CAD approach. In a tabular style, this paper highlight and analyze several CNN architectures like as GoogLeNET, VGGNet, AlexNet, LeNet, etc. This paper also provides a few other newly created models. In section IV, this paper intends to summarize newly researched CNN-based CAD techniques for lung nodule identification and classification, along with their outcomes. Section V serves as the review's conclusion.
Addressing of the following research gaps in the existing research would not only advance the understanding of lung cancer classification and detection but also facilitate the developing of more accurate, robust, and clinically relevant diagnostic tools for improving patient care.
Incorporation of clinical context and prior knowledge: There may be a lack of emphasis on incorporating clinical context and prior knowledge into the classification and detection algorithms. Leveraging domain expertise and integrating relevant clinical variables (e.g., patient demographics, smoking history, comorbidities) could improve the accuracy and interpretability of the models.
Longitudinal data analysis and prognostic prediction: Many existing studies may focus on binary classification tasks (e.g., distinguishing between benign and malignant tumors), overlooking the potential for longitudinal data analysis and prognostic prediction. Investigating how lung cancer evolves over time and predicting patient outcomes could provide valuable insights for personalized treatment planning and monitoring.
Explainability and interpretability of models: The interpretability and explainability of machine learning based models used for lung cancer detection and classification may be insufficiently addressed in the literature. Understanding how these models make predictions is crucial for gaining insights into disease mechanisms and fostering trust among clinicians and patients.
Limited validation on external datasets: Many studies may validate their proposed classification algorithms on a limited set of datasets, often collected from the same institutions or research groups. However, there may be a lack of validation on external, independent datasets, which is essential for getting the generalizability and robustness of the proposed methods across different populations and imaging platforms.
Clinical translation and implementation challenges: While numerous classification algorithms may demonstrate promising performance in research settings, there may be limited discussion on the practical challenges associated with translating these algorithms into clinical practice. These challenges may include issues related to regulatory approval, integration with existing healthcare systems, and clinician acceptance.
Data imbalance and diversity: The literature may not adequately address issues related to data imbalance and diversity in lung cancer datasets. Addressing these challenges is crucial for developing robust classification models that generalize well across different patient demographics, disease subtypes, and imaging protocols.
Limited focus on specific modalities: Many existing studies may focus predominantly on a single imaging modality, for example, CT scans or X-rays, for lung cancer detection and classification. However, there may be limited research exploring the integration of multiple modalities (e.g., combining imaging with genomics or proteomics data) to enhance diagnostic accuracy and reliability.
Long-term monitoring and surveillance strategies: Research might not sufficiently address long-term monitoring and surveillance planning for individuals at high risk of developing lung cancer or those who have undergone treatment. Developing effective surveillance protocols could improve early detection of recurrence and enhance patient outcomes.
Need for comparative studies across different approaches: While individual studies may propose novel lung cancer detection methods, there could be a gap in comparative evaluations across different approaches. Comparative studies could provide insights into the strengths and limitations of various techniques and assist in choosing the best approach for particular clinical situations.
Integration of biomarkers with imaging data: While some research may focus on imaging-based approaches for lung cancer detection, there could be a gap in integrating biomarkers, such as genetic or protein markers, with imaging data. Combining multiple types of data could enhance the reliability and accuracy of detection methods.
Insufficient exploration of machine learning interpretability: While machine learning algorithms may achieve high accuracy in lung cancer detection, there could be a gap in understanding how these algorithms arrive at their predictions. Exploring methods for interpreting and explaining machine learning models could enhance trust and facilitate clinical adoption.
Limited attention to non-imaging modalities: The literature might predominantly concentrate on imaging modalities like CT scans or X-rays for lung cancer detection, overlooking other potentially valuable approaches. Research could explore the use of non-imaging modalities such as breath analysis, liquid biopsy, or electronic health records for early detection.
Scarcity of studies on implementation challenges: There might be limited research on the real-world implementation challenges of lung cancer detection methods. Investigating barriers to adoption, such as cost-effectiveness, workflow integration, and clinician acceptance, could inform strategies for successful deployment in clinical practice.
Inadequate representation of understudied populations: The literature might not adequately represent certain demographic groups, such as individuals from diverse racial or ethnic backgrounds, or those with specific risk factors. Understanding how lung cancer manifests in these populations could lead to more tailored detection strategies and improve equity in healthcare.
Limited exploration of early detection methods: There might be a lack of focus on early detection methods for lung cancer, which could significantly improve patient outcomes. Research could explore innovative approaches for detecting lung cancer at its earliest stages when treatment options are more effective.
Addressing these research gaps could lead to advancements in lung cancer detection methods, ultimately contributing to earlier diagnosis, improved treatment outcomes, and better patient care.
For the purposes of classification and detection, some CADs employed learnt features while other of them used manually created features. Traditional CAD systems employed handmade features, but presently, CNN-based CAD is utilized to support radiologists because to CNN's capacity to learn through data. Below, this paper go into extensive detail on both traditional and CNN-based CAD systems. CAD systems play a vital role in assisting radiologists and clinicians in detecting abnormalities, including lung cancer, in medical imaging data. These systems utilize various algorithms and techniques to highlight potential areas of concern, improving efficiency and accuracy in diagnosis. Table 2 shows a comparison of different CAD systems, along with their latest advancements up to the current year. The latest advancements aim to improve detection accuracy, efficiency, interpretability, and clinical relevance, ultimately contributing to better patient outcomes in the diagnosis of lung cancer.
Table 2. A range of CAD system
|
CAD System |
Description |
Advantages |
Limitations |
Advancements |
|
Traditional Rule-Based CAD Systems |
Traditional CAD systems are rule-based and rely on predefined criteria or thresholds to identify suspicious regions in medical images. They typically involve preprocessing steps like segmentation and feature extraction, followed by classification. |
Relatively simple and interpretable, with established methodologies. |
Limited adaptability to complex and heterogeneous data. Performance highly dependent on the quality of predefined rules. |
While traditional rule-based CAD systems are still used, their advancements mostly involve improvements in segmentation and feature extraction techniques to enhance performance. |
|
CAD Systems with Explainable AI |
CAD systems incorporating explainable artificial intelligence (XAI) techniques aim to provide insights into the decision-making process of complex models, enhancing their interpretability and trustworthiness. |
Improved transparency and interpretability, facilitating better understanding and acceptance by clinicians. |
Trade-offs between model complexity and interpretability. Potential performance degradation compared to black-box models. |
Recent advancements involve the development of XAI methods tailored for deep learning architectures, such as attention mechanisms and saliency maps, which highlight important features contributing to model predictions. |
|
Real-Time CAD Systems |
Real-time CAD systems provide immediate feedback to radiologists during image interpretation, enabling rapid decision-making. |
Accelerated diagnosis workflow, leading to faster patient management and reduced turnaround time. |
High computational requirements for real-time processing. Potential for increased false positives due to time constraints. |
Recent advancements involve optimizations for parallel processing and hardware acceleration, as well as the integration of cloud-based computing resources to handle the computational demands of real-time CAD systems. |
|
CAD Systems for Early Detection |
CAD systems designed specifically for early detection focus on identifying subtle or early signs of disease before they are clinically apparent. |
Potential to improve patient outcomes by facilitating early intervention and treatment. |
Limited availability of annotated early-stage datasets. Challenges in distinguishing true positives from benign abnormalities. |
Recent advancements include the exploration of novel biomarkers and imaging features associated with early-stage disease, as well as the development of advanced machine learning algorithms tailored for detecting subtle abnormalities. |
|
Multimodal CAD Systems |
Multimodal CAD systems integrate information from multiple imaging modalities (such as, PET, MRI, CT) or combine imaging data with non-imaging data (e.g., genomics, proteomics) to improve detection accuracy and reliability. |
Enhanced diagnostic capabilities by leveraging complementary information from different sources. |
Integration and fusion of heterogeneous data sources can be challenging. Increased computational complexity. |
Recent advancements involve the development of sophisticated fusion techniques, such as deep learning-based multimodal fusion networks, to effectively combine information from diverse sources for improved detection performance. |
|
Machine Learning-Based CAD Systems |
Machine learning-based CAD systems leverage algorithms like random forests, SVM, or deep learning neural networks for learning patterns directly from data without explicit rule definitions. |
Greater adaptability to diverse data types and improved performance through learning from examples. |
Require large annotated datasets for training. Deep learning models may lack interpretability. |
Recent advancements include the usage of deep learning architectures such as CNN, that have demonstrated superior performance in image classification tasks. Techniques like data augmentation and transfer learning have also been employed to address data scarcity issues. |
3.1 CAD system based on handcrafts
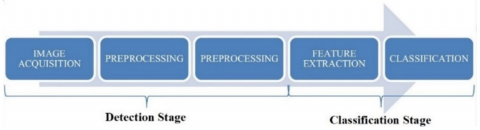
These methods utilized a variety of innovative methods to extract features from the data, such as the Local Binary Patterns (LBP) [6-9]. Some other techniques for extracting feature are Speeded-Up Robust Features (SURF) [10], Gray-Level Co-occurrence Matrix (GLCM) [8, 9, 11-13], Histogram of Oriented Gradients (HOG) [6, 7, 11], etc. Image capture, preprocessing, nodule identification, feature extraction, and classification are the five processes that make up the fundamental architecture of traditional CAD systems, which is depicted in Figure 1. Recently suggested CAD system implementations had handcrafted features [6-14]. The HOG descriptor was used by Dhara et al. [11] and Shen et al. [6, 7] to divide the nodule patches into blocks then to create histograms. Dhara et al. used GLCM, emphasizing texture-based procedure of extraction, calculating Haralick features, and removing duplicate features from images [11]. examining the connections between the core pixel and each neighboring pixel, Shen et al. used LBP feature extractor [6, 7]. For extracting texture data, Li et al. utilized the convergence index filter and stationary wavelet transform techniques [14]. The accuracy of the CAD method was enhanced by Boroczky et al. [15] using the genetic algorithm, for selecting feature among a set of features. since the number of CT scans grows rapidly over time, selecting features from the feature space is a challenging process.
Figure 1. Procedure of CAD
3.2 CAD systems based on CNN
The effectiveness of deep learning, particularly that of CNN, led to the development of the CAD system, which depends on the data-driven CNN approach. CAD systems based on CNN, as seen in Figure 2, place a focus on automated feature learning using CNN. In-depth features from images may be extracted using sophisticated standard CNNs, such as dual path networks (DPN), region proposal networks (RPN), etc., which further improves the efficiency of the CAD system as a whole. They have demonstrated astonishingly exceptional performance in the realm of medicine to identify diseases including lung cancer, breast, prostate, and brain and to more successfully treat patients. A CAD method based on a lightweight multiview CNN for lung nodule malignancy and classification estimate, for instance, was presented by Sahu et al. [16]. several more CNN-based CAD methods was suggested by Nasrullah et al. [17], Masood et al. [18], etc. and shown a notable improvement in the identification of nodules. in this research, this paper reviewed various CAD systems utilized in the classification and identification of lung cancer.
Figure 2. Architecture of CNN model
4.1 CNN
The majority of CNNs are created using the fundamental layers presented in Figure 2. The designs often have several FC layers, max-pooling layers, convolutional layers, and then SoftMax layers or output layers as the last layers. VGGNet [19], AlexNet [20], and LeNet [21] are a few implementations of CNN models. The Densely Connected Convolutional Network (DenseNet) [22], Residual Networks (ResNet) [23], and GoogLeNet with Inception units [24] are three further, more effective advanced designs that have been developed. These designs share a lot of the same basic elements, such as pooling and convolution. On the other hand, considering connections, computing complexity, and operations carried out in various levels, certain variances are seen in these systems. due to their progressive effectiveness, DenseNet [22], GoogLeNet [24], VGGNet [19], and AlexNet [20] are typically regarded as the most prevalent designs. In contrast to the VGG network, which is viewed as a generic architecture, ResNet and GoogleNet are specifically created for the processing of vast amounts of data. In terms of connection, a few of the designs, like DenseNet [22], are dense. All of the main details pertaining to these advanced architectures are listed in Table 3. According to multiply and accumulates (MACs), the total number of weights, the number of FC layers, input size, and error rates, Table 4 compares several CNN models.
Table 3. CNN architectures analysis
|
Parameters |
DenseNet [24] |
ResNet-50 [23] |
GoogLeNet [22] |
VGG-16 [21] |
ZFNet [25] |
AlexNet [20] |
LeNet-5 [19] |
|
No. of FC layers |
n/a |
1 |
1 |
3 |
3 |
3 |
2 |
|
Activation function |
ReLU |
ReLU |
ReLU |
ReLU |
ReLU |
ReLU |
Tanh |
|
Stride |
2 |
1, 2 |
1, 2 |
1 |
2 |
2, 4 |
1, 2 |
|
Size of filter |
[1×1], [3×3], [7×7] |
[1×1], [3×3], [7×7] |
[1×1], [3×3], [5×5], [7×7] |
[7×7], [3×3] |
[7×7], [3×3] |
[11×11], [5×5], [3×3] |
[5×5], [2×2] |
|
Convolution layers |
n/a |
50 |
21 |
16 |
5 |
5 |
2 |
|
Input size |
224 × 224 |
224 × 224 |
224 × 224 |
224 × 224 |
224 × 224 |
256 × 256 |
28 × 28 |
|
Top 5 error rate |
5.17 |
3.6 |
6.7 |
7.3 |
14.8 |
15.3 |
n/a |
|
Total weights |
15 M |
25.5 M |
7 M |
138 M |
n/a |
61 M |
432 K |
|
Total MACs |
2.1G |
3.9G |
1.43G |
15.5G |
n/a |
724 M |
2.3 M |
Table 4. Research on CNN architectures
|
CNN Architecture |
Reference |
Key Points |
|
DenseNet |
Huang et al. [22] |
It includes 264, 201, 169, and 121 layers and is made up of tightly linked CNN layers with It includes 264, 201, 169, and 121 layers and is made up of tightly linked CNN layers with L (L + 1)/2 interconnections. The framework includes dense blocks comprising batch normalization (BN), ReLU after which convolution is conducted, and a transition layer comprising BN-assisted convolutional operations after which an average pooling layer is applied. DenseNet works efficiently whenever there is a lack of training data and is simple to train because of its dense connections. It includes 264, 201, 169, and 121 layers and is made up of tightly linked CNN layers with L (L + 1)/2 interconnections. |
|
ResNeXt |
Xie et al. [26] |
The number of paths or ResNet with cardinality is a different acronym for it. A network identified as the multi branch has 3 convolutions of the following types: Conv 1×1, Conv 3×3, and Conv 1×1. It had a top-5 error percentage of 3.03%. |
|
ResNet |
He et al. [23] |
A deep residual network was implemented. It enables 1202, 152, 101, 50, and 34 layers, among many more layer counts. There were 1201, 151, 100, 49, and 33 convolution layers in ResNet-1202, 152, 101, 50, and 34 respectively, as well as 1 FC layer. It managed to deal with vanishing gradient issues with an error percentage that went up to 3.57%. |
|
VGGNet |
Simonyan et al. [19] |
With three distinct convolution layer architectures have been used. There were 16 layers in VGG-19, 13 layers in VGG-16, and 8 layers in VGG-11. A single max-pooling layer, three completely linked layers, and a Softmax layer for classification make up the following layers. The advantages of VGGNet include fewer parameters, quicker convergence, and less overfitting issues. It also achieves an error percentage that is up to 7.3%. |
|
GoogLeNet |
Szegedy et al. [24] |
22 layers thick ConvNet, which integrates the inception unit, aims to make computations less difficult than in the case of conventional CNN architecture. A decrease in network parameters and an error percentage that was up to 6.67% were obtained by using a stack of Inception layers. |
|
ZFNet |
Matthew Zeiler and Rob [25] |
An enhancement to AlexNet is the ZFNet model. It lowered the error ratio on ImageNet by up to 14.8% by using the deconvolution network for feature visualization. |
|
AlexNet |
Krizhevsky et al. [20] |
It has eight levels and is deeper than LeNet-5. For classifying, a soft-max layer for is added after two FC layers, two convolution layers with Local Response Normalization (LRN), three convolution layers for feature mapping with activation function of ReLU, and two convolution layers including LRN. On the ImageNet benchmark, this framework obtained a decreased error percentage of up to 15.3%. |
|
LeNet |
LeCun et al. [21] |
The convolution network with 7 levels was employed in this architecture. Two of those are FC layers, two are sub-sampling layers, two are convolution layers, and then there is an output layer corresponding to the backpropagation concept using Tanh to be the activation function. |
4.2 CNN for 3D objects
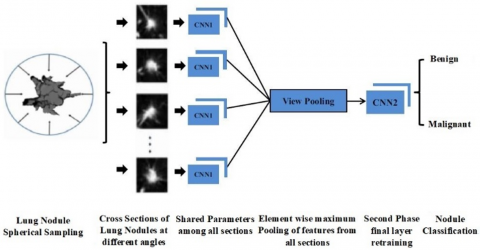
4.2.1 Multiview CNN (MVCNN)
This variation of CNN also gets referred to as 2-dimensional CNN (2D-CNN). Representing 3D structures, such as voxel grids or polygon meshes, for identification from a series of generated views of 2D images is an aspect of computer vision. Su et al. [27] designed an MVCNN that integrates data from multiple perspectives of polygon meshes into a single, condensed shape descriptor. This architecture produces images by positioning several virtual cameras that are aimed at the centroid of 3D structures. In the multi-view description of a 3D structure, each image is delivered independently via CNN1s with the same parameters, combined at a view-pooling layer, and finally transmitted through CNN2 to classify the object. Sahu et al. [16], who demonstrated that the architecture in Figure 3 obtained cutting-edge results when classifying the lung nodules, is one example of how MVCNN is used in the medical industry.
Figure 3. Classification of lung nodule using multi-view CNN model
4.2.2 CNN for volumetric 3D representation
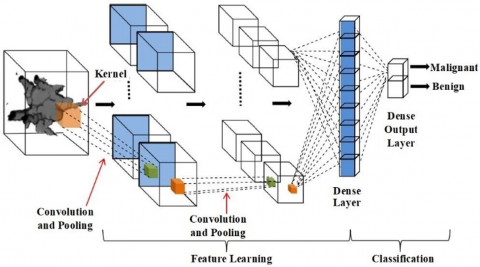
Wu et al. [28] proposed novel Approach for 3D structure recognition. The objects are first transformed into a volumetric representation, after which the space, depth, and surface are determined, along with the object category and entire 3D structure. The fundamental 3D CNN design, which includes 3D convolution using fixed temporal convolution kernel depths, is depicted in Figure 4. It substituted 2D filters with pooling kernels and 3D (s × s × d) filters. Here d representing the kernels temporal depth corresponding to the count of frames utilised as input across the framework. Size of Kernel spatial is represented by s. An output layer and a dense layer that are densely connected are then utilized to classify the objects. As can be seen in the Table 5, there are several applications in medical imaging wherein 3D CNN is employed for classification and detection.
Figure 4. Architecture of 3D CNN model
Table 5. Recent research on lung nodule identification using CNN models
|
CNN Architecture |
Benchmarks |
Significant Points |
Results Obtained |
References |
|
CNN |
LIDC-IDRI |
The comparison provided in this article compares Stacked Auto-Encoder (SAE), Deep Neural Network (DNN), and CNN, with CNN outperforming the others. |
Spec. 84.32%, Sens. 83.96%, Accur. 84.15% |
Song et al. [30] |
|
MVCNN |
DLCST, ANODE09 |
Analysis is done on the effects of two factors, including the range of views and the integration of the three fusion techniques. By combining fusions and adding more viewpoints, candidate identification is improved. |
At 1 and 4 FPs per scan, Sens. 85.4% and 90.1%, CPM score 0.637 |
Setio et al. [31] |
|
CNN |
LIDC-IDRI |
The CNN model has four separate channels that are intended to identify nodules of four distinct sizes. |
At 4.7 and 15.1 FPs per scan, Sens. 80.06% and 94% |
Jiang et al. [32] |
|
3D-CNN |
LIDC-IDRI |
To distinguish between non-nodule and nodule patches, a significant amount of 3D cubes is generated using methods of data augmentation and input into a 3D CNN. |
At 5 FPs per Scan, Sens. 90% |
Huang et al. [33] |
|
Ensemble of 3D-CNNs |
LIDC-IDRI |
Integration of five 3D-CNNs fed with input from CT images at five distinct scales to differentiate between non-nodules and micro nodules. |
Sens. 96.57%, F score 96.42% AUC 0.98, Accur. 97.35% |
Monkam et al. [34] |
|
2D-CNN |
LIDC-IDRI |
For obtaining patches of non-nodules and micro nodules of various sizes, three CNNs of varying depth are used. It demonstrates CNN's depth and efficacy. |
Sens. 83.82%, F score 83.45%, AUC 87%, Accur. 88.28% |
Monkam et al. [35] |
|
PSO based CNN |
LIDC-IDRI |
By doing away with the need for human parameter-finding, the PSO method is utilized to optimize the network hyperparameters. |
Sens. 92.20% Spec. 98.21%, Accur. 97.62% |
Da Silva et al. [36] |
|
3D Faster R-CNN |
LIDC-IDRI, LUNA 16 |
Candidate nodules are produced using a 3D Faster R-CNN, which is subsequently input into a 3D DPN with deep feature extraction and improved classification. |
FROC score 84.42% |
Zhu et al. [37] |
|
CMixNet, 3D Faster R-CNN |
LIDC-IDRI, LUNA 16 |
DenseNet's and ResNeXt proposed CMixNet (Mixed Link Network) integrates both architectures for improved feature extraction. Faster R-CNN is used to propose regions for improved nodule detection. |
FROC score 94.21% |
Nasrullah et al. [17] |
|
3D Faster |
LIDC |
Real and varied 3D nodules are created using the Multi-Conditional Generative Adversarial Network (MCGAN) DA approach and input into the 3D Faster R-CNN for generalized bounding box nodule identification. |
CPM score 0.550 |
Han et al. [38] |
|
MBEL-3D-CNN |
LUNA 16 |
DenseNet, IResNet, together with VGGNet, three 3DMB models are combined into MBEL-3D-CNN (Multi-Branch Ensemble 3D-CNN). Each was provided a 3D lung image at three distinct scales. Each model makes an individual prediction of likelihood before combining the findings to forecast nodule. |
CPM score 87.3% |
Cao et al. [39] |
|
m-RPN, 3DDCNN |
LUNA 16, ANODE09, LIDC-IDRI, SPH6 |
The VGG-16 standard was modified by the proposed m-RPN workers for five convolution layers merged with a deconvolution layer, and nodule identification was subsequently carried out by the various levels of RPN. For False Positive reduction, cloud-based 3D Deep CNN (3DDCNN) based on RESNET-101 is employed. |
At 1.97 and 2.1 FPs per scan, sens. 98.7% and 98.4%, FROC score 0.946 |
Masood et al. [18] |
4.3 Other techniques
There are also additional techniques, such as faster region-based CNNs (faster R-CNNs), which are mostly employed for producing k bounding box suggestions and detecting areas via the faster selective search method. Usually, it is employed in real-time detection. The UNet framework was first presented by Ronneberger et al. [29] and has two paths: an up-sampling path and a down-sampling path. Achieving outstanding results were designs like Dual Path Network, Xception, and CMixNet [17], which combine the benefits of other advanced CNN models like Inception, DenseNet, and ResNet model. There were less redundant hyperparameters and improved feature extraction when CNN was combined with alternative techniques like CMixNet and particle swarm optimization (PSO). Ensemble learning models (ELM), that integrate weaker models and provide conclusions depending on majority vote, are one technique to improve efficiency. These approaches helped to improve identification ability and created more dependable systems for clinical decision support.
5.1 Detection of lung nodule
To identify lung nodules through screening at the earliest stages of the lung nodule detection phase is crucial. The majority of research on lung nodule detection involving a decrease in false positives are currently being done. Experts can now recognize patches using CT screens without any prior knowledge of features thanks to deep learning's notable accomplishment. Table 5 lists a few most recent research for the identification of nodules from CT scans, together with their techniques, results, benchmarks, and references. In the table sens., accur. and spec. represents the sensitivity, accuracy and specificity, respectively.
5.2 Classification of lung nodule
The classification between lung nodules and non-nodules became automatic and has become more successful as a result of deep learning's notable results. The accurate classification of malignant nodules and the measurement of them using CT screens is currently rather difficult. In addition, not every nodule classified as malignant. As a result, several approaches have been put forth and evaluated against various standards to aid specialists in the duty of classifying malignant from benign lung nodules. Table 6 lists many models that have been put into practice on various benchmarks along with brief references to some newly established techniques for identifying as non-cancerous or cancerous lung nodules.
Table 6. Recent research on lung nodule classification using CNN models
|
CNN Architecture |
Benchmarks |
Significant Points |
Results Obtained |
References |
|
U-Net, 3D-CNNs |
LUNA 16, Kaggle’s data DSB |
To differentiate between normal and pathological CT scans, the 3D CT volume was initially pre-processed along with segmentation. The input region encompassing any nodule candidates that were found by the U-Net were then fed into the 3D-CNN classifier. |
Accur. 86.6% |
Alakwaa et al. [40] |
|
2D-Deep CNN |
private dataset, LIDC-IDRI |
VGG-16 network containing adjusted FC layers make up the 2D-DCNN, which also uses a random search to optimize the hyperparameters. |
Avg. validation accur. 68.0% |
Nishio et al. [41] |
|
DFCNet |
LUNA 16, ANODE09, LIDC-IDRI |
Each identified pulmonary nodule is classified into one of four lung cancer stages by DFCNet using a fully convolutional neural network: stage 1 (greater than 3 mm and less than or equal to 20 mm), stage 2 (ranging from 21 to 30 mm), stage 3 (greater than 30 mm and less than or equal to 70 mm), and stage 4 (greater than 70 mm). |
Sens. 84.58% |
Masood et al. [42] |
|
Hybrid CNN |
LIDC-IDRI |
ALexNet and LeNet were combined into a hybrid CNN using layer and parameter values. By changing the values for the kernel size, learning rate, etc., this work examined the CNN model's efficiency in more detail. |
Accur. 88.1% |
Zhao et al. [43] |
|
E-CNN |
LIDC-IDRI |
The E-CNN (Enhanced CNN) classifier classifies input having a size of 256×256 using three convolutional layers with ReLU pooling normalisation and then an FC layer using a ReLu Dropout layer. |
With 1.7 and 3.8 FPs per scan Sens. 89% and 95.01% and Accur. 97% |
Kasinathan et al. [44] |
|
MRC-DNN |
LIDC-IDRI |
Classification via Multiple Regularization the Deep Neural Network (MRC-DNN) directly makes classification of the input 3D CT images on the basis of the novel regularisation notion that it proposes for network training. |
Spec. 95%, Sens. 81%, Accur. 90% |
Ren et al. [45] |
|
CNN |
LIDC-IDRI |
To demonstrate the efficacy of various layer settings for CNN under the same parameters, three distinct CNN designs have been examined. |
Spec. 83.8%, Sens. 79.4%, Accur. 82.3% |
da Silva et al. [46] |
|
VGG-16, LeNet, AlexNet |
TCGA-LUAD |
In order to determine the optimal classification outcome, the suggested model combined three CNN models (VGG-16, LeNet, and AlexNet) with six classifiers (Softmax, DT, LDA, LR, SVM, and k-NN), then utilized feature optimization techniques (k-NN, PCA, and mRMR). |
Spec. 99.71%, Sens. 99.32%, Accur. 99.51%, |
Toğacar et al. [47] |
|
Taguchi parametric optimized 2D-CNN |
LIDC-IDRI, SPIE-AAPM |
Initially the Taguchi technique is used to determine the best parameter combinations. Next, 2D CNN optimization parameters are set up for training the model using input CT images, after which the model is eventually classified as malignant or benign. |
Accur. SPIE-AAPM) 99.97%, Accur. (LIDC-IDRI) 98.83% |
Lin et al. [48] |
|
Modified AlexNet (MAN) |
LIDC-IDRI |
To increase the accuracy of classifying lung CT images, the framework suggested combines MAN with SVM classifiers. |
Accur. greater than 97.27% |
Bhandary et al. [49] |
|
MVCNN |
LIDC-IDRI |
Eight CNN1s with common parameters were provided with cross-sections of lung nodules from eight various angles, and their outcome was sent into a second stage CNN2 that further classified the nodules as benign or malignant. |
Accur. 93.18% |
Sahu et al. [16] |
When comparing Convolutional Neural Network (CNN) architectures, several criteria are commonly considered to assess their performance, efficiency, and suitability for specific tasks. These criteria help researchers and practitioners understand the strengths and weaknesses of different architectures and choose the most appropriate one for their applications. Some key criteria for comparing CNN architectures are: Accuracy, Model Size and Complexity, Computational Efficiency, Generalization Performance, Transfer Learning Capability, Interpretability, Robustness to Adversarial Attacks, Resource Efficiency, Scalability, Availability of Pretrained Models and Framework Support. By considering these criteria, researchers and practitioners can perform comprehensive evaluations and comparisons of CNN architectures, ultimately selecting the most suitable architecture for their specific needs and applications.
Performance outcomes for CNN-based architectures in identifying lung cancer through classification and detection tasks vary depending on the specific architecture, dataset used, and evaluation metrics employed. Table 7 gives an overview of typical performance outcomes used in the literature.
Table 7. Performance comparison methods
|
Parameter |
Description |
|
Comparison with Baseline Methods |
CNN-based architectures are often compared with baseline approaches, such as rule-based systems or traditional machine learning algorithms, to demonstrate their superiority in terms of accuracy, sensitivity, specificity, or other performance metrics. |
|
Cross-Validation Results |
The cross-validation is a method that divides the dataset into several subgroups for training and testing in order to evaluate a model's generalization performance. Cross-validation results provide insights into the robustness and stability of CNN-based architectures across different data splits. |
|
Confusion Matrix |
A comprehensive examination of the model's performance is given by the confusion matrix, which displays the quantity of false negatives, false positives, true negatives, and true positives. It aids in evaluating the trade-offs between specificity and sensitivity and identifying common types of classification errors made by the model. |
|
F1 Score |
The F1 score offers a fair assessment of a model's performance as it is the harmonic mean of recall and precision. Both false negatives and false positives are taken into consideration. CNN-based architectures typically achieve F1 scores ranging from 0.7 to 0.9 in lung cancer detection tasks. |
|
Area Under the ROC Curve (AUC) |
The ROC curve plots the true positive rate (sensitivity) against the false positive rate (1 - specificity) at various threshold settings. The AUC quantifies the overall performance of a classification model, with higher values indicating better discrimination between positive and negative cases. CNN-based architectures often achieve AUC values exceeding 0.8 or even 0.9 in lung cancer classification tasks. |
|
Specificity and Sensitivity |
The proportion of actual negative instances that are accurately classified as negative is measured by specificity, also known as the true negative rate. The proportion of actual positive cases (lung cancer) that the model accurately detected is measured by sensitivity, also known as true positive rate. Sensitivity and specificity values for CNN-based models in lung cancer detection typically range from 70% to 90% or higher. |
|
Accuracy |
The proportion of correctly classified occurrences—both true negatives and true positives—compared to the total number of instances is known as accuracy. CNN-based architectures often achieve high accuracy rates in identifying lung cancer, ranging from 80% to over 90% in many studies. |
The adoption of CNN-based architectures for identifying lung cancer has profound implications for clinical practices, including improved accuracy and efficiency in diagnosis, early detection of cancerous lesions, reduction of diagnostic variability, facilitation of screening programs, tailored treatment planning, support for clinical trials, and integration with electronic health records. These advancements contribute to better patient outcomes, enhanced quality of care, and accelerated progress in the fight against lung cancer. CNN have significant implications for clinical practices in several ways:
The exact early identification, as well as the inspection of pulmonary nodules, are generally necessary for determining lung cancer mortality. This article provided a quick overview of the most recently proposed CAD algorithms that use deep learning to extract features, identify nodules, and classify them. This paper included a thorough analysis of the current models using CNN for CT screening classification and recognition. In addition, this paper discussed several CNN designs and examined modern CNN models. The research included examples of recently created deep learning models like 3D-CNN and MVCNN, which perform superior on 3D data and are effective for image classification and segmentation. Then, using the standards utilized for validation and detection, this paper examined the recently established CNN-based approaches for classification, false positive reduction, and nodules detection. The CNN-based CAD technique represents a reliable strategy, according to recent research on the identification and classification of lung cancer nodules, and it may considerably enhance early disease diagnosis and therapy. Yet there continues to be plenty of research being done to create a better, quicker, and more universal CAD system because the current approaches have several drawbacks that must be fixed via research. Therefore, a thorough understanding of CNNs, their benefits, and current research on the classification and detection of lung cancer can aid in the development of CAD systems that will aid radiologists in the diagnosis of serious illnesses like lung cancer as well as other fields of medical imaging.
[1] Pawar, A.B., Jawale, M.A., William, P., Chhabra, G.S., Rakshe, D.S., Korde, S.K., Marriwala, N. (2022). Implementation of blockchain technology using extended CNN for lung cancer prediction. Measurement: Sensors, 24: 100530. https://doi.org/10.1016/j.measen.2022.100530
[2] Shah, A.A., Malik, H.A.M., Muhammad, A., Alourani, A., Butt, Z.A. (2023). Deep learning ensemble 2D CNN approach towards the detection of lung cancer. Scientific Reports, 13(1): 2987. https://doi.org/10.1038/s41598-023-29656-z
[3] Pandian, R., Vedanarayanan, V., Kumar, D.R., Rajakumar, R. (2022). Detection and classification of lung cancer using CNN and Google net. Measurement: Sensors, 24: 100588. https://doi.org/10.1016/j.measen.2022.100588
[4] Malathi, M., Sinthia, P., Madhanlal, U., Mahendrakan, K., Nalini, M. (2022). Segmentation of CT lung images using FCM with active contour and CNN classifier. Asian Pacific Journal of Cancer Prevention: APJCP, 23(3): 905-910. https://doi.org/10.31557/APJCP.2022.23.3.905
[5] Naseer, I., Akram, S., Masood, T., Jaffar, A., Khan, M.A., Mosavi, A. (2022). Performance analysis of state-of-the-art CNN architectures for luna16. Sensors, 22(12): 4426. https://doi.org/10.3390/s22124426
[6] Shen, W., Zhou, M., Yang, F., Yu, D., Dong, D., Yang, C., Zang, Y., Tian, J. (2017). Multi-crop convolutional neural networks for lung nodule malignancy suspiciousness classification. Pattern Recognition, 61: 663-673. https://doi.org/10.1016/j.patcog.2016.05.029
[7] Shen, W., Zhou, M., Yang, F., Yang, C., Tian, J. (2015). Multi-scale convolutional neural networks for lung nodule classification. In Information Processing in Medical Imaging: 24th International Conference, IPMI 2015, Sabhal Mor Ostaig, Isle of Skye, UK, pp. 588-599. https://doi.org/10.1007/978-3-319-19992-4_46
[8] Han, F., Wang, H., Zhang, G., Han, H., Song, B., Li, L., Moore, W., Lu, H., Zhao, H., Liang, Z. (2015). Texture feature analysis for computer-aided diagnosis on pulmonary nodules. Journal of Digital Imaging, 28: 99-115. https://doi.org/10.1007/s10278-014-9718-8
[9] Wei, G., Ma, H., Qian, W., Han, F., Jiang, H., Qi, S., Qiu, M. (2018). Lung nodule classification using local kernel regression models with out-of-sample extension. Biomedical Signal Processing and Control, 40: 1-9. https://doi.org/10.1016/j.bspc.2017.08.026
[10] Mao, K., Deng, Z. (2016). Lung nodule image classification based on local difference pattern and combined classifier. Computational and Mathematical Methods in Medicine, 2016(1): 1091279. https://doi.org/10.1155/2016/1091279
[11] Dhara, A.K., Mukhopadhyay, S., Dutta, A., Garg, M., Khandelwal, N. (2016). A combination of shape and texture features for classification of pulmonary nodules in lung CT images. Journal of Digital Imaging, 29: 466-475. https://doi.org/10.1007/s10278-015-9857-6
[12] Wei, G., Cao, H., Ma, H., Qi, S., Qian, W., Ma, Z. (2018). Content-based image retrieval for lung nodule classification using texture features and learned distance metric. Journal of Medical Systems, 42: 1-7. https://doi.org/10.1007/s10916-017-0874-5
[13] Sergeeva, M., Ryabchikov, I., Glaznev, M., Gusarova, N. (2016). Classification of pulmonary nodules on computed tomography scans. Evaluation of the effectiveness of application of textural features extracted using wavelet transform of image. In 2016 18th Conference of Open Innovations Association and Seminar on Information Security and Protection of Information Technology (FRUCT-ISPIT), St. Petersburg, Russia, pp. 291-299. https://doi.org/10.1109/FRUCT-ISPIT.2016.7561541
[14] Li, X., Shen, L., Luo, S. (2017). A solitary feature-based lung nodule detection approach for chest X-ray radiographs. IEEE Journal of Biomedical and Health Informatics, 22(2): 516-524. https://doi.org/10.1109/JBHI.2017.2661805
[15] Boroczky, L., Zhao, L., Lee, K.P. (2006). Feature subset selection for improving the performance of false positive reduction in lung nodule CAD. IEEE Transactions on Information Technology in Biomedicine, 10(3): 504-511. https://doi.org/10.1109/TITB.2006.872063
[16] Sahu, P., Yu, D., Dasari, M., Hou, F., Qin, H. (2018). A lightweight multi-section CNN for lung nodule classification and malignancy estimation. IEEE Journal of Biomedical and Health Informatics, 23(3): 960-968. https://doi.org/10.1109/JBHI.2018.2879834
[17] Nasrullah, N., Sang, J., Alam, M.S., Mateen, M., Cai, B., Hu, H. (2019). Automated lung nodule detection and classification using deep learning combined with multiple strategies. Sensors, 19(17): 3722. https://doi.org/10.3390/s19173722
[18] Masood, A., Yang, P., Sheng, B., Li, H., Li, P., Qin, J., Lanfranchi, V., Kim, J., Feng, D.D. (2019). Cloud-based automated clinical decision support system for detection and diagnosis of lung cancer in chest CT. IEEE Journal of Translational Engineering in Health and Medicine, 8: 1-13. https://doi.org/10.1109/JTEHM.2019.2955458
[19] Simonyan, K., Zisserman, A. (2014). Very deep convolutional networks for large-scale image recognition. arXiv preprint arXiv:1409.1556. https://doi.org/10.48550/arXiv.1409.1556
[20] Krizhevsky, A., Sutskever, I., Hinton, G.E. (2012). Imagenet classification with deep convolutional neural networks. Advances in Neural Information Processing Systems, 25: 1097-1105.
[21] LeCun, Y., Bottou, L., Bengio, Y., Haffner, P. (1998). Gradient-based learning applied to document recognition. Proceedings of the IEEE, 86(11): 2278-2324.
[22] Huang, G., Liu, Z., Van Der Maaten, L., Weinberger, K.Q. (2017). Densely connected convolutional networks. In 2017 IEEE Conference on Computer Vision and Pattern Recognition (CVPR), Honolulu, HI, USA, pp. 4700-4708. https://doi.org/10.1109/CVPR.2017.243
[23] He, K., Zhang, X., Ren, S., Sun, J. (2016). Deep residual learning for image recognition. In 2016 IEEE Conference on Computer Vision and Pattern Recognition (CVPR), Las Vegas, NV, USA, pp. 770-778. https://doi.org/10.1109/CVPR.2016.90
[24] Szegedy, C., Liu, W., Jia, Y., Sermanet, P., Reed, S., Anguelov, D., Erhan, D., Vanhoucke, V., Rabinovich, A. (2015). Going deeper with convolutions. In 2015 IEEE Conference on Computer Vision and Pattern Recognition (CVPR), Boston, MA, USA, pp. 1-9. https://doi.org/10.1109/CVPR.2015.7298594
[25] Matthew Zeiler, D., Rob, F. (2014). Visualizing and understanding convolutional neural networks. In: Fleet, D., Pajdla, T., Schiele, B., Tuytelaars, T. (eds) Computer Vision – ECCV 2014. ECCV 2014. Lecture Notes in Computer Science, Springer, Cham. https://doi.org/10.1007/978-3-319-10590-1_53.
[26] Xie, S., Girshick, R., Dollár, P., Tu, Z., He, K. (2017). Aggregated residual transformations for deep neural networks. In 2017 IEEE Conference on Computer Vision and Pattern Recognition (CVPR), Honolulu, HI, USA, pp. 1492-1500. https://doi.org/10.1109/CVPR.2017.634
[27] Su, H., Maji, S., Kalogerakis, E., Learned-Miller, E. (2015). Multi-view convolutional neural networks for 3d shape recognition. In 2015 IEEE International Conference on Computer Vision (ICCV), Santiago, Chile, pp. 945-953. https://doi.org/10.1109/ICCV.2015.114
[28] Wu, Z., Song, S., Khosla, A., Yu, F., Zhang, L., Tang, X., Xiao, J. (2015). 3d ShapeNets: A deep representation for volumetric shapes. In 2015 IEEE Conference on Computer Vision and Pattern Recognition (CVPR), Boston, MA, USA, pp. 1912-1920. https://doi.org/10.1109/CVPR.2015.7298801
[29] Ronneberger, O., Fischer, P., Brox, T. (2015). U-net: Convolutional networks for biomedical image segmentation. In Medical Image Computing and Computer-Assisted Intervention–MICCAI 2015: 18th International Conference, Munich, Germany, pp. 234-241. https://doi.org/10.1007/978-3-319-24574-4_28
[30] Song, Q., Zhao, L., Luo, X., Dou, X. (2017). Using deep learning for classification of lung nodules on computed tomography images. Journal of Healthcare Engineering, 2017(1): 8314740. https://doi.org/10.1155/2017/8314740
[31] Setio, A.A.A., Ciompi, F., Litjens, G., Gerke, P., Jacobs, C., Van Riel, S.J., Naqibullah, M., Sánchez, C.I., Van Ginneken, B. (2016). Pulmonary nodule detection in CT images: False positive reduction using multi-view convolutional networks. IEEE Transactions on Medical Imaging, 35(5): 1160-1169. https://doi.org/10.1109/TMI.2016.2536809
[32] Jiang, H., Ma, H., Qian, W., Gao, M., Li, Y. (2017). An automatic detection system of lung nodule based on multigroup patch-based deep learning network. IEEE Journal of Biomedical and Health Informatics, 22(4): 1227-1237.
[33] Huang, X., Shan, J., Vaidya, V. (2017). Lung nodule detection in CT using 3D convolutional neural networks. In 2017 IEEE 14th International Symposium on Biomedical Imaging (ISBI 2017), Melbourne, VIC, Australia, pp. 379-383. http://doi.org/10.1109/ISBI.2017.7950542
[34] Monkam, P., Qi, S., Xu, M., Li, H., Han, F., Teng, Y., Qian, W. (2018). Ensemble learning of multiple-view 3D-CNNs model for micro-nodules identification in CT images. IEEE Access, 7: 5564-5576. http://dx.doi.org/10.1109/ACCESS.2018.2889350
[35] Monkam, P., Qi, S., Xu, M., Han, F., Zhao, X., Qian, W. (2018). CNN models discriminating between pulmonary micro-nodules and non-nodules from CT images. Biomedical Engineering Online, 17: 1-16. https://doi.org/10.1186/s12938-018-0529-x
[36] Da Silva, G.L.F., Valente, T.L.A., Silva, A.C., De Paiva, A.C., Gattass, M. (2018). Convolutional neural network-based PSO for lung nodule false positive reduction on CT images. Computer Methods and Programs in Biomedicine, 162: 109-118. https://doi.org/10.1016/j.cmpb.2018.05.006
[37] Zhu, W., Liu, C., Fan, W., Xie, X. (2018). DeepLung: Deep 3D dual path nets for automated pulmonary nodule detection and classification. The Preprint Server for Biology. https://doi.org/10.1101/189928
[38] Han, C., Kitamura, Y., Kudo, A., Ichinose, A., Rundo, L., Furukawa, Y., Umemoto, K., Li, Y., Nakayama, H. (2019). Synthesizing diverse lung nodules wherever massively: 3D multi-conditional GAN-based CT image augmentation for object detection. In 2019 International Conference on 3D Vision (3DV), Quebec City, QC, Canada, pp. 729-737. https://doi.org/10.1109/3DV.2019.00085
[39] Cao, H., Liu, H., Song, E., Ma, G., Xu, X., Jin, R., Liu, T., Hung, C.C. (2019). Multi-branch ensemble learning architecture based on 3D CNN for false positive reduction in lung nodule detection. IEEE Access, 7: 67380-67391. https://doi.org/10.1109/ACCESS.2019.2906116
[40] Alakwaa, W., Nassef, M., Badr, A. (2017). Lung cancer detection and classification with 3D convolutional neural network (3D-CNN). International Journal of Advanced Computer Science and Applications, 8(8): 409-411.
[41] Nishio, M., Sugiyama, O., Yakami, M., Ueno, S., Kubo, T., Kuroda, T., Togashi, K. (2018). Computer-aided diagnosis of lung nodule classification between benign nodule, primary lung cancer, and metastatic lung cancer at different image size using deep convolutional neural network with transfer learning. PloS One, 13(7): e0200721. https://doi.org/10.1371/journal.pone.0200721
[42] Masood, A., Sheng, B., Li, P., Hou, X., Wei, X., Qin, J., Feng, D. (2018). Computer-assisted decision support system in pulmonary cancer detection and stage classification on CT images. Journal of Biomedical Informatics, 79: 117-128. https://doi.org/10.1016/j.jbi.2018.01.005
[43] Zhao, X., Liu, L., Qi, S., Teng, Y., Li, J., Qian, W. (2018). Agile convolutional neural network for pulmonary nodule classification using CT images. International Journal of Computer Assisted Radiology and Surgery, 13: 585-595. https://doi.org/10.1007/s11548-017-1696-0
[44] Kasinathan, G., Jayakumar, S., Gandomi, A.H., Ramachandran, M., Fong, S.J., Patan, R. (2019). Automated 3-D lung tumor detection and classification by an active contour model and CNN classifier. Expert Systems with Applications, 134: 112-119. https://doi.org/10.1016/j.eswa.2019.05.041
[45] Ren, Y., Tsai, M., Chen, L, Jing, W., Li, S., Liu, Y., Jia, X., Shen, C. (2019). A manifold learning regularization approach to enhance 3D CT image-based lung nodule classification. International Journal of Computer Assisted Radiology and Surgery, 15: 287-295. https://doi.org/10.1007/s11548-019-02097-8
[46] da Silva, G., Silva, A., de Paiva, A., Gattass, M. (2016). Classification of malignancy of lung nodules in CT images using convolutional neural network. In Anais do XVI Workshop de Informática Médica, pp. 2481-2489.
[47] Toğaçar, M., Ergen, B., Cömert, Z. (2020). Detection of lung cancer on chest CT images using minimum redundancy maximum relevance feature selection method with convolutional neural networks. Biocybernetics and Biomedical Engineering, 40(1): 23-39. https://doi.org/10.1016/j.bbe.2019.11.004
[48] Lin, C.J., Jeng, S.Y., Chen, M.K. (2020). Using 2D CNN with Taguchi parametric optimization for lung cancer recognition from CT images. Applied Sciences, 10(7): 2591. https://doi.org/10.3390/app10072591
[49] Bhandary, A., Prabhu, G.A., Rajinikanth, V., Thanaraj, K.P., Satapathy, S.C., Robbins, D.E., Shasky, C., Zhang, Y.D., Tavares, J.M.R.S., Raja, N.S.M. (2020). Deep-learning framework to detect lung abnormality–A study with chest X-Ray and lung CT scan images. Pattern Recognition Letters, 129: 271-278. https://doi.org/10.1016/j.patrec.2019.11.013