Qiuju Wang![]() | Zhengwen Yu*
| Zhengwen Yu*![]()
© 2024 The authors. This article is published by IIETA and is licensed under the CC BY 4.0 license (http://creativecommons.org/licenses/by/4.0/).
OPEN ACCESS
With the increasingly widespread application of Virtual Reality (VR) technology in the field of education, VR classroom models, characterized by their unique immersive experience, are considered an important direction for educational innovation. To maximize the educational effects of VR classrooms, efficient processing and optimization of scene images are essential. Currently, although many studies are devoted to the rendering techniques of static scenes, research on real-time processing and personalized layout optimization of dynamic interactive teaching scenes is still insufficient. This paper proposes innovative methods based on deep learning for two core issues in VR classrooms: scene image enhancement and visual layout optimization. First, by constructing an image enhancement generation model based on the U-net network, the clarity and detail richness of scene images are significantly improved. Second, this paper applies an improved Spatial Pyramid Pooling in Fast Regions with Convolutional Neural Networks (SPPF) structure from Yolo5 to scene layout and introduces a novel visual graph attention model (GAM), which can extract colors from input images and effectively apply them to visual interface design. These methods not only enhance the visual effects of scenes but also lay the foundation for building personalized teaching environments that meet the needs of different learners. This research provides a new perspective for the real-time processing and layout optimization of VR classroom scenes, which is of significant importance for advancing the development of educational technology.
Virtual Reality (VR) classroom, scene image enhancement, visual layout optimization, deep learning, U-net Network, Spatial Pyramid Pooling in Fast Regions with Convolutional Neural Networks (SPPF) structure, visual graph attention model (GAM)
With the rapid development of VR technology, its application in the field of education has gradually deepened. As a new mode of teaching, VR classrooms have begun to change the traditional educational landscape [1-4]. Utilizing the immersive and three-dimensional interactive experience provided by VR technology has the potential to greatly enhance learners' engagement and learning outcomes [5, 6]. However, to fully realize the teaching potential of VR classrooms, it is essential to ensure the clarity of scene images and the rationality of layouts, in order to create a distraction-free and easy-to-interact learning environment for students.
Current research is in the preliminary stages of exploring VR applications in education, where the processing and optimization of scene images are among the key issues [7-10]. High-quality scene images can not only provide a more realistic visual experience but also help to improve learning efficiency and effectiveness [11-14]. In addition, effective layout optimization can significantly enhance the efficiency of information transmission, assisting students in better understanding and memorizing the learning content [15, 16]. Therefore, exploring scene image enhancement and layout optimization methods based on deep learning is of great research significance for optimizing the VR classroom experience and improving teaching quality.
Existing studies are mostly focused on static scene rendering techniques, with less discussion on real-time processing and optimization of dynamic interactive teaching scenes [17-19]. Moreover, current scene layout methods often overlook personalized learning needs and cognitive differences, lacking adaptive design for different learners [20-24]. These limitations restrict the potential of VR in personalized teaching and inclusive education, also constraining the maximization of educational effects.
This paper first focuses on the research of scene image enhancement methods for VR classrooms, proposing an image enhancement generation model based on the U-net network, aimed at significantly improving the quality and detail expression of scene images through deep learning algorithms. Then, to achieve more efficient scene layout, this paper introduces and improves the SPPF structure from Yolo5, proving its effectiveness in optimizing scene layout through comparative analysis. Next, it delves into the visualization layout optimization of VR classroom scene images, employing a visual GAM combined with innovative loss functions, detailing how to extract color styles from input images and efficiently apply this style to visual interface design. This research not only provides a new direction for the visualization layout of VR classroom scenes but also offers technical support for personalized teaching design, having profound theoretical significance and practical value.
2.1 Network construction concept
In the current application of VR classroom scenes, due to the high image quality requirements of the VR environment, image processing models need to possess better nonlinear expression capability and the ability to learn complex mappings to ensure the realism and coherence of the scene. Although the ReLU activation function can speed up the training process of deep neural networks and prevent the problem of gradient vanishing, its gradient in the negative value area is zero, which may lead to the "death" of some neurons, causing the model to lose some information. In the processing of VR classroom scenes, the loss of this information may manifest as a lack of detail or a decrease in contrast, affecting the learning experience. The SiLU (Sigmoid Linear Unit) activation function provides smooth non-linear characteristics and allows for the passage of small gradients in the negative value area, thus avoiding the problem of neuron death and potentially improving the model's performance in image detail enhancement, to further optimize the learning environment and enhance educational effects.
2.2 Generator network structure
In the current application of VR classrooms, the clarity and brightness balance of scene images are crucial for users' immersion and learning experience. The purpose of general image enhancement algorithms is to improve visual effects, applicable to various scenes, but for VR classrooms, image enhancement is not just for visual comfort but also for the accurate delivery of teaching content and students' interactive experience. Therefore, the research goal of this paper is to develop a deep learning model, especially for VR classroom scenes under low brightness conditions, to improve their image clarity and brightness balance. Figure 1 gives the generator network structure.
Addressing the limitations of U-net in segmentation tasks, the research content proposed in this paper focuses on optimizing algorithms to solve the problem where classification accuracy and localization precision are difficult to achieve concurrently. In VR classroom scenes, some details may be difficult to discern in low light; hence, the model needs to adjust the amount of brightening, applying greater enhancement in extremely low-light areas, while moderately brightening or maintaining the original state in already sufficiently bright areas. The purpose of this dynamic adjustment is to achieve a new brightness balance between different light areas, ensuring that the enhanced image retains all teaching-related details while providing the best visual effect and learning experience.
In the application of VR classrooms, high-quality reconstruction and detail preservation of scene images are extremely important, as they relate to the recognizability of learning materials and the authenticity of the interactive experience. Although the traditional U-net network performs well in image segmentation tasks, it may have certain limitations when processing highly complex and detail-rich VR classroom scenes. Especially during the feature extraction stage, the standard U-net might not fully utilize all relevant information in the image, particularly across channels and spatial dimensions. To address this issue, this paper proposes a novel attention feature transfer module designed to strengthen the structure of the generator. This attention module, by analyzing input features more finely, can consider dependencies between channels and relevance of spatial positions simultaneously. Specifically, by weighting each pixel of the input image, it can optimize feature extraction, ensuring that the image enhancement process does not overemphasize or ignore key details.
Figure 1. Generator network structure
The computation is first carried out for all pixel feature maps. For applications in VR classrooms, this step needs special attention to visual features of teaching content, such as text, images, symbols, etc., ensuring these key pieces of information can be accurately extracted. Further, the impact factors of all pixels are calculated. In this step, the attention module not only identifies key educational elements in the image but also dynamically adjusts the representation strength of these elements based on the importance of scene content. For example, for explanatory text or charts in the classroom, the module assigns a higher impact factor to ensure they remain prominent and easy to read in the enhanced image. Assuming a batch contains a number of image samples represented by Y, the number of color channels by Z, and the height and width of the image by G and Q, respectively. The feature map of the u-th pixel is represented by XLu, and the impact factor of the u-th pixel is represented by α1, then the calculation formulas are:
$X L_u=Q_w^u\left(D_u\right)^S \otimes Q_j^u\left(D_u\right)$ (1)
$\alpha_1=\frac{e^{\left(X L_u\right)}}{\sum_{u=1}^V e^{\left(X L_u\right)}}$ (2)
Calculating the final input of all pixels, this process integrates the information obtained in the first two steps to generate the final enhanced image. Here, based on the calculated pixel impact factors, the attention module weights the features of each pixel, thus obtaining the adjusted feature maps, which are subsequently used to generate images with optimized clarity and brightness. The calculation formula for the final output Pu of the u-th pixel is:
$P_u=\lambda\left(Q_n^u\left(D_u\right) \otimes \alpha_1\right)$ (3)
Pu is susceptible to the influence of the random matrix Qn generated by the multi-head attention mechanism. This paper applies Qn to the input, then multiplies the result with the corresponding impact factor, and further multiplies it by a decay factor, with the result being the final output Pu. Let the feature map of the u+1-th pixel be represented by XLu+1, and the input sequence by Du+1, then the calculation formula is:
$X L_{u+1}=Q_w^{u+1}\left(D_{u+1}\right)^T \otimes Q_j^{u+1}\left(D_{u+1}\right)$ (4)
In the adopted feature attention model, matrices Qw and Qj are randomly generated based on the multi-head attention mechanism first, where Qw affects (Du+1)T, and Qj affects (Du+1), multiplying them together and based on the final result to generate the feature map. Let the impact factor of the u+1-th pixel be represented by α2, then the calculation formula is:
$\alpha_2=\frac{e^{\left(X L_{u+1}\right)}}{\sum_{u=1}^V e^{\left(X L_{u+1}\right)}}$ (5)
Assuming the decay factors corresponding to the previous pixel and the next pixel are represented by ε and β, respectively, the calculation formula for the final output Wu+1 of the u+1-th pixel is:
$W_{u+1}=\varepsilon\left(Q_n^u\left(D_u\right) \otimes \alpha_1\right)+\beta\left(Q_n^{u+1}\left(D_{u+1}\right) \otimes \alpha_2\right)$ (6)
In reiterating the feature attention mechanism proposed in this paper, considering the special needs of VR classrooms, we will emphasize how this mechanism adapts to the high demands for image coherence and completeness in the teaching environment. VR classroom scenes, unlike general image enhancement applications, not only require improving the visual quality of images but also maintaining the logical coherence and understandability of teaching content. In this study, the feature attention mechanism first processes the value of the u-th pixel, through specially designed neural network layers for feature extraction, which includes two different convolution operations to capture the spatial and channel information of the pixel. Then, this feature map is processed through an activation function to enhance non-linear expression capability. At the same time, the feature map is multiplied by a dynamically adjusted decay factor, this process finely controls the weight of each pixel's contribution, ensuring the prominence of important information. Then, the mechanism proceeds to process the next pixel (the u+1-th), performing the same operations. This is not only to extract features of each independent pixel but also to capture the dependencies between adjacent pixels, maintaining the contextual coherence of the image. Finally, the mechanism will combine the output of the u+1-th pixel with the output of the i-th pixel to obtain the final output. This accumulative way not only includes the information of the current pixel but also integrates the information of previous pixels, thus ensuring the coherence and completeness of the image's contextual information.
Figure 2. The SPPF structure
For applications in VR classrooms, this paper innovatively improves the SPPF structure in the traditional YOLOv5 network to adapt to the special requirements of image processing in the VR environment. Figure 2 shows the SPPF structure. By combining the SPPF module and Transformer technology, a new type of module is created, which can more effectively capture image features at different scales, enhancing its invariance. First, in processing the input image, we perform X, Y direction position encoding to preserve spatial information, then extract features through CBS operations. Subsequently, pooling operations with convolution kernels of different sizes are used to capture multi-scale information, and feature fusion is performed through the residual structure, finally going through CBS operations again to output refined feature mappings. This image enhancement method applied in VR classroom scenes, compared to other application scenarios, especially emphasizes adaptability to dynamic changes and maintaining the clarity of learning content in the immersive experience, to ensure the maximization of learning outcomes.
With the advancement of technology, VR has become a new teaching medium, capable of creating immersive learning environments, enhancing learners' engagement, and improving learning efficiency. Researching how to effectively carry out scene layout can help educators build virtual environments that are more in line with teaching goals and learners' psychology, enhancing learners' spatial awareness, concentration, and memory retention. The goals of conducting VR classroom scene image visualization layout include creating highly immersive and interactive learning environments, improving the accessibility and comprehensibility of learning content, and optimizing the user interface to meet the needs of different learners. Specifically, this involves designing reasonable visual guides and layouts to help students adapt to the virtual environment more quickly, reducing cognitive load; developing highly adaptable user interfaces to ensure that students with different cognitive abilities and learning styles can benefit effectively from the course; and using data analysis to optimize layout, adjusting scene design continuously based on students' interactions and learning outcomes to improve teaching effectiveness. These goals aim to ensure that the application of VR technology in the field of education can maximize its potential.
3.1 Visual GAM
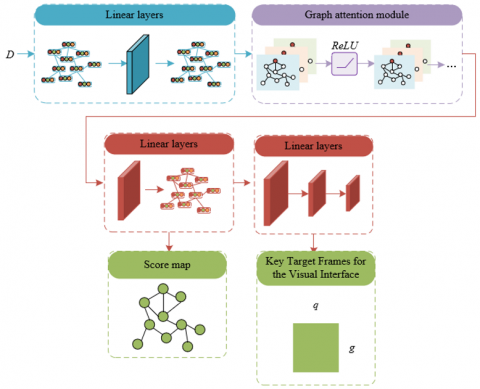
In the application of VR classrooms, to efficiently process and optimize the image visualization layout of classroom scenes, this study adopts a spatial domain-based graph convolutional network model. Spatial domain graph convolutional models are suitable for VR teaching scenes because they offer advantages in efficiency, generalization ability, and flexibility over frequency domain models. Spatial models aggregate neighborhood information through a message-passing mechanism, allowing for batch processing of nodes, thus improving computational efficiency; they do not require Fourier transformation of the entire graph, which enables the models to better generalize to new graph structures, especially important for the dynamic and diverse image structures often found in VR teaching scenes; furthermore, spatial models can handle complex graph structures, including directed and undirected graphs, providing support for the rich interaction modes in VR classrooms. Catering to the specific needs of VR teaching scenes, such as focusing on the clear presentation of teaching content and students' interactive experience, this study introduces an attention mechanism, enabling the model to focus on visual feature regions that significantly affect teaching layout, further enhancing the presentation of teaching materials and learning experience. This model design, combining spatial graph convolution and attention mechanisms, allows the image layout of VR classrooms to be more efficient, flexible, and adaptable, meeting the special requirements for layout optimization in VR teaching environments, and providing a personalized and dynamically adaptive teaching experience compared to other image visualization layout optimization application scenarios. Figure 3 shows the structure of the visual GAM.
Figure 3. Visual GAM structure
The spatial domain-based graph convolutional model used here is particularly suited for handling dynamic interactions and spatial relationships in VR. The input of the model comprises three parts: first, the graph H=(N,R), where N represents the collection of image blocks (such as teaching elements, interactive buttons, etc.) in the classroom scene, and R represents the spatial connection relationships between these image blocks, including each node's connection to itself, ensuring the importance of self-information is considered during feature updating; second, the node feature matrix DH, which describes the visual and semantic information of each image block; and lastly, the label vector m, providing the target score information of nodes during the training process. The model's output is twofold: one is the score map H(T), preserving the input graph's topological structure, where each node's score represents its probability of becoming a visual focus in the VR classroom; the other is the predicted width q and height g of key visual targets, determining the position and size of teaching elements in the layout. Compared to other image layout optimization applications, the layout optimization of VR classrooms not only needs to efficiently process and display teaching content but also consider students' gaze tracking and interactive feedback. This requires the model to dynamically adapt to different teaching scenarios and student behaviors during layout generation, and the spatial domain-based graph convolutional model meets these needs by providing a highly adaptive and interactive image visualization layout optimization solution for VR classrooms through attention mechanisms and feature aggregation.
Unlike other image layout optimization scenarios, layout optimization for VR classrooms needs to consider interactive presentation of teaching content and students' spatial positioning, requiring the model not only to process static image features but also to adapt to dynamic interactions and changes in user behavior. Thus, the visual GAM constructed in this study includes a network structure with two key components. The model first utilizes a multi-layer graph attention network, combined with preceding and subsequent linear layers, effectively integrating the graph H(T) and visual saliency features, applying an attention mechanism inspired by visual attention mechanisms to enhance the model's ability to recognize important visual elements in VR classroom scenes. This component outputs a score map, providing a score for each classroom element, indicating its likelihood of becoming a visual focus of the classroom. The second component is a feedforward neural network (FNN), which receives the score map as input and precisely regresses the width and height of key visual targets, thus determining the size and position of teaching elements in the VR classroom layout.
Assuming the weights of the fully connected layers are represented by QIN and QOUT, and the visual saliency feature matrix is represented by DH. The scores are represented by H(T), and the multi-layer graph attention network expression includes:
$H(T)=\delta\left(G A T\left(D_H Q_{I N}\right)\right) Q_{O U T}+D_H$ (7)
In the Graph Attention Module (GAT), each graph attention layer takes as input the features of classroom elements, denoted by d, and outputs a new feature, denoted by d′. Assuming the set of neighboring nodes of node nu is denoted by Vu, the feature matrix by Q, and the attention coefficient by ωuk, for $\forall n_u \in N$, the linear transformation from dnu to d`nu is shown in the following equation:
$d_{n_u}^{\prime}=\Theta\left(\sum_{k \in V_u} \omega_{u k} Q d_{n_u}\right)$ (8)
Let the weight vector be represented by x, the formula for ωuk is:
$\omega_{u k}=\frac{\exp \left(L R\left(x^S\left[Q d_{n_u} \| Q d_{n k}\right]\right)\right)}{\sum_{l \in V_u} \exp \left(L R\left(x^S\left[Q d_{n_u} \| Q d_{n k}\right]\right)\right)}$ (9)
If the attention mechanism operates independently L times, then there is:
$d_{n_u}^{\prime}=\Theta\left(\frac{1}{L} \sum_{l=1}^L \sum_{k \in V_u} \omega_{u k}^l Q^l d_{n_u}\right)$ (10)
3.2 Loss functions
The design of the loss function is crucial to ensuring effective learning by the network model. Targeting the research objectives, this paper designs two types of loss functions, each for predicting the position and size of key targets in the visual interface. The first loss function, MH, focuses on the prediction of graph node probabilities, concentrating on enhancing the model's accuracy in locating key teaching elements in the VR classroom, ensuring that students' attention can be correctly guided to the teaching content. The second loss function, MSI, is used for the regression task of key visual target sizes, helping the model learn how to dynamically adjust the size of elements based on teaching content and student interactions, to optimize visual presentation and teaching effectiveness. These two independent loss functions work together on the model, enabling it to accurately predict visual focuses in the VR environment and adjust the position and size of elements in the layout to support teaching activities in VR classrooms. This is different from the loss function design in traditional image layout optimization, which might focus more on plane aesthetics or general layout rules of the user interface, without involving interactivity or teaching objectives.
Assuming the score of node nu is represented by tnu, MH is:
$M_H=\sum_{u=1}^{|N|}\left\|t_{n_u}^{\wedge}-t_{n_u}\right\|$ (11)
Assuming the number of key targets in the visual interface is represented by Vz, then MSI:
$M_{S I}=\sum_{u=1}^{V_z}\|([\hat{q}, \hat{g}]-[q, g])\|$ (12)
3.3 Key target coloring for visual interfaces
In VR classroom applications, the selection of a coloring scheme plays a crucial role in the learning experience and teaching effectiveness. This research focuses on coloring the key targets of visual interfaces determined by deep learning methods, aiming to enhance students' perception and cognition of teaching content through the optimization of color mapping schemes. In the virtual environment, unlike traditional image layout optimization, colors need to be harmonious and easily distinguishable, while ensuring contrast with the background, and aligning with VR's interactivity and immersion requirements. Therefore, the coloring needs to consider color harmony, to ensure the visual interface does not distract users with overly stimulating or discordant colors; color contrast, to make key targets stand out against the variable backgrounds of the virtual classroom, making them easy to recognize; and color readability, ensuring users with different visual abilities can clearly identify and understand teaching elements. This coloring strategy not only meets the specific educational goals of VR classrooms, which is to promote learning through visual effects, but also considers users' visual comfort and information absorption efficiency, further advancing the development and application of VR educational technology.
In the VR classroom environment, handling color harmony must meet aesthetic needs and adapt to the functionality and interactivity requirements of this specific teaching environment. The deep learning-based key target coloring method proposed in this paper first extracts a global color palette by performing k-means clustering analysis on classroom scene images, establishing a basic color scheme consistent with the image style. However, directly applying the original colors of the image may not achieve the purpose of highlighting educational content and visual guidance. The study chooses to introduce palettes designed for visualization as built-in templates. These template palettes, combined with the educational goals and interactive requirements of VR classrooms, optimize color usage, not only enhancing the visual appeal of key teaching elements but also ensuring overall harmony and contrast with the virtual environment. This approach promotes students' focus and understanding of the teaching content while maintaining the coherence of the immersive learning experience.
Specifically, suppose the global palette is represented by ZOIM={z0-1,z0-2,…,z0-j}, and the number of categories in the key target data of the visual interface is represented by kj. The template palette is represented by ZOB-I={ZO1,ZO2,…,ZOm}, where ZOa={za-1,za-2,…,za-la}1<=a<=m,la=|ZOa|. The perceptual distance between template palette ZOa and ZOIM is represented by OFZR-a, and the distance between color z0-u in ZOIM and color za-k in ZOa is represented by OFz-uk. The calculation formula is:
$\underset{1 \leq a \leq m}{\operatorname{MIN}} O F_{Z R-a}=\sum_{u=1}^j \sum_{k=1}^{l_a} O F_{z-u k}$ (13)
Suppose the values of two colors in CIELAB space are represented by (M*u,x*u,y*u) and (M*u,x*u,y*u) respectively. The perceptual distance between two colors can be calculated using the formula:
$O F_{z-u k}=\sqrt{\left(M_u^*-M_k^*\right)^2+\left(x_u^*-x_k^*\right)^2+\left(y_u^*-y_k^*\right)^2}$ (14)
To ensure that teaching content, indicators, or interactive elements, which are key targets of the visual interface, are clearly visible in the diverse background environments of the VR classroom, this paper first uses a clustering algorithm to analyze the image background area around the key targets, extracting the dominant colors of that area. Then, using the WCAG 2.0 color contrast formula, it calculates the contrast between the colors of the key targets and the background colors to ensure a sufficient visual difference between them, thereby facilitating visual recognition and understanding of the learning content. This process must consider unique visual challenges in the VR environment, such as complex scene compositions, dynamic background changes, and the effects of lighting, ensuring teaching elements maintain high visibility under various conditions. Suppose ZOs=MIN1<=a<=mOFzo-a, i.e., ZOs is the closest to ZOIM. The primary color of the image background area covered by the key target frames of the visual interface is represented by ZLO. The contrast between color zs-u,u$\in$[0,ls], and ZLOm is represented by ZEu, reflecting the visual difference between the two colors. Let the new color sequence in the palette be represented by ZO'={z's-1,z's-2,…,z's-ls}, satisfying ZEu≥ ZEk, m≤u<k< ls.
For the specificity of VR classrooms, this paper adopts optimal color coding to enhance the readability of key data. This requires using colors with high contrast to the background to highlight important information, ensuring that, regardless of background changes in the VR classroom environment, key information remains prominent and easy for students to identify. Unlike traditional image visualization layout optimization, VR classroom scenarios must consider the three-dimensional environmental effects and immersive experience's impact on student attention, such as adjusting the size of pie chart segments or the color and size in bar charts, making data visualization consistent with students' interaction and cognitive processes in virtual space. This optimization is not just for aesthetics but more importantly, to improve the efficiency and accuracy of information transmission, reduce cognitive load, and make it easier for students to recognize and understand teaching content in a dynamic and interactive learning environment.
From the experimental results in Table 1, we can observe the performance of various image enhancement methods across five different performance metrics. These metrics include Structural Similarity Index (SSIM), Average Boundary Matching Error (ABME), Mean Squared Error (MSE), Peak Signal-to-Noise Ratio (PSNR), and Natural Image Quality Evaluator (NIQE). Among these measures, a higher SSIM indicates closer image quality to the original image; lower ABME and MSE indicate smaller errors; higher PSNR indicates better image quality; lower NIQE indicates higher perceptual quality. According to the table data, we can see that the proposed method performs optimally on four indicators (highest SSIM, lowest ABME, lowest MSE, highest PSNR), although slightly higher on NIQE than "Proposed Method-SPPE," but overall shows the best image enhancement effect. This indicates that, when considering these performance metrics comprehensively, the proposed method can more effectively enhance the quality of VR classroom scene images.
Analyzing the above experimental results, we can conclude that the image enhancement generation model based on the U-net network proposed in this study significantly outperforms other variant methods. Although "Proposed Method-SPPE-CA" and "Proposed Method-CA" performed better on the SSIM indicator, the proposed method showed higher performance on MSE and PSNR, indicating its advantages in reducing errors and improving image quality.
Table 1. Performance comparison of image enhancement methods for VR classroom scenes in ablation study
|
Method |
SSIM |
ABME |
MSE |
PSNR |
NIQE |
|
Proposed Method-SPPE-CA |
0.3126 |
0.2278 |
0.082 |
34.268 |
3.5124 |
|
Proposed Method -CA |
0.3569 |
0.2249 |
0.0715 |
34.236 |
3.5621 |
|
Proposed Method -SPPE |
0.3154 |
0.2569 |
0.097 |
33.159 |
3.5214 |
|
Proposed Method |
0.4326 |
0.1895 |
0.0623 |
36.689 |
3.6238 |
Table 2. Performance comparison of different image enhancement methods for VR classroom scenes
|
Method |
SSIM |
ABME |
MSE |
PSNR |
NIQE |
|
RetinexNet |
0.1895 |
0.3548 |
0.1689 |
31.2568 |
3.8745 |
|
GLADNet |
0.2635 |
0.4216 |
0.2235 |
31.2547 |
3.6589 |
|
Zero-DCE |
0.4215 |
0.2178 |
0.0689 |
35.2369 |
4.1258 |
|
KinD |
0.3859 |
0.2136 |
0.0578 |
35.2314 |
3.7895 |
|
KinD++ |
0.3659 |
1.2359 |
0.0712 |
34.5987 |
4.2365 |
|
RRDNet |
0.2874 |
0.3158 |
0.1258 |
32.1245 |
3.6589 |
|
Proposed Method |
0.4326 |
0.1895 |
0.0623 |
36.8954 |
3.5612 |
Table 2 shows the performance comparison of different image enhancement methods for VR classroom scenes, including RetinexNet, GLADNet, Zero-DCE, KinD, KinD++, RRDNet, and the U-net-based image enhancement method proposed in this paper. In terms of performance metrics, SSIM measures the structural similarity of images, ABME represents edge error, MSE measures pixel-level error, PSNR assesses image reconstruction quality, and NIQE is a no-reference image quality evaluation metric for assessing the visual quality of images. The results show that the proposed method achieved optimal performance on the key indicators of SSIM, MSE, and PSNR, indicating its superior ability in reproducing structural details, reducing pixel errors, and enhancing image quality over other methods. Especially, the significant improvements in SSIM and PSNR indicate that the effect of image enhancement is closer to the real visual perception of the original scene. Also, relatively good results were obtained on NIQE, showing that the perceptual quality of images was also improved.
A comprehensive analysis of the data in Table 2 leads to a clear conclusion: the U-net-based image enhancement method proposed in this paper shows significant advantages in the application of VR classroom scenes. Compared with other advanced image enhancement methods, the proposed method achieved the best performance on multiple important evaluation metrics, especially in terms of structural preservation and improvement of image quality. This result not only validates the effectiveness of the U-net structure in image enhancement tasks but also demonstrates the success of the authors in optimizing scene layout after improving the SPPF structure in Yolo5.
In Figure 4, it can be observed that with the increase in the number of enhancement processing rounds, the PSNR experiences fluctuations, showing a non-monotonic trend, but overall, as the number of rounds increases, the PSNR value tends to rise. Especially, when the number of rounds increased to 12.5, PSNR reached a significant peak of 28.1, and although there were fluctuations, it reached the highest value of 29.4 at the final round of 17.5, reflecting the gradual improvement in image quality. Moreover, the SSIM indicator steadily increased from the initial 0.923 to the final 0.954, showing that the image enhancement processing steadily improved the structural fidelity of the image with the increase in rounds. The improvement in these two indicators indicates that with the increase in the number of iterations of the enhancement model, both image quality and structural similarity have been improved. From these experimental results, it can be concluded that the image enhancement method based on the U-net network proposed in this paper has a clear enhancement effect on VR classroom scenes. With the application of deep learning algorithms, both the PSNR and structural similarity of images have been improved with the increase in iteration rounds, showing that the method can effectively improve image quality while preserving its structural features.
(a) PSNR
(b) Structural similarity
Figure 4. Result images of image enhancement methods for VR classroom scenes on the test set
In the ablation experiment in Table 3, we can observe the performance of the proposed method in image visualization layout optimization for VR classroom scenes. By comparing the impact of different components, i.e., the removal of the GAM and the Fully Connected Neural Network (FNN) on performance, the complete version of the proposed method showed the best performance on two key indicators: Intersection over Union (IoU) and Boundary Displacement Error (BDE). Specifically, the IoU increased from 0.37 with GAT removed and 0.52 with FNN removed to 0.61 with the proposed method, and the BDE significantly decreased from 103 with GAT removed and 65 with FNN removed to 47. These results indicate that both the GAT and the FNN play an important role in the method proposed in this paper, and their combination significantly enhances the optimization performance of image layout.
Further analysis leads to the conclusion that our method, by integrating the visual graph attention mechanism and innovative loss functions, achieves efficient image style extraction and application in VR classroom scenes, effectively optimizing the design of the visual interface. The effectiveness of this method is not only reflected in the intuitive improvement in performance, where the increase in IoU indicates more accurate identification and separation of areas of interest in the scene, and the decrease in BDE indicates more precise boundary localization. These improvements directly enhance the quality and usability of the final visual layout, confirming the practical value and technical innovation of our method in enhancing VR teaching environments.
Table 4 shows the performance comparison of different methods in the task of image visualization layout optimization for VR classroom scenes. From the table, it is evident that the proposed method outperforms other methods across all evaluation indicators. On the IoU, the proposed method reached 0.61, significantly higher than other methods, indicating that it is more precise in correctly identifying and segmenting areas of interest. Meanwhile, in terms of BDE, the proposed method also performed the best, with only 47, far lower than other methods, meaning more accurate boundary localization and smaller errors. In terms of User Satisfaction Score (Uscore) and User Satisfaction Value (Uvalue), the proposed method reached 4.1 and 81%, respectively. These significant improvements further reflect the advantage of the proposed method in user experience, indicating that the proposed method can achieve high recognition and satisfaction in practical applications.
From these experimental results, it is clear that the proposed method, by combining the visual GAM and innovative loss functions, has achieved significant improvements in the visualization layout optimization of VR classroom scene images. Not only has it surpassed existing methods in accuracy of image processing and precision of boundary localization, but it has also shown great potential in enhancing user satisfaction and practical value.
In this study, multiple algorithms were employed for the visualization layout optimization of VR classroom scene images, and their performance was quantified. In Figure 5, the algorithms compared include E-CNNs, C-GANs, DRLMs, GPU-PSO, and MTL-Fs. With the aid of the visual GAM, the proposed method focuses on extracting color styles from various input images and effectively applying these styles to scene layout optimization. The specific experimental results show that in five different VR classroom scenarios, the proposed method performed excellently in terms of initialization success position and had the highest tracking success rate in all test scenarios. Especially in two weak-texture scenarios, "Historical Space-Time Reproduction" and "Language Learning Interactive Space," the proposed method's average tracking success rate was about 25% and 65% higher than the second-place MTL-Fs, respectively, indicating its exceptional performance and high adaptability in handling complex scenes.
Table 3. Performance comparison of image visualization layout optimization methods for VR classroom scenes in ablation study
|
Method |
IoU↑ |
BDE↓ |
|
Proposed Method-GAT |
0.37 |
103 |
|
Proposed Method-FNN |
0.52 |
65 |
|
Proposed Method |
0.61 |
47 |
Table 4. Performance comparison of different image visualization layout optimization methods for VR classroom scenes
|
Method |
IoU↑ |
BDE↓ |
Uscore↑ |
Uvalue↑ |
|
E-CNNs |
0.34 |
112 |
2.3 |
3% |
|
C-GANs |
0.38 |
109 |
2.6 |
10% |
|
DRLMs |
0.33 |
111 |
2.2 |
5% |
|
GPU-PSO |
0.55 |
85 |
2.8 |
15% |
|
MTL-Fs |
0.54 |
66 |
3.1 |
30% |
|
The Proposed Method |
0.61 |
47 |
4.1 |
81% |
Figure 5. Results of image visualization layout optimization for VR classroom scenes in different scenarios
Figure 6. Effects of image visualization layout optimization for VR classroom scenes in different scenarios
To further evaluate the performance of the proposed algorithms, this study compared the proposed algorithm with two variants: proposed method-GAT and proposed method-FNN, with experimental results shown in Figure 6. The results demonstrate that in the "Historical Space-Time Reproduction" sequence, after turning, both proposed method-GAT and proposed method-FNN were unable to continue tracking, while the proposed algorithm, despite experiencing significant rotational errors during the turn, was still able to maintain tracking, leading to a noticeable trajectory shift. In the "Language Learning Interactive Space" sequence, facing the single texture of white walls and floors, proposed method-GAT and proposed method-FNN showed significant localization errors, clearly evidenced by the red circles in Figure 6. For the "Conceptual Visualization" scenario, proposed method-GAT lost tracking shortly after initialization, and proposed method-FNN lost tracking at the third turn, with only the complete version of the proposed algorithm maintaining stable tracking throughout the sequence. In the dynamic "Simulated Training Lab" scenario, despite rapid turns and motion blur, both proposed method-GAT and proposed method-FNN exhibited good adaptability.
From the analysis, it is evident that the algorithm proposed in this paper has significant advantages in complex VR scenes. Although in weak-texture environments, such as turning scenes, the proposed algorithm still faces challenges, leading to rotational errors and trajectory shifts, overall, its performance remains superior to the variants based on GAT and FNN. This suggests that while the proposed algorithm still requires improvements in handling scenes with complex turns and single-texture features, it has shown strong capabilities in continuous tracking and adapting to dynamic scenes. These results emphasize the importance of considering the diversity of textures and dynamic changes in scenes when designing visualization layout optimization algorithms to improve the robustness and adaptability of the algorithms.
This study proposes a series of innovative methods and models for image quality and layout optimization in VR classroom scenes. First, through an image enhancement generation model based on the U-net network, the quality and detail expression of VR classroom scene images have been significantly improved, offering users a clearer and more immersive visual experience. Second, the study introduces and improves the SPPF structure from Yolo5, optimizing the scene layout efficiency, with experimental results validating the effectiveness of this structure in enhancing scene layout effects. Furthermore, by utilizing a visual GAM and an innovative loss function, the study effectively extracts color styles from input images and applies these styles to visual interface design, improving the aesthetic and visual comfort of the scenes.
In terms of experimental research, this paper conducts detailed ablation experiments and performance comparison experiments. By analyzing the PSNR and SSIM of different VR classroom scene image enhancement methods, the effectiveness of the proposed enhancement method is verified. Additionally, the paper compares the performance of various methods for image visualization layout optimization in VR classroom scenes, providing optimization results in different scenarios, further proving the advantages of the proposed methods.
Overall, the research findings of this paper advance the development of image enhancement and layout optimization for VR classroom scenes at a technical level, holding significant academic and practical value, and serving as a reference for researchers and developers in related fields. However, this study also has certain limitations, such as the need for improved stability and robustness in processing complex dynamic scenes. Future research directions could focus on further improving algorithms to adapt to more diverse and rich VR environments, such as by integrating more advanced deep learning models to enhance the algorithms' generalization capabilities and reducing dependence on high-quality training data. Additionally, exploring the application of the research findings in a wider range of VR application scenarios, such as remote education, virtual tourism, and game design, could help validate and expand the applicability and effectiveness of the proposed method.
[1] Jiang, L., Lu, X. (2023). Analyzing and optimizing virtual reality classroom scenarios: A deep learning approach. Traitement du Signal, 40(6): 2553-2563. https://doi.org/10.18280/ts.400618
[2] Mdaghri-Alaoui, G., Zouhair, A., Elghouch, N. (2023). Employing multi-agent systems to enhance virtual reality platforms. In Proceedings of the 6th International Conference on Networking, Intelligent Systems & Security, pp. 1-5. https://doi.org/10.1145/3607720.3607762
[3] Zhao, C.H., Nie, J.L., Yin, S.W., Zhagn, D.Y., Li, C.M. (2024). Application of virtual reality technology in second language classroom teaching in colleges and universities. Journal of Intelligent & Fuzzy Systems, (Preprint), 46(1): 711-722. https://doi.org/10.3233/JIFS-233210
[4] Liu, Y.T., Cheng, P.Y., Shih, S.P., Huang, T.Y. (2023). MetaClassroom: A WebXR-based hybrid virtual reality classroom. In Proceedings of the 2023 IEEE International Conference on Advanced Learning Technologies, pp. 280-28. https://doi.org/10.1109/ICALT58122.2023.00088
[5] Hu, C., Li, J. (2022). Research on the immersive classroom teaching mode of colleges and universities based on virtual reality. Journal of Sensors, 2022: 3585149. https://doi.org/10.1155/2022/3585149
[6] Zhang, Y., Zi, Y., Wang, J. (2021). An embedded virtual experiment environment system for reality classroom. In 2021 IEEE Conference on Virtual Reality and 3D User Interfaces Abstracts and Workshops (VRW), Lisbon, Portuga, pp. 508-509. https://doi.org/10.1109/VRW52623.2021.00136
[7] Yu, B. (2021). Research on the application of virtual reality technology in English classroom. In 2021 2nd International Conference on Big Data & Artificial Intelligence & Software Engineering (ICBASE), Zhuhai, China, pp. 610-613. https://doi.org/10.1109/ICBASE53849.2021.00120
[8] Wu, W., Lin, J., Jiazeng, Z. (2023). An innovative study on the integration of cross-cultural virtual reality technology in art practice courses. In Lecture Notes in Computer Science (including subseries Lecture Notes in Artificial Intelligence and Lecture Notes in Bioinformatics), Copenhagen, Denmark, 14024: 1-72. https://doi.org/10.1007/978-3-031-35946-0_6
[9] Gu, S., Zhang, S., Miao, Y.J. (2022). Artificial intelligence in construction of english classroom situational teaching mode based on digital twin technology. Wireless Communications and Mobile Computing, 2022: 8357761. https://doi.org/10.1155/2022/8357761
[10] Liu, M. (2023). Complex scene loading optimization based on virtual reality algorithm. In 2023 4th International Conference for Emerging Technology (INCET), Belgaum, India, pp. 1-6. https://doi.org/10.1109/INCET57972.2023.10169932
[11] Dang, P., Zhu, J., Wu, J., Li, W., You, J., Fu, L., Shi, Y., Gong, Y. (2022). A real 3D scene rendering optimization method based on region of interest and viewing frustum prediction in virtual reality. International Journal of Digital Earth, 15(1): 1081-1100. https://doi.org/10.1080/17538947.2022.2080878
[12] Zheng, Y. (2023). Scene optimization technology of digital twin virtual design in environmental art. In Proceedings-2023 IEEE World Conference on Applied Intelligence and Computing, AIC, Sonbhadra, India, pp. 918-922. https://doi.org/10.1109/AIC57670.2023.10263876
[13] Ge, Y. (2021). Surface reconstruction algorithm of 3D scene image based on Virtual Reality Technology. In Proceedings of the 2021 5th International Conference on Electronic Information Technology and Computer Engineering, Xiamen China, pp. 831-835. https://doi.org/10.1145/3501409.3501558
[14] Zhang, D., Meng, F., Li, P., Wang, J., Miao, L., Li, X. (2021). Construction and optimization of simulation environment based on virtual reality. In 2021 3rd International Symposium on Robotics & Intelligent Manufacturing Technology (ISRIMT), Changzhou, China, pp. 176-180. https://doi.org/10.1109/ISRIMT53730.2021.9596901
[15] Zhuang, Z. (2021). Optimization of building model based on 5G virtual reality technology in computer vision software. Mathematical Biosciences and Engineering, 18(6): 7936-7954. https://doi.org/10.3934/mbe.2021393
[16] Jiang, L., Lu, X. (2023). Analyzing and optimizing virtual reality classroom scenarios: A deep learning approach. Traitement du Signal, 40(6): 2553-2563. https://doi.org/10.18280/ts.400618
[17] Xu, C. (2023). Immersive animation scene design in animation language under virtual reality. *SN Applied Sciences, 5(1): 42. https://doi.org/10.1007/s42452-022-05263-x
[18] Pan, J., Deng, X. (2022). Multi-source information art painting fusion interactive 3D dynamic scene virtual reality technology application research. International Journal of Communication Systems, 35(5): e4705. https://doi.org/10.1002/dac.4705
[19] Li, H. (2022). 3D indoor scene reconstruction and layout based on virtual reality technology and few-shot learning. Computational Intelligence and Neuroscience, 2022: 4134086. https://doi.org/10.1155/2022/4134086
[20] Wu, X., Song, J. (2024). 3D modeling and design effect optimization of ceramics using virtual reality. Computer-Aided Design and Applications, 21(S12): 34-48.
[21] Wan, H. (2022). Sensor action recognition, tracking, and optimization analysis in training process based on virtual reality technology. Wireless Communications and Mobile Computing, 2022: 1564390. https://doi.org/10.1155/2022/1564390
[22] Kang, Y., Kim, J. (2024). Animation character generation and optimization algorithm based on computer aided design and virtual reality. Computer-Aided Design and Applications, 21 (S14): 46-62.
[23] Yan, P. (2023). Application of VR virtual reality technology in 3D image interior design system. In 2023 Asia-Europe Conference on Electronics, Data Processing and Informatics (ACEDPI), Prague, Czech Republic, Prague, Czech Republic, 354-358. https://doi.org/10.1109/ACEDPI58926.2023.00075
[24] Liu, D. (2022). Application of virtual reality technology in the visual optimization of print advertisement based on image information mining system. In Proceedings of the 2nd International Conference on Artificial Intelligence and Smart Energy, ICAIS 2022, Coimbatore, India, pp. 641-645. https://doi.org/10.1109/ICAIS53314.2022.9743070