Cihat Aydin![]()
© 2023 IIETA. This article is published by IIETA and is licensed under the CC BY 4.0 license (http://creativecommons.org/licenses/by/4.0/).
OPEN ACCESS
Background: Scanning electron microscopy (SEM) has been instrumental in elucidating material details, enabling the use of SEM images for machine learning applications. This study introduces a novel automated classification model employing deep learning techniques to classify materials using SEM imagery with high accuracy. Materials and Methods: A publicly accessible dataset comprising over 20,000 SEM images across 10 classes was utilized. The dataset was bifurcated into training and testing subsets for model development. The advanced MobileSEMNet model was trained using a pre-trained MobileNetV2 architecture, wherein deep features were extracted via the global average pooling layer. Feature extraction proceeded with fixed-size patch division using the MobileNetV2 network. During feature selection, the neighborhood component analysis (NCA) was employed to distill the most informative 512 features from the feature vector. Subsequently, a classification toolkit determined the Support Vector Machine (SVM) as the optimal shallow classifier. The model was refined using 10-fold cross-validation. Results: The primary aim to surpass the classification accuracy of the standalone MobileNetV2 was achieved; the MobileNetV2 secured a 94.85% accuracy rate, whereas the proposed MobileSEMNet model attained a 96.87% accuracy rate on the test data. Conclusions: MobileSEMNet has proven to be highly effective in the classification of SEM images within a significant dataset, signaling its potential utility in material science. The results unequivocally underscore the model's capacity for automated material type detection, thereby enhancing analytical precision and automation in the field. This work underscores the advantages of deep learning methodologies in advancing material classification in various scientific domains.
MobileSEMNet, MobileNetV2, SEM image processing, deep learning, deep feature engineering
The burgeoning field of nanotechnology is rapidly expanding on a global scale, significantly influencing advancements in a multitude of disciplines [1]. Nanoscience explores phenomena and material behaviors that emerge distinctly at the atomic, molecular, and macromolecular scales, where materials exhibit unique properties. It is widely acknowledged that nanotechnology is central to the technological advancement and societal development of nations [2]. This significance is underpinned by the unique characteristics of matter and energy manifest at the nanoscale. As particles are reduced from macroscopic to nanoscale dimensions, their physical and chemical interactions are altered, often enhancing quantum mechanical properties. This transformation in geometric configurations can lead to substantial changes in material structure. Nanotechnology, therefore, can be defined as the precision engineering conducted within the scale of 0.1 nm to 100 nm [3], offering the capability for the versatile manipulation of materials.
Scanning Electron Microscopes (SEMs) utilize focused electron beams to scan the surfaces of samples [4]. In SEM imaging, the generation of images is achieved by directing high-energy electrons toward the sample, detecting the resultant interactions between the electron beam and the sample atoms, and amplifying these signals for visualization on a cathode ray tube. These high-resolution images reveal the intricate details at nanometer scales, aiding the analysis of scalable surface structures. However, the manual interpretation of SEM images is inherently subjective and labor-intensive. The integration of machine learning models presents a promising avenue for the automation of SEM image classification, substantially enhancing the efficiency and objectivity of the analysis. Deep learning, with its capacity to analyze visual data through multi-layered neural networks, represents a paradigm shift in the classification of complex, high-dimensional SEM image datasets, which are pivotal in fields such as materials science, biology, and nanotechnology. The algorithms within these architectures can automatically discern and learn features inherent to the images for classification purposes. This article endeavors to contribute to this burgeoning field by examining various deep learning architectures for SEM image classification and elucidating their application in domains such as material characterization, biomedical research, and material design. This study aspires to be an instrumental guide for the more accurate and expedient classification of SEM images, thus bolstering their application in scientific and industrial research avenues.
Extensive studies utilizing deep learning and machine learning techniques have been conducted across various fields [5-9]. Dahy et al. [10] classified SEM images of 750 nano-scaled materials using a VGG-19 network augmented with Gray Wolf Optimization, achieving an accuracy of 97.00% and an F1-score of 98.00%. Modarres et al. [11] explored the automatic classification of SEM images through transfer learning, manually categorizing 20,000 images into 10 classes and attaining an accuracy close to 90% on their test dataset. However, they noted a decrease in accuracy with images that featured elements from multiple categories. Aversa et al. [12] applied transfer learning with CNN architectures and adapted ImageNet features to an SEM dataset with fine-tuning, achieving a 73.00% accuracy using AlexNet across 7557 images in 10 classes. Chou et al. [13] combined a decision tree with a neural network to classify defects in chip-scale package images, employing a preprocessing step to quantify various wafer surface features before classification. Dey et al. [14] leveraged VGGNet architectures to classify fractures and line collapses in SEM images. Imoto et al. [15], focusing on semiconductor manufacturing errors, utilized a 33-layer CNN with transfer learning on a dataset of 5388 images across 12 classes, achieving a precision and recall of 88.40%. Cheon et al. [16] reported a 96.2% accuracy in classifying wafer surface defects with a bespoke CNN, despite misclassifying 12 out of 319 defective test images. Barua et al. [17] achieved 99.53% accuracy for four classes and 97.09% for 10 classes using DenseNet201. Lastly, Chang et al. [18] employed a hybrid approach to classify defects, integrating morphological processes and thresholding techniques for high-density defects and developing a simple boundary defect detection algorithm for low-density defects, resulting in 92.80% training accuracy and 86.00% test accuracy.
These literature examples highlight the diversity of deep learning approaches and their transferability to SEM image datasets. However, the optimal transfer of features from general datasets like ImageNet to specialized SEM images remains a challenge, warranting critical analysis to address potential domain gaps. Additionally, discussions on the effect of class imbalances on model performance and strategies to mitigate these effects are conspicuously sparse and warrant further exploration.
1.1 Literature gaps
The identified gaps in the literature, based on the preceding literature review, are articulated as follows:
The majority of machine learning (ML) models surveyed have been applied to datasets with a limited number of classes. The significance of this gap rests in the models' restricted capability to address real-world scenarios that encompass a much broader array of materials. This limitation curtails the scope and practical application of these models, highlighting the need for research into ML models that can handle more complex and varied class scenarios.
The classification performance of the models in question is relatively modest. This gap is of critical importance, as it directly affects the reliability and efficacy of ML models in practical applications. Exploring the underlying causes of this subdued performance and proposing actionable solutions are imperative steps towards bolstering model accuracy. Addressing this gap is essential to augment the credibility of ML models in material classification, thereby encouraging their broader integration across diverse industrial sectors.
To the best of our knowledge, there is an absence of fixed-size patch-based deep learning models tailored to SEM image classification. This gap highlights an innovative opportunity in model architecture that is specifically designed to cater to the distinct characteristics of SEM images. The development of a fixed-size patch-based deep learning model could potentially provide a novel approach to feature extraction and classification accuracy, revolutionizing SEM image classification. Such a model could offer a more potent and flexible solution to the challenges presented by varying image sizes and complexities.
By addressing these gaps, researchers can substantially propel the field of SEM image classification forward. Such advancements would likely result in more sophisticated and versatile ML models, heightened classification performance, and the creation of specialized architectures that are finely attuned to the specificities of SEM images. These improvements would collectively enhance the practicality and impact of these models in the realm of material science and beyond.
1.2 Motivation and our model
Material science stands as a discipline with expansive applications, and an array of models have been proposed by researchers to tackle its inherent challenges. With machine learning models demonstrating notable adeptness in managing non-deterministic problems, their integration into various research fields has surged. The impetus of this study is to unveil a novel machine learning model specifically tailored for the classification of Scanning Electron Microscope (SEM) images. Our approach harnesses the capabilities of the mobile deep learning architecture, MobileNetV2, to train our dataset.
Introducing MobileSEMNet, our model emerges as a deep feature engineering innovation. It is predicated on a patch-based architecture deploying fixed-size patches, a concept inspired by the success of transformers like the Swin Transformer and Vision Transformer, which have shown remarkable prowess in classification through patch utilization.
MobileSEMNet operates by engaging fixed-size patches to meticulously extract features from SEM images. In this dual-input feature extraction process, patches and the overall image serve as the foundational inputs. Deep features are synthesized through the Global Average Pooling (GAP) layer intrinsic to MobileNetV2 and are subsequently combined to craft the final feature vector. The feature selection phase sees the application of Neighborhood Component Analysis (NCA) to distill the most informative features, which then serve as the input for the Support Vector Machine (SVM) classifier.
The rationale behind selecting MobileNetV2 as the cornerstone for MobileSEMNet is anchored in its demonstrated efficiency and classification prowess within the realm of image classification, particularly in scenarios bounded by computational restrictions. With an architecture celebrated for its lightweight design-primarily due to depthwise separable convolutions-MobileNetV2 balances computational frugality with robust classification capabilities, rendering it an exemplary fit for processing voluminous SEM image datasets.
The patch-based methodology integral to MobileSEMNet is an innovative leap from conventional, holistic image processing techniques. This method excels in delineating localized patterns and variances within SEM images, culminating in enhanced precision in material classification tasks. The fusion of deep feature engineering and SVM classification further augments the model's facility to adeptly navigate the multifaceted landscape of material science challenges.
In essence, our MobileSEMNet is a distinct and pioneering model that amalgamates the efficiency of MobileNetV2 with a sophisticated patch-based approach. By leveraging cutting-edge deep learning methodologies, MobileSEMNet is adeptly positioned to fulfill the specialized requirements of SEM image classification within the domain of material science.
1.3 Contributions
This research has yielded several significant contributions:
In this research, we have used a publicly available dataset and this dataset contains 21,272 images with 10 material categories [19]. The images in our used dataset were stored in the widely used JPG format, adopting the RGB color space. Each image uniformly adheres to a resolution of 1024×768 pixels. To facilitate the development and evaluation of our proposed deep learning model, we meticulously curated two distinct datasets from this collection, aptly named 'test' and 'train'. The delineation into training and testing datasets serves a fundamental purpose in the lifecycle of our deep learning model.
The 'train' dataset plays a pivotal role as the foundation for constructing the pretrained network. This network, once trained on the 'train' dataset, becomes a robust and knowledgeable entity capable of capturing intricate patterns and features inherent in the SEM images. Subsequently, this pretrained network is employed to extract deep features from the 'test' dataset, contributing to the model's capacity for nuanced image analysis and classification. We have divided this dataset by using these rules.
The specifics of our dataset, encompassing attributes such as image format, dimensions, and the creation of 'test' and 'train' datasets, are meticulously detailed in Table 1. This tabulation serves as a comprehensive reference, providing a succinct overview of the key characteristics that underpin the structure and composition of our dataset.
As stated from Table 1, we have divided the used public SEM image dataset to ~75:25 training and test ratio.
Table 1. The characteristics of the used SEM image dataset
|
No |
Class |
Train |
Test |
Total |
|
1 |
Biological |
732 |
240 |
972 |
|
2 |
Fibres |
122 |
40 |
162 |
|
3 |
Film-coated surface |
246 |
80 |
326 |
|
4 |
MEMS device and electrodes |
3444 |
1146 |
4590 |
|
5 |
Nanowires |
2868 |
952 |
3820 |
|
6 |
Particles |
2945 |
980 |
3925 |
|
7 |
Pattern surface |
3567 |
1188 |
4755 |
|
8 |
Porous sponge |
137 |
44 |
181 |
|
9 |
Powder |
689 |
228 |
917 |
|
10 |
Tips |
1220 |
404 |
1624 |
|
Total |
15970 |
5302 |
21272 |
|
The recommended MobileSEMNet is a MobileNetV2-based deep feature engineering model. In the first phase of our model, we have trained the training dataset on the MobileNetV2 [20] and we have obtained a pretrained dataset. To extract deep features, GAP layer of the used MobileNetV2 have been used. Fixed size patches have been used. 16 fixed size patches have been created for this model. We have extracted deep features from each patch and the whole SEM image. We have used the whole SEM image to extract global features. The fixed size patches have been used to generate local deep features. The generated 17 feature vectors have been concatenated to create the final feature vector. In the feature selection phase, we aimed to choose the most informative features from the created final feature vector. Therefore, we have used NCA feature selector and the most informative 512 out of the generated 21,760 features (=17×1280). In the last phase, we have classified the selected features using the SVM classifier with 10-fold cross-validation (CV).
The schematic explanation of the proposed MobileSEMNet is demonstrated in Figure 1.
Herein, p is fixed size patch with a size of 56×56 and f is the feature vector with a length of 1280.
To better explain the proposed MobileSEMNet, the steps of this model are:
Step 1: Resize each image to 224×224 sized images.
Step 2: Train the used training dataset using MobileNetV2 and obtain a pretrained CNN.
Step 3: Divide test images into 56×56 sized patches. In this step, 16 patches have been created.
Step 4: Extract deep feature from each test image and patches of them by deploying GAP layer of the pretrained MobilNetV2 and create feature vectors.
$f_1=M(I m, G A P)$ (1)
$\begin{gathered}p_k=\operatorname{Im}(56 \times(i-1)+1: 56 \times i, 56 \times(j-1)+1: 56 \times j,:), \\ j \in\{1,2,3,4\}, i \in\{1,2,3,4\}, k \in\{1,2, \ldots, 16\}\end{gathered}$ (2)
Figure 1. Graphical explanation of the proposed MobileSEMNet
$f_{k+1}=M\left(p_k, G A P\right)$ (3)
Herein, $f$ is the generated feature vector by the GAP layer of the pretrained MobileNetV2 ($M(.,$.)). In Eq. (2), we have mathematically defined the fixed size patch division and $p$ implies the patch with a size of 56×56. By using the GAP layer of the pretrained MobileNetV2, 1280 features have been extracted. Therefore, the length of feature vector is equal to 1280. In this step, we have created.
Step 5: Merge the extracted features to get final feature vector.
$X=\omega\left(f_1, f_2, \ldots, f_{17}\right)$ (4)
Herein, $X$ defines the merged feature vector and we have created the merged feature with a length of 21,760 (=1280×17).
Step 6: Apply NCA [21] to the generated features to select the most informative 512 feature. A brief information about the NCA feature selector has been given below.
NCA is the commonly used feature selector in machine learning and is a distance-based method. Its central aim lies in augmenting classifier performance by selecting the most informative features from the generated features.
The core concept driving NCA revolves around advancing classification accuracy by maximizing the relative similarity among data points belonging to the same class while minimizing the similarity between data points from distinct classes. In essence, NCA seeks a transformation that draws similar data points closer together, while pushing dissimilar data points further apart.
Using the optimization of a differentiable objective function, NCA acquires the transformation matrix that best distinguishes between classes. Characterized as a distance metric learning approach, NCA tries to learn a distance metric that reflects the intrinsic data structure, rendering it particularly suitable for the specific classification task at hand.
NCA has demonstrated success in diverse domains, encompassing computer vision, natural language processing, and bioinformatics. Its adaptability to the data and its proficiency in selecting informative features have rendered it a valuable instrument in bolstering classifier performance and elevating the overall accuracy of machine learning models.
Step 7: Classify the selected features by deploying the SVM [22, 23] classifier with 10-fold cross-validation.
The given seven steps above have been defined the proposed MobileSEMNet. Moreover, we have explained the methods as below.
We selected MobileNetV2 as the basis for MobileSEMNet due to its proven efficiency in image classification tasks, especially in resource-constrained environments. The model's lightweight architecture, utilizing depthwise separable convolutions, strikes a balance between computational efficiency and high-performance classification. This choice was motivated by the need for a model that could handle large SEM image datasets effectively while ensuring computational feasibility.
Global Average Pooling (GAP) layers were employed to extract deep features from SEM images. GAP layers condense spatial information into a single value per feature map, allowing the model to capture essential patterns and features efficiently. This is particularly advantageous in reducing the dimensionality of the feature space, promoting computational efficiency, and preventing overfitting. The choice of GAP layers aligns with the objective of MobileSEMNet to efficiently capture relevant features from SEM images.
The selection of a fixed-size patch with dimensions of 56×56 was deliberate. This choice aims to balance granularity and computational efficiency. A patch size of 56×56 provides sufficient local information for capturing fine-grained details in SEM images while keeping computational demands manageable. This decision was made to strike a pragmatic balance between feature richness and model efficiency.
In the feature selection phase, we opted to choose the most informative features using the NCA feature selector. The selection of precisely 512 features was driven by a desire to strike a balance between informativeness and computational efficiency. This number was chosen to ensure that the selected features encapsulate the most crucial information for accurate classification while avoiding excessive computational overhead.
In the classification phase, we have used SVM since we obtained the best classification performance with Cubic SVM. Moreover, we have used 10-fold cross-validation to get robust results.
Providing this reasoning aims to enhance the transparency of our methodology, showcasing the thoughtful considerations behind each decision. These choices collectively contribute to the effectiveness of MobileSEMNet in addressing the challenges posed by SEM image classification in material science applications.
In this research, we utilized MobileNetV2 as the foundational model and introduced a novel architecture named MobileSEMNet. MobileNetV2 was employed with its default settings, and we conducted training on our designated dataset to acquire a pre-trained model. The development of MobileSEMNet involved the design of a functional structure encompassing dedicated functions for feature extraction, feature selection, and classification. The implementation of the proposed model was carried out using the MATLAB (2023a) programming environment, leveraging both the deep learning designer tool and custom MATLAB files for function creation.
To identify the best classifier for our task, we conducted an extensive comparison using the MATLAB classification learner toolbox, which offers a selection of over 30 classifiers grouped into seven main categories: (i) decision tree (DT) [24], (ii) discriminant (D), (iii) Naive Bayes (NB) [25], (iv) k nearest neighbors (kNN) [26], (v) SVM [27], (vi) Ensemble classifiers (Ens.), and (vii) neural networks (NN) [28]. After assessing the classification outcomes, we found that the Cubic SVM classifier surpassed other classifiers in terms of accuracy. Additionally, we conducted evaluations on various feature selectors, and the most effective feature selection method proved to be NCA. Consequently, NCA was incorporated into this model.
The hyperparameters of the Cubic SVM were set as follows: a 3rd polynomial kernel, a box constraint level of 1, one-vs-all coding, and a 10-fold cross-validation for validation. We have selected these parameters manually. Actually, these parameters are the default parameters of the Cubic SVM in MATLAB classification learner tool. These hyperparameters played a pivotal role in bolstering the performance of the Cubic SVM, facilitating precise classification of the data and rendering it the optimal choice for our MobileSEMNet model.
In scrutinizing the outcomes, we employed widely acknowledged performance evaluation metrics, specifically: (i) overall accuracy, (ii) recall, (iii) precision, and (iv) F1-score. The mathematical formulations of these performance metrics are elucidated below:
$o a c=\frac{t p+t n}{t p+f p+f n+t n}$ (5)
$r e c=\frac{t p}{t p+f n}$ (6)
$p r e=\frac{t p}{t p+f p}$ (7)
$f 1=2 \frac{\text { pre } \times r e c}{\text { pre }+r e c}$ (8)
We have used true positive ($t p$), true negative ($t n$), false positive ($f p$) and false negative ($fn$) values to compute overall accuracy ($o a c$), recall ($rec$), precision ($pre$) and F1-measure ($f 1$). To compute these classification measurements, we generated a confusion matrix based on the predicted output and the actual output. The resulting confusion matrix is depicted in Figure 2.
Figure 2. The computed confusion matrix of the MobileSEMNet
The names of the classes per the given numbers have been given in Table 1.
By using the computed confusion matrix (see Figure 1), we have computed the class-wise and overall results and these results have been tabulated in Table 2.
Table 2. Results (%) of the proposed MobileSEMNet for the used dataset
|
No |
Class |
Recall |
Precision |
F1 |
Accuracy |
|
1 |
Biological |
97.50 |
99.15 |
98.32 |
- |
|
2 |
Fibres |
92.50 |
97.37 |
94.87 |
- |
|
3 |
Film-coated surface |
81.25 |
90.28 |
85.53 |
- |
|
4 |
MEMS device and electrodes |
98.17 |
97.40 |
97.78 |
- |
|
5 |
Nanowires |
96.64 |
97.66 |
97.15 |
- |
|
6 |
Particles |
97.76 |
96.77 |
97.26 |
- |
|
7 |
Pattern surface |
96.97 |
96.16 |
96.56 |
- |
|
8 |
Porous sponge |
84.09 |
92.50 |
88.10 |
- |
|
9 |
Powder |
96.05 |
95.63 |
95.84 |
- |
|
10 |
Tips |
96.29 |
96.77 |
96.53 |
- |
|
Overall |
93.72 |
95.97 |
94.79 |
96.87 |
|
Table 2 demonstrates the overall and class-wise results of the proposed model. Per Table 2, overall recall, precision, f1-score and accuracy of the proposed MobileSEMNet are computed as 93.72%, 95.97%, 94.79% and 96.87% consecutively.
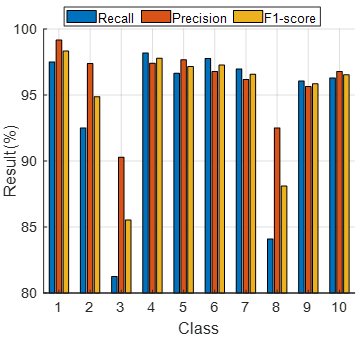
Figure 3. The class-wise results
Figure 4. Performance comparison of the Chi2, ReliefF and NCA feature selectors
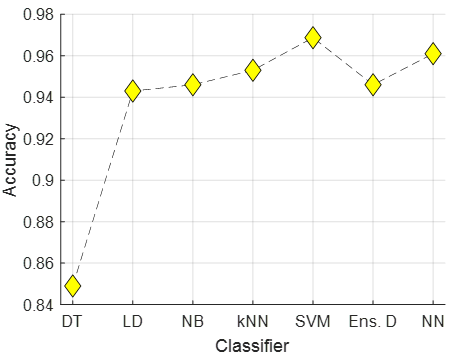
Figure 5. Accuracies of the used classifiers
This research introduces a novel deep feature engineering model named MobileSEMNet, implemented using MobileNetV2. The proposed MobileSEMNet achieved a commendable classification accuracy of 96.87% and an unweighted average recall (UAR) of 93.72% when evaluated on the utilized imbalanced SEM image dataset. Additionally, we present class-wise results, which are depicted in Figure 3.
According to Figure 3 and Table 2, the first class (Biological) achieved the highest precision and F1-score, while the fourth class (MEMS device and electrodes) attained the best recall. Conversely, the third class (Film-coated surface) displayed the weakest performance. Notably, all class-wise test results surpassed 80%, underscoring the MobileSEMNet's impressive capability in SEM image classification.
During the feature generation phase, we employed a patch-based deep feature extraction approach. By utilizing the Neighborhood Component Analysis (NCA) technique, we selected the top 512 features from the pool of 21,760 generated features. The outcomes of this process, specifically the selected features per the patches, are presented in Figure 4. We also conducted tests using other feature selectors, namely NCA, ReliefF, and Chi2. Figure 4 illustrates the classification performances of these selectors for our dataset.
As shown in Figure 4, it is evident that the NCA feature selector yields the best results among all the feature selectors considered. Hence, we have chosen to employ the NCA feature selector in the proposed MobileSEMNet.
For the classification phase, we evaluated the performance of six classifiers: (i) Decision Tree (DT), (ii) Linear Discriminant (LD), (iii) Naive Bayes (NB), (iv) k-Nearest Neighbors (kNN), (v) Support Vector Machine (SVM), (vi) Ensemble Discriminant (Ens. D.), and (vii) Neural Networks (NN). The classification performances of these classifiers have been depicted in Figure 5.
Based on the findings from Figure 5, the SVM classifier emerges as the most effective classifier when utilizing the generated features through MobileSEMNet. Consequently, we have selected SVM as our classifier of choice.
To demonstrate the effectiveness of MobileSEMNet, we conducted a comparison of classification performance between MobileNetV2 and our proposed model. It is important to note that we utilized the pretrained MobileNetV2 to create MobileSEMNet. As a result, we present the training and validation curves of MobileNetV2 for this dataset in Figure 6.
Figure 6. The training and validation curve of the MobileNetV2 for the collected dataset
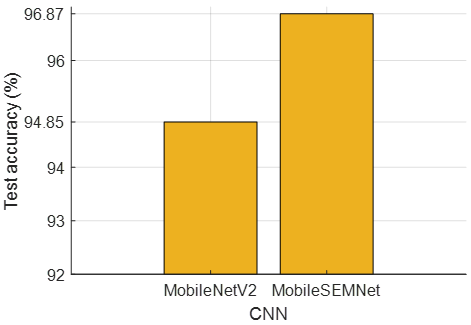
Figure 7. Test accuracies of the MobileNetV2 and MobileSEMNet
As depicted in Figure 6, MobileNetV2 achieved a training accuracy of 100% and a final validation accuracy of 95.47%. Subsequently, we utilized this trained MobileNetV2 to construct the proposed MobileSEMNet. The main purpose of MobileSEMNet is to enhance the classification capability of MobileNetV2. The test accuracies of both models are illustrated in Figure 7.
As depicted in Figure 7, the proposed MobileSEMNet exhibits a notable increase of 2.02% in test accuracy compared to MobileNetV2.
Table 3. Comparisons
|
Study |
Method |
Number of Samples |
Split Ratio |
The Results (%) |
|
Wong et al. [29] |
GoogleNet |
3 classes 456 SEM images |
70:30 |
Accuracy: 92.70 |
|
Azimi et al. [30] |
Fully convolutional neural network, DeCAF features, SVM |
4 classes 4331 patches |
2831 training, 2262 test |
Accuracy: 93.94 |
|
Our proposed model |
MobileNetV2, NCA, SVM |
10 Classes 21,272 SEM Images |
10 fold CV |
MobileSEMNet Accuracy: 96.87 Recall: 93.72 Precision: 95.97 F1-Score: 94.79 |
In order to showcase the high classification performance of MobileSEMNet, we conducted a comprehensive comparison with other state-of-the-art (SOTA) material classification methods. The comparative results have been presented in Table 3.
The comparative evaluation of various models in SEM image (see Table 3) classification reveals insightful findings. Wong et al. [29] implementation using GoogleNet for a dataset comprising 3 classes and 456 SEM images achieved an accuracy of 92.70%, demonstrating commendable performance. Azimi et al. [30] adopted a more complex approach with a Fully Convolutional Neural Network, DeCAF features, and SVM for a dataset containing 4 classes and 4331 patches. Despite the increased complexity, their accuracy reached 93.94%, showcasing the effectiveness of their methodology. In contrast, our proposed MobileSEMNet, employing MobileNetV2, NCA, and SVM for a more extensive dataset of 10 classes and 21,272 SEM images, achieved a notable accuracy of 96.87%, along with high recall, precision, and F1-score values (93.72%, 95.97%, and 94.79%, respectively). This indicates that our model outperforms the aforementioned studies, emphasizing its efficacy in handling a more diverse and extensive SEM dataset. The meticulous design and integration of deep learning features in MobileSEMNet contribute to its superior performance, showcasing its potential for advancing SEM image classification in material science and related domains.
The findings about the experiments of this research have been given below.
- In addition to overall accuracy, we employed several widely recognized performance evaluation metrics to provide a more nuanced understanding of the model's effectiveness. These metrics included: Recall: Measures the ability of the model to correctly identify instances of a particular class. Precision: Reflects the accuracy of the model when it predicts a specific class. F1-Score: Represents the harmonic mean of precision and recall, offering a balanced measure of a model's performance.
- Class-wise results were presented, depicting individual performance metrics for each class. This detailed breakdown highlighted the strengths and weaknesses of the model in classifying different categories. Visual representations, such as Figure 3, provided additional insights into the varying performance across different classes.
- UAR was employed as an additional metric, providing a balanced measure of recall across all classes. This metric is particularly useful when dealing with imbalanced datasets, ensuring that the model's performance is not skewed by the prevalence of any specific class.
- The performance of MobileSEMNet was compared with other state-of-the-art material classification methods, as demonstrated in Table 3. This comparative analysis provided context for evaluating the model's performance against existing benchmarks in the field.
- The training and validation curves of MobileNetV2 for the collected dataset were presented in Figure 6. This representation offered insights into the model's training progress, showcasing the convergence and potential signs of overfitting or underfitting.
- Test accuracies of both MobileNetV2 and MobileSEMNet were illustrated in Figure 7. The comparison highlighted the improvement achieved by MobileSEMNet over MobileNetV2, demonstrating the model's capacity to enhance classification capabilities.
- The selection of the Cubic SVM classifier was based on its superior performance during extensive comparisons. The hyperparameters were carefully chosen to optimize the model's accuracy while mitigating overfitting.
Advantages and limitations of this research are also given below.
Advantages:
- MobileSEMNet achieved a commendable classification accuracy of 96.87% on a diverse SEM image dataset, demonstrating its effectiveness in accurately identifying materials.
- The model provided detailed class-wise results, enabling a nuanced understanding of its performance across different material categories. This information is valuable for applications where specific classes hold more significance.
- The use of the Neighborhood Component Analysis (NCA) technique in feature selection enhanced the model's ability to focus on the most informative features, contributing to its overall classification performance.
- Leveraging MobileNetV2 as the base model ensured a balance between computational efficiency and classification accuracy, making MobileSEMNet suitable for real-world applications with resource constraints.
- The proposed MobileSEMNet demonstrated a notable increase of 2.02% in test accuracy compared to MobileNetV2, showcasing its capability to improve upon the baseline model.
- Patch-based Approach: The patch-based deep feature extraction approach allowed the model to capture fine-grained details in SEM images, enhancing its ability to recognize intricate patterns.
Limitations:
- The MobileSEMNet model is the manual selection of hyperparameters. While the chosen hyperparameters, including a 3rd-degree polynomial kernel, a box constraint level of 1, and one-vs-all coding, contributed to the model's superior performance, the manual selection process introduces subjectivity. Automated hyperparameter optimization techniques, such as grid search or random search, were not employed in this study. The use of automated methods could potentially fine-tune the hyperparameters more objectively, ensuring optimal performance and generalizability across different datasets.
- The dataset used for training and evaluation may exhibit class imbalances, potentially leading to biased results and affecting the model's performance on minority classes.
Our examination of the MobileSEMNet model has yielded notable results, indicating a classification accuracy of 96.87%. Comparative analyses with MobileNetV2 and other state-of-the-art models reveal improved performance, establishing MobileSEMNet as a valuable tool in SEM image classification.
The implications and applications of MobileSEMNet extend into material science research and related domains, offering precision and efficiency for automated material classification across various settings. Specific examples, from materials analysis in manufacturing to geological studies, illustrate the diverse applications where MobileSEMNet can enhance efficiency and accuracy.
Peering into the future, a vast expanse of opportunities lies ahead for the refinement and advancement of MobileSEMNet. Exploring potential enhancements to the model's architecture, investigating alternative deep learning frameworks, and extending adaptability to other image classification types beyond SEM images are promising avenues. Additionally, exploring transfer learning opens potential applications in novel domains.
Acknowledging encountered limitations enriches our findings. Manual hyperparameter selection and challenges in model dataset structure are recognized for improvement. Addressing these limitations in future iterations can enhance the robustness and applicability of MobileSEMNet.
The significance of this work lies in advancing machine learning and image classification, particularly in SEM image analysis. MobileSEMNet introduces a novel deep feature engineering model that utilizes the efficiency of MobileNetV2. Beyond improving classification accuracy, it demonstrates the adaptability of deep learning to material science challenges, extending its potential beyond SEM image classification to broader machine learning applications.
[1] Roco, M.C. (2003). Converging science and technology at the nanoscale: opportunities for education and training. Nature Biotechnology, 21(10): 1247-1249. https://doi.org/10.1038/nbt1003-1247
[2] Jones, M.G., Blonder, R., Gardner, G.E., Albe, V., Falvo, M., Chevrier, J. (2013). Nanotechnology and nanoscale science: Educational challenges. International Journal of Science Education, 35(9): 1490-1512. https://doi.org/10.1080/09500693.2013.771828
[3] Mamalis, A.G., Vogtländer, L.O.G., Markopoulos, A. (2004). Nanotechnology and nanostructured materials: Trends in carbon nanotubes. Precision Engineering, 28(1): 16-30. https://doi.org/10.1016/j.precisioneng.2002.11.002
[4] Zhou, W.L., Apkarian, R., Wang, Z.L., Joy, D. (2007). Fundamentals of scanning electron microscopy (SEM). Scanning Microscopy for Nanotechnology: Techniques and Applications, 1-40. https://doi.org/10.1007/978-0-387-39620-0_1
[5] Tasci, I., Tasci, B., Barua, P.D., Dogan, S., Tuncer, T., Palmer, E.E., Fujita, H., Acharya, U.R. (2023). Epilepsy detection in 121 patient populations using hypercube pattern from EEG signals. Information Fusion, 96: 252-268. https://doi.org/10.1016/j.inffus.2023.03.022
[6] Tasci, G., Gun, M.V., Keles, T., Tasci, B., Barua, P.D., Tasci, I., Dogan, S., Baygin, M., Palmer, E.E., Tuncer, T., Ooi, C.P., Acharya, U.R. (2023). QLBP: dynamic patterns-based feature extraction functions for automatic detection of mental health and cognitive conditions using EEG signals. Chaos, Solitons & Fractals, 172: 113472. https://doi.org/10.1016/j.chaos.2023.113472
[7] Tasci, B., Tasci, G., Dogan, S., Tuncer, T. (2022). A novel ternary pattern-based automatic psychiatric disorders classification using ECG signals. Cognitive Neurodynamics, 1-14. https://doi.org/10.1007/s11571-022-09918-8
[8] Macin, G., Tasci, B., Tasci, I., Faust, O., Barua, P.D., Dogan, S., Tuncer, T., Tan, R.S., Acharya, U.R. (2022). An accurate multiple sclerosis detection model based on exemplar multiple parameters local phase quantization: ExMPLPQ. Applied Sciences, 12(10): 4920. https://doi.org/10.3390/app12104920
[9] Tatli, S., Macin, G., Tasci, I., Tasci, B., Barua, P.D., Baygin, M., Tuncer, T., Dogan, S., Ciaccio, E.J., Acharya, U.R. (2024). Transfer-transfer model with MSNet: an automated accurate multiple sclerosis and myelitis detection system. Expert Systems with Applications, 236: 121314. https://doi.org/10.1016/j.eswa.2023.121314
[10] Dahy, G., Soliman, M.M., Alshater, H., Slowik, A., Hassanien, A.E. (2023). Optimized deep networks for the classification of nanoparticles in scanning electron microscopy imaging. Computational Materials Science, 223: 112135. https://doi.org/10.1016/j.commatsci.2023.112135
[11] Modarres, M.H., Aversa, R., Cozzini, S., Ciancio, R., Leto, A., Brandino, G.P. (2017). Neural network for nanoscience scanning electron microscope image recognition. Scientific Reports, 7(1): 13282. https://doi.org/10.1038/s41598-017-13565-z
[12] Aversa, R., Coronica, P., De Nobili, C., Cozzini, S. (2020). Deep learning, feature learning, and clustering analysis for SEM image classification. Data Intelligence, 2(4): 513-528. https://doi.org/10.1162/dint_a_00062
[13] Chou, P.B., Rao, A.R., Sturzenbecker, M.C., Wu, F.Y., Brecher, V.H. (1997). Automatic defect classification for semiconductor manufacturing. Machine Vision and Applications, 9: 201-214. https://doi.org/10.1007/s001380050041
[14] Dey, B., Goswami, D., Halder, S., Khalil, K., Leray, P., Bayoumi, M.A. (2022). Deep learning-based defect classification and detection in SEM images. In Metrology, Inspection, and Process Control XXXVI, SPIE, PC120530Y. https://doi.org/10.1117/12.2622550
[15] Imoto, K., Nakai, T., Ike, T., Haruki, K., Sato, Y. (2019). A CNN-based transfer learning method for defect classification in semiconductor manufacturing. IEEE Transactions on Semiconductor Manufacturing, 32(4): 455-459. https://doi.org/10.1109/TSM.2019.2941752
[16] Cheon, S., Lee, H., Kim, C.O., Lee, S.H. (2019). Convolutional neural network for wafer surface defect classification and the detection of unknown defect class. IEEE Transactions on Semiconductor Manufacturing, 32(2): 163-170. https://doi.org/10.1109/TSM.2019.2902657
[17] Barua, P.D., Dogan, S., Kavuran, G., Tuncer, T., Tan, R.S., Rajendra Acharya, U. (2023). NFSDense201: microstructure image classification based on non-fixed size patch division with pre-trained DenseNet201 layers. Neural Computing and Applications, 35(30): 22253-22263. https://doi.org/10.1007/s00521-023-08825-1
[18] Chang, C.F., Wu, J.L., Wang, Y.C. (2013). A hybrid defect detection method for wafer level chip scale package images. International Journal on Computer, Consumer and Control, 2(2): 25-36.
[19] Aversa, R., Modarres, M.H., Cozzini, S., Ciancio, R., Chiusole, A. (2018). The first annotated set of scanning electron microscopy images for nanoscience. Scientific Data, 5(1): 1-10. https://doi.org/10.1038/sdata.2018.172
[20] Sandler, M., Howard, A., Zhu, M.L., Zhmoginov, A., Chen, L.C. (2018). MobileNetV2: inverted residuals and linear bottlenecks. In 2018 IEEE/CVF Conference on Computer Vision and Pattern Recognition (CVPR), 4510-4520. https://doi.org/10.1109/CVPR.2018.00474
[21] Goldberger, J., Hinton, G.E., Roweis, S., Salakhutdinov, R.R. (2004). Neighbourhood components analysis. Advances in Neural Information Processing Systems, 17.
[22] Vapnik, V. (1998). The support vector method of function estimation. In Nonlinear Modeling: Advanced Black-box Techniques, 55-85. https://doi.org/10.1007/978-1-4615-5703-6_3
[23] Vapnik, V. (1999). The nature of statistical learning theory. Springer Science & Business Media. https://doi.org/10.1007/978-1-4757-2440-0
[24] Friedl, M.A., Brodley, C.E. (1997). Decision tree classification of land cover from remotely sensed data. Remote Sensing of Environment, 61(3): 399-409. https://doi.org/10.1016/S0034-4257(97)00049-7
[25] Saritas, M.M., Yasar, A. (2019). Performance analysis of ANN and naive bayes classification algorithm for data classification. International Journal of Intelligent Systems and Applications in Engineering, 7(2): 88-91. https://doi.org/10.18201//ijisae.2019252786
[26] Peterson, L.E. (2009). K-nearest neighbor. Scholarpedia, 4(2): 1883. https://doi.org/10.4249/scholarpedia.1883
[27] Hearst, M.A., Dumais, S.T., Osuna, E., Platt, J., Scholkopf, B. (1998). Support vector machines. IEEE Intelligent Systems and Their Applications, 13(4): 18-28. https://doi.org/10.1109/5254.708428
[28] Wang, S.C. (2003). Artificial neural network. Interdisciplinary Computing in Java Programming, 81-100. https://doi.org/10.1007/978-1-4615-0377-4
[29] Wong, C.H., Ng, S.M., Leung, C.W., Zatsepin, A.F. (2022). The effectiveness of data augmentation of SEM images on a small database based on deep-learning intelligence. Brazilian Journal of Physics, 52(2): 59. https://doi.org/10.1007/s13538-021-01008-0
[30] Azimi, S.M., Britz, D., Engstler, M., Fritz, M., Mücklich, F. (2018). Advanced steel microstructural classification by deep learning methods. Scientific Reports, 8(1): 2128. https://doi.org/10.1038/s41598-018-20037-5