Hai Sun![]()
© 2023 IIETA. This article is published by IIETA and is licensed under the CC BY 4.0 license (http://creativecommons.org/licenses/by/4.0/).
OPEN ACCESS
In the dynamic field of digital image technology, the imperative role of Image Quality Assessment (IQA) is increasingly recognized. Traditional methodologies, designed to echo human visual processing, frequently encounter challenges in diverse application landscapes, primarily due to their singular focus on limited scale and level analysis. This shortcoming curtails their efficacy in practical scenarios. The incorporation of deep learning paradigms into IQA has notably enhanced evaluation capabilities. Yet, there remains a scope for refinement, especially in areas like integrating multi-scale data, fusing features at multiple levels, and optimizing computational resources. Addressing these gaps, this study proposes an advanced multi-level and multi-scale IQA strategy, harnessing the power of deep learning. A unique end-to-end multi-scale IQA module has been crafted, tailored to aggregate image quality data across a spectrum of scales comprehensively. Additionally, this research introduces an IQA model built upon the foundation of multi-level feature fusion. This innovative model stands out in its capacity to efficiently assess image quality, by adeptly extracting and amalgamating features from various levels. Beyond enhancing accuracy in quality scoring, this approach significantly bolsters the model's interpretability and operational efficiency, marking a stride forward in digital image processing research and applications.
image quality assessment, deep learning, multi-level feature fusion, multi-scale analysis, end-to-end model
In today's rapidly evolving digital imaging landscape, IQA has emerged as a pivotal discipline at the intersection of technology and visual fidelity. Propelled by the swift advances in image acquisition and transmission technologies, coupled with an escalating demand for high-quality visual experiences, the evolution of IQA methods has gained considerable momentum [1-4]. Historically, IQA approaches have been rooted in emulating human visual perception, a strategy that has served well up to a point. Yet, the advent of deep learning has marked a transformative chapter in IQA's story. These modern, deep learning-infused models have revolutionized the field, bringing an unprecedented level of accuracy and a broader scope of application to IQA processes [5-9]. Nevertheless, as the spectrum of applications continues to diversify, the limitations of traditional single-scale or level-based IQA become increasingly apparent, signaling a need for more sophisticated methods that embrace multi-level and multi-scale considerations.
IQA's role extends far beyond refining image processing algorithms; it is integral to providing objective, high-precision quality feedback for automated systems. These evaluations are key in guiding pivotal processes like image optimization, compression, and transmission [10-14]. Multi-level and multi-scale assessment strategies offer a more comprehensive emulation of the human visual system, thereby enhancing the sensitivity and adaptability of IQA. This breadth of application is particularly valuable in specialized areas such as medical imaging, satellite imagery, and the ever-expanding domain of internet multimedia content [15, 16].
Despite the significant advancements brought about by deep learning in the realm of IQA, there remains room for enhancement in current methodologies. Many of these methods are still confined to single-scale assessments, neglecting the complex interplay of quality variations across different scales and their collective impact on overall perception [17-20]. Furthermore, prevailing models often adopt a simplistic approach to feature fusion, failing to fully harness the synergistic potential inherent in multi-level features. This oversight often results in a compromised performance in more complex scenarios. Additionally, modern IQA models tend to rely on intricate post-processing steps, which not only increase the computational burden but also raise the barrier to their practical application [21-24].
This study introduces a novel, deep learning-based methodology for multi-level, multi-scale IQA. At its heart lies an ingeniously designed end-to-end multi-scale IQA module, comprising both a multi-scale image block encoding submodule and a multi-scale quality prediction submodule. This design ensures a thorough and comprehensive integration of image quality information across a wide range of scales. In parallel, the study has carefully pieced together an IQA model based on multi-level deep feature fusion. This model integrates a feature extraction module, a multi-level feature aggregation module, a multi-scale IQA module, and a prediction head, all working in concert to harness and capitalize on features from various levels. The approach taken in this study not only guarantees enhanced accuracy in quality scoring but also significantly bolsters the model’s interpretability and computational efficiency. This advancement represents a significant leap forward, setting new standards for future research and practical applications in the vibrant and ever-changing landscape of digital image processing.
The pursuit of multi-level and multi-scale IQA is not just an endeavor to refine the precision and adaptability of evaluations; it profoundly resonates with the nuanced demands for image quality across diverse application landscapes, solidifying its vital presence in the domain of image processing. Take, for instance, the realm of medical image analysis, where the fidelity of images is a linchpin for accurate diagnostics. Medical imagery, encompassing a spectrum of anatomical structures and pathologies, presents each imaging technique, such as computed tomography (CT), X-ray, or magnetic resonance imaging (MRI), with its distinct scale and complexity. Here, the adoption of multi-level and multi-scale assessment methodologies becomes paramount. Such nuanced evaluation not only faithfully captures the intricate details and textures of various tissues but also markedly heightens the precision and reliability of disease detection. Similarly, in the arena of remote sensing, the diversity of land cover and the myriad of observational conditions render images with a rich tapestry of scales and levels. A comprehensive, finely-tuned quality assessment framework becomes a cornerstone in this context. It significantly amplifies the efficiency of subsequent image processing stages, including denoising, enhancement, and classification. This is not just a technical accomplishment; it bears profound implications for applications spanning geographic information systems, environmental monitoring, and resource management, thereby intertwining technology with the tapestry of the planet's well-being.
In the real-world milieu, image quality emerges not merely from pixel-level distortions but also from the elaborate interplay of structural information and content layers. Traditional single-scale assessment approaches, often myopic in their scope, stumble in capturing the full gamut of quality variations across different scales. Consequently, this study meticulously addresses the complex and different requirements for image quality in real-world applications, leading to the conceptualization of an end-to-end multi-scale IQA module.
This proposed module comprises two fundamental submodules: the multi-scale image block encoding submodule and the multi-scale quality prediction submodule. The function of the multi-scale image block encoding submodule is the simultaneous extraction of features across various levels, ensuring comprehensive capture of all elements influencing image quality. The multi-scale quality prediction submodule, tasked with quality scoring, relies on features derived from the multi-scale image block encoding submodule for independent assessment of image quality at each scale. Additionally, a multi-scale quality score fusion submodule amalgamates quality predictions across different scales to derive an overall image quality score, thereby guaranteeing that the final score encapsulates quality information pertinent to all relevant scales.
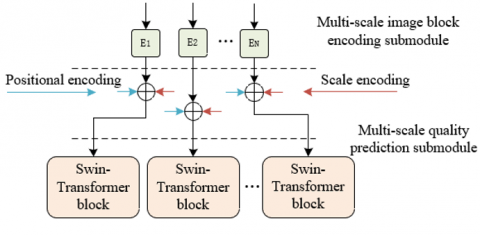
Figure 1. Schematic of the multi-scale image block encoding submodule
Figure 1 delineates the structure of the multi-scale image block encoding submodule, which utilizes convolutional encoding for direct image processing. In the field of deep learning, especially within Convolutional Neural Networks (CNNs), convolutional layers have been recognized as efficient feature extractors, autonomously discerning image features across a spectrum from basic to advanced levels. Unlike traditional methods that encode image blocks of uniform size, convolutional operations obviate the necessity for manually determining the dimensions and configurations of feature vectors, thereby adapting to optimally represent data-derived features. As convolutional layers become more profound within the network, there is an extraction of increasingly higher-level semantic information, coupled with the ability to encode images at various scales through differing receptive field sizes. Specifically, the image encoding process commences with the first four layers of a pretrained Residual Neural Network (ResNet) 50 for initial feature extraction. This is succeeded by a projection of the channel numbers of the feature map through convolutional layers equipped with 1x1 kernels. The framework of this multi-scale image block encoding submodule is thus presented in Figure 1, with the process encapsulated as follows:
$D_{U R}=\operatorname{Conv}_{1 \times 1}\left(\operatorname{RestNet}_{50}(A)\right)$ (1)
In practical IQA contexts, diverse application environments may exhibit distinct sensitivities and requirements concerning attributes such as texture detail, edge sharpness, and local image contrast. By implementing spatial pooling layers of varying dimensions, the model is endowed with the capability to discern image features across different resolution levels. The output feature map of each pooling layer represents a unique local area size, essentially corresponding to image blocks at varying scales. Thus, in order to detect subtle disparities in image quality and to conduct a thorough assessment of overall quality through multi-scale information, this study incorporates multiple spatial pooling layers in parallel. Assuming the image block encoding feature map subsequent to the $u$-th spatial pooling operation is denoted by $E_u \in E^{F^* G u^* Q u}$, where $E_u$ corresponds to the quantity $G u^* Q u$ of image blocks, the ensuing expression is articulated:
$E_u=$ Spacepooling $_u\left(D_{U R}\right)$ (2)
In real-world IQA scenarios, understanding the spatial interplay between localized regions (i.e., image blocks) of an image is imperative for comprehending the integrity of image content and for assessing its quality. To develop a model capable of precise IQA, it is essential not only to encode image blocks at the feature level but also at the positional level. Accordingly, in the multi-scale quality prediction submodule formulated in this study, positional encoding is implemented, and a learnable positional encoding matrix $L \in E^{H^* H}$ is established. The incorporation of positional encoding to each image block aids in preserving the spatial relationships inherent in the original image, a critical factor for maintaining structural information and comprehending the spatial context of the image. The establishment of a learnable positional encoding matrix facilitates the model's autonomous learning of the optimal representation of positional information during the training phase. Such a representation further refines the utilization of positional information tailored to specific IQA tasks. Assuming the original position of each image block is denoted as (u,k), and the corresponding position in the positional encoding matrix L as (lu,lk), it is postulated that the feature map $E_u \in E^{F^* G u^* Q u}$ of image blocks at the u-th scale is proportionally projected to (lu,lk), delineated by the following expression:
$\frac{u}{G_u}=\frac{l_u}{H}, \frac{k}{Q_u}=\frac{l_k}{H}$ (3)
Figure 2. Schematic introduction of positional encoding and scale encoding
In the field of IQA, diverse scales provide insights into varying aspects of an image's quality. For instance, finer scales are adept at capturing sharp edges and intricate textures, whereas coarser scales predominantly focus on overarching structure and regional contrast. Consequently, to achieve accurate IQA, it is imperative to harness information from these various scales comprehensively. In this study's multi-scale quality prediction submodule, scale encoding has been integrated, enabling the model to discern and exploit features from distinct scales effectively. Figure 2 illustrates this integration of positional and scale encoding. The multi-scale quality prediction submodule is comprised of two key components: B parallel Swin-Transformer blocks and B parallel regression layers. The Swin-Transformer's parallel configuration facilitates simultaneous processing of image blocks across multiple scales, capturing the unique features pertinent to each scale independently. Subsequent to the Swin-Transformer blocks are the parallel regression layers, tasked with transposing the extracted features onto a quality score. Each regression layer is tailored to a specific scale, focusing on processing features of that scale and independently producing a quality prediction. Figures 3 and 4 respectively depict the framework of the multi-scale quality prediction submodule and the interconnection schematic of two Swin-Transformer blocks.
Figure 3. Framework of multi-scale quality prediction submodule
Figure 4. Connection schematic of two Swin-Transformer blocks
The conventional self-attention mechanism in image processing is employed to compute relationships between pixels or features on a global scale, effectively capturing the overarching dependencies within an image. However, this approach is frequently accompanied by substantial computational demands. The Swin-Transformer, an innovation in this domain, enhances efficiency by localizing self-attention computations within small windows. Despite this, such a design may potentially restrict the global perceptual capabilities of the features. To mitigate this, the Swin-Transformer adopts a shifting window strategy. This strategy involves alternating the positions of windows across different layers, enabling each window to encompass information from its adjacent counterparts and thus promoting the flow of information between local windows. Such a methodology empowers the model to grasp a more extensive contextual scope while preserving computational efficiency, focusing on the global features of the image. In mathematical terms, let $(W, J, N)=U\left(Q_W, Q_J, Q_N\right)$, where $Q_W, Q_J, Q_N \in R^{f^* f}$, and the learnable relative position bias be denoted as $Y \in E^{v^* v}$. For an input $U \in R^{v^* f}$, the self-attention mechanism within the Swin-Transformer is articulated as follows:
$T X(W, J, N)=\operatorname{Softmax}\left(\frac{W J^S}{\sqrt{f}}+Y\right) N$ (4)
Let $H E_u={T X}\left(W_u, J_u, N_u\right)$, where HE signifies the head, and the concatenation of $j$ heads is accomplished using the Concant function, with $Q_z \in R^{3 f^* f}$. The corresponding multi-head self-attention mechanism is thus represented by:
$\operatorname{LGTX}(U)=\operatorname{Concant}\left(H E_1, \cdots, H E_j\right) Q_Z$ (5)
The layer normalization is denoted by LN, with MHSA characterizing the multi-head self-attention mechanism within regular windows, indicated by the subscript WIN, and the multi-layer perceptron is symbolized as MLP. For an input A1, the Swin-Transformer process, predicated on regular window division, is expressed through the following equations:
$B_1=A_1+L G T X_{W I N}\left(L N\left(A_1\right)\right)$ (6)
$C_1=B_1+M L P\left(L N\left(B_1\right)\right)$ (7)
Furthermore, the Swin-Transformer process, predicated on shifting window division, is represented by:
$C_2=B_2+M L P\left(L N\left(B_2\right)\right)$ (8)
In this research, an IQA model predicated on multi-level deep feature fusion has been further developed. The model has four principal components: a feature extraction module, a multi-level feature aggregation module, a multi-scale IQA module, and a prediction head. The feature extraction module extracts useful visual features from the input images. The multi-level feature aggregation module weaves features from disparate levels, which are extracted by the feature extraction module. Utilizing the features extracted and amalgamated by the previous two modules, the multi-scale IQA module predicts the quality of image blocks across various scales. The prediction head is the output layer of the model, and integrates all information obtained from the antecedent modules, generating the final image quality score.
Underpinning this entire process is the Vision Transformer network, distinguished by its shared weights and a self-attention mechanism. This mechanism is vital for unearthing high-level, semantically-rich features. It's this innovative approach that enables the model to process long-distance pixel dependencies. Simultaneously, it is adept at discerning lower-level features such as color, shape, and texture. The network makes a global comparison of image blocks through self-attention, synthesizing information across the entire image rather than being confined to local regions. This global overview is very important for a comprehensive assessment of an image's overall visual quality. For practical implementation, assume the reference image is denoted by $U_{R E F} \in R^{G^* Q^* Z}$, and the distorted image by $U_{D I S} \in R^{G^* Q^* Z}$, where $G$ and $Q$ represent the image's length and width, respectively, and $Z$ its channel number. Both $U_{R E F}$ and $U_{D I S}$ are fed into a dual-path Vision Transformer network, from which feature representations are extracted from the $u$-th layer, designated as $d^{D I S_3}, d^{D I S_5}, d^{D I S_7}$, $d^{D I S_9}, d^{D I S_{11}}, d^{D I S_3}, d^{D I S_5}, d^{D I S_7}, d^{D I S_9}$, and $d^{D I S_{11}}$. Figure 5 illustrates the framework of the feature extraction module. In the proposed methodology, it is posited that the feature maps extracted are denoted by dDISu and dDISu. To ascertain the perceptual disparity between pairs of these feature maps, a process involving residual operations is employed, leading to the derivation of the difference map, referred to as dDIFFu.
$d_u^{D I F F}=d_u^{E R F}-d_u^{D I S}$ (9)
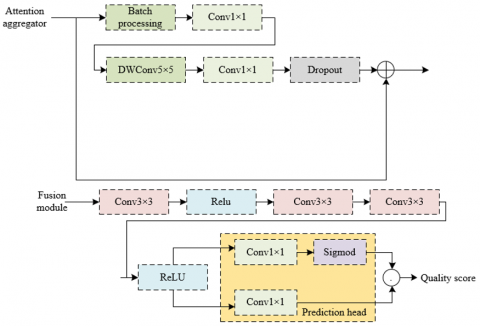
The multi-level feature aggregation module is composed of an attention aggregator, a concatenation module, and a fusion module. The attention aggregator selects the most informative elements from the plethora of features extracted. This precision in selection is followed by the concatenation module, which amalgamate features from diverse levels and scales effectively. The fusion module merges the outputs from both the attention aggregator and the concatenation module.
The initiation of the attention aggregator’s operation is marked by the implementation of a batch normalization layer. This layer ensures that the input features are standardized. This standardization is particularly crucial in the domain of IQA, enhancing the model's competence to generalize across various datasets and different levels of image quality. Following this preparatory step are the two 1x1 convolution layers. These layers modify the depth of the feature maps, facilitating cross-channel information integration while maintaining the spatial dimensions. This approach not only trims down the number of parameters but also boosts computational efficiency, allowing the model to delve into the complex interplay of features. Such a sophisticated arrangement proves instrumental in the realm of IQA, where the model is endowed with the capability to grasp and utilize an array of distortion features, thereby crafting feature representations that are not only rich but also distinct in character.
The process then leads to the 5x5 depth convolution layer, where a wider receptive field is covered, allowing for the capture of expansive contextual information. The culmination of this process is the introduction of a dropout layer, aimed at preventing overfitting. This involves a randomized exclusion of certain neuron outputs during training, compelling the model to develop more robust feature representations, a necessity for generalization across a variety of image types and distortion categories.
In the IQA model's multi-level feature aggregation module, the fusion module's design is constituted by three layers of 3x3 convolution layers and two layers of Rectified Linear Unit (ReLU) activation layers. The 3x3 convolution layer, a standard element in convolutional neural networks, is primarily utilized for capturing local features. As image quality is often influenced not just by original pixel values but also by higher-level visual patterns, the stacking of multiple convolution layers facilitates the gradual amalgamation of low-level features into more complex feature representations. The alternation between convolution and ReLU activation layers enables more effective learning and integration of features at various levels. This strategy of interlayer fusion contributes to the formation of a comprehensive feature representation, essential for precise IQA. Figure 6 illustrates the structure of both the attention aggregator and the fusion module.
Figure 5. Framework of the feature extraction module
Figure 6. Structure of the attention aggregator and fusion module
It is assumed that the output of the attention aggregator, concatenated along the channel dimension, is denoted as $\tilde{D}_{A L L}$ while DFU represents the output of the multi-level feature aggregation module. The entire process of the multi-level feature aggregation module is encapsulated as follows:
$d_u^{\overline{D I F F}}=B N\left(d_u^{D I F F}\right)$ (10)
$d_u^{\overline{D I F F^*}}=\operatorname{Conv} 2\left(F Q \operatorname{Conv}\left(\operatorname{Conv} 1\left(d_u^{\overline{D I F F}}\right)\right)\right)$ (11)
$\tilde{F}_i=\operatorname{Dropout}\left(f_i^{\overline{d_i ff^*}}\right)+f_i^{d i f f}$ (12)
$\tilde{D}_u=\operatorname{Dropout}\left(d_u^{\overline{\text { DIFF* }}}\right)+d_u^{\text {DIFF }}$ (13)
$\tilde{D}_{A L L}=\operatorname{Concat}\left[\tilde{D}_3, \tilde{D}_5, \tilde{D}_7, \tilde{D}_9, \tilde{D}_{11}\right]$ (14)
$D_{F U}=\operatorname{ReLU}\left(\operatorname{Conv} 5\left(\operatorname{Conv} 4\left(\operatorname{ReLU}\left(\operatorname{Conv} 3\left(\tilde{D}_{A L L}\right)\right)\right)\right)\right)$ (15)
The feature maps extracted via the Vision Transformer are replete with information, each pixel corresponding to a specific partition of the input image and containing unique visual data. Simple max pooling or average pooling operations, while reducing dimensions, might lead to the loss of vital information, especially in tasks requiring detailed perception like IQA. Consequently, this study implements a dual-branch prediction head strategy for predicting visual quality scores. In this structure, one branch predicts quality scores for each pixel of the feature map, and the other calculates the weight of each pixel. The final visual quality score of the image is obtained by combining pixel-level scores with their respective weights, thereby amalgamating local and global information and minimizing potential information loss inherent in single pooling strategies.
For enhanced accuracy in prediction scores, the IQA model employs a joint loss function comprising mean squared error (MSE) loss, ordinal loss, and Kullback-Leibler (KL) divergence loss. The MSE loss LOSSLTR is employed as a fundamental metric for gauging the difference between predicted and actual values, serving as the primary loss function for regression tasks within IQA. The minimization of the MSE between predicted quality scores and actual quality scores aids in aligning the model's output with standard quality scores, pivotal for the precision of point estimations. Supposing the predicted score and MOS value for the u-th image are represented by Lu and $\hat{L}_u$, respectively, the standard MSE function by MSE( ), and the quantity of images by V, the loss function is defined thus:
$\operatorname{LOSS}_{\text {LTR }}=\sum_{u=1}^V \operatorname{MSE}\left(L_u, \hat{L}_u\right)$ (16)
In the methodological framework of IQA, the KL divergence loss, designated as LOSSJM, is employed to quantify the discrepancy between the distribution predicted by the model and the target distribution. Particularly in IQA contexts, where quality scores are interpreted as probability distributions, KL divergence is instrumental in ensuring that the model effectively captures the probabilistic attributes of data, such as the subjective scoring distribution of users evaluating image quality. This approach facilitates the model's proficiency in predicting image quality scores that align with human perception. It is posited that the outputs of the Softmax regression are symbolized by W and $\hat{W}$, leading to the definition of LOSSJM as:
$L O S S_{J M}=K L(W \| \hat{W})=\sum_{u=1}^V W \times \log \frac{W}{\hat{W}}$ (17)
The expressions for $W$ and $\hat{W}$ are delineated as:
$\hat{W}=\frac{e^{\hat{L}_u}}{\sum_{u=1}^V e^{\hat{L}_u}}$ (18)
$W=\frac{e^{L_u}}{\sum_{u=1}^V e^{L_u}}$ (19)
The IQA model incorporates ordinal loss, referred to as LOSSRA, to guarantee that the predicted rankings adhere to the inherent order of quality scores. This aspect is particularly crucial in IQA tasks since quality scores inherently possess an orderliness, with higher quality images expected to garner higher scores. Ordinal loss steers the model towards understanding the relative differences in image quality, thus augmenting the precision of rankings. In scenarios involving distorted images Uu and Uk, a minor stabilizing term is denoted by $\gamma$, and a penalty term by ω. The pairwise ordinal loss LOSSe(Uu,Ulk) is formulated to evaluate their ranking order:
$\operatorname{LOSS}_e\left(U_u, U_k\right)=\operatorname{MAX}\left(0, \frac{-\left(\hat{L}_u-\hat{L}_k\right)\left(L_u-L_k\right)}{\left|\hat{L}_u-\hat{L}_k\right|+\gamma}\right) \times \omega$ (20)
$\omega=\left(L_u-\hat{L}_u\right)^2+\left(L_u-\hat{L}_u\right)^2$ (21)
The comprehensive ordinal loss LOSSRA is articulated in the following equation:
$\begin{aligned} & \operatorname{LOSS}_{R A}=M_e\left(U_1, U_2\right)+M_e\left(U_1, U_3\right)+\ldots+M_e\left(U_1, U_V\right) \\ & +M_e\left(U_2, U_3\right)+M_e\left(U_2, U_4\right)+\ldots+M_e\left(U_2, U_V\right) \\ & +\ldots \\ & +M_e\left(U_u, U_{u+1}\right)+M_e\left(U_u, U_{u+2}\right)+\ldots+M_e\left(U_u, U_V\right) \\ & +\ldots \\ & +M_e\left(U_{V-1}, U_V\right)\end{aligned}$ (22)
Assuming that the hyperparameters for weight adjustment are represented by $\beta, \alpha$, and $\varepsilon$, the joint loss function is constructed as the weighted sum of three components: $\operatorname{LOSS}_{L T R}, \operatorname{LOSS}_{J M}$, and $L O S S_{R A}$, as indicated:
$L O S S_{T A}=\beta M_{L T R}(L, \hat{L})+\alpha M_{J M}(W, \hat{W})+\varepsilon M_{R A}$ (23)
Table 1 illustrates the datasets employed for training and evaluating the performance of the IQA model. These datasets encompass a diverse range of image types, distortion types, and levels, along with corresponding subjective score categories. Included are natural scene images, artificial scene images, medical images, remote sensing images, and synthetic images. This variety ensures comprehensive coverage of application scenarios, thereby aiding in the enhancement of the model's generalizability. Notably, the datasets exhibit a wide range of distortion levels, from 27 to 38, indicating that the model is required to discern and categorize a spectrum of image quality degradations, from minor to severe. The abundance of distorted images, substantially outnumbering the reference images, is due to the generation of multiple distorted variants from each reference image. These variants, each featuring distinct types and levels of distortion, provide a rich repository for learning. The multi-level feature extraction and fusion mechanisms incorporated into the model equip it to effectively manage the varied IQA tasks outlined in Table 1.
Table 2 elucidates the variability in the performance of the IQA model under diverse parameter configurations. The efficacy of the model is appraised via two statistical indices: the Spearman Rank Order Correlation Coefficient (SROCC) and the Pearson Linear Correlation Coefficient (PLCC). These metrics respectively gauge the consistency in ranking and the linear correlation between outputs of the model and human subjective assessments. The model’s performance is scrutinized by varying the depth of the Swin-Transformer blocks and the number of multi-head self-attention heads, while also considering the impact of the distorted image ratio within the dataset. The data presented in the table reveal comparable performances across different parameter sets, with the configuration consisting of deeper Swin-Transformer blocks ([4,4,4,4]) exhibiting a slight advantage over the [2,4,4,2] combination at distorted image ratios of 50% and 70%. This outcome suggests that increasing the depth of the Swin-Transformer module can marginally enhance the model's performance within the tested parameter range. A notable observation is the decline in both SROCC and PLCC values as the ratio of distorted images escalates from 50% to 70%, indicating that the model's performance is adversely affected by the heightened complexity of assessment due to a larger proportion of distorted images. The SROCC values, in particular, experience a marked decrease with the increase in distorted image ratio, especially pronounced in the first parameter configuration. In contrast, the PLCC values, while also exhibiting a decreasing trend, remain comparatively stable in the second parameter configuration. This pattern indicates a higher sensitivity of the model to distortions in terms of rank consistency. The incorporation of parallel Swin-Transformer blocks within the multi-scale quality prediction submodule has demonstrated significant efficacy, especially at lower ratios of distorted images. In such scenarios, the SROCC and PLCC values approach unity, signaling a high degree of alignment between the model's predictions and human perceptual judgments. It can, therefore, be concluded that the integration of parallel Swin-Transformer blocks in the multi-scale quality prediction submodule of the multi-scale IQA module is effective. This effectiveness is maintained across various ratios of distorted images, showcasing the module's robust capability in handling different degrees of image distortions and providing potent feature representations for the purpose of IQA.
Table 3 provides a performance comparison of various IQA models across different ratios of distorted images. The evaluation is based on PLCC and SROCC, which respectively gauge the linear correlation and rank consistency between predicted quality scores of the models and human subjective ratings. Scores approaching 1 in these metrics indicate a high degree of concordance with human perception. The analysis reveals that traditional IQA algorithms, such as Peak Signal-to-Noise Ratio (PSNR) and Structural Similarity Index Measure (SSIM), experience a marked decrease in performance as the proportion of distorted images in the dataset increases. Conversely, models based on deep learning methodologies, including CNN, Deep Belief Networks (DBNs), Deep Autoencoders, and Generative Adversarial Networks (GANs), demonstrate superior robustness, particularly at higher ratios of distorted images. The model introduced in this study, distinguished by its multi-level deep feature fusion approach, consistently exhibits high PLCC and SROCC values across varying degrees of distorted image ratios. Notably, this model surpasses most other models in performance, especially at a 70% distorted image ratio, underscoring its capability to maintain accurate assessment under various levels of distortion.
The findings indicate that the proposed model, characterized by its integration of multi-scale and multi-level feature extraction along with an effective feature fusion mechanism, excels in accurately capturing and evaluating image quality. This performance is particularly evident in scenarios with high proportions of distorted images, where the model's advanced capabilities enable it to outperform traditional IQA methods and other deep learning-based approaches.
Table 4 provides SROCC results from a cross-database validation study of different IQA models. This analysis evaluates the performance of each model when trained and tested on varying datasets. An effective IQA model is characterized by its ability to generalize across diverse datasets, which may differ in content and types of distortions. The performance of deep learning models, including CNN, DBNs, GANs, and Deep Autoencoders, is observed to vary in cross-database validation. This variance is attributable to their feature extraction capabilities and the extent to which these capabilities have been influenced by the characteristics of their training data. In contrast, the model developed in this study exhibits consistently higher SROCC values in all cross-database testing scenarios. Notably, this model demonstrates superior performance in scenarios where natural scene images or medical images are used for training, followed by testing on remote sensing images. These results underscore the model's outstanding ability to generalize effectively across different image types and distortion levels.
Figure 7 provides scatter plots that delineate the correlation between actual quality scores and objective predicted scores across various IQA models. On these plots, the vertical axis denotes the real quality score, while the horizontal axis represents the objective predicted score, illustrating their interrelationship. In an optimal scenario, accurate model predictions would result in scatter points congregating near a linear trajectory, typically along a diagonal, reflecting a high degree of consistency. Observations from Figure 7(a) reveal a dispersion in the scatter points, indicating a lack of strong alignment along a definitive linear path. This pattern suggests considerable inconsistencies between the predicted and actual scores in the model relying on manual features. Notably, the density of points is more pronounced in the median score range but becomes sparse in regions representing lower or higher scores. Furthermore, the points do not form a distinct, narrowly focused trend but display a more expansive distribution.
Table 1. Datasets for training and performance evaluation of the IQA model
|
Dataset Type |
Number of Reference Images |
Number of Distorted Images |
Distortion Types |
Distortion Levels |
Subjective Score Type |
|
Natural Scene Images |
82 |
12,312 |
Traditional distortions |
27 |
DMOS |
|
Artificial Scene Images |
28 |
789 |
Traditional distortions |
12 |
DMOS |
|
Medical Images |
31 |
856 |
Traditional distortions |
4 |
DMOS |
|
Remote Sensing Images |
26 |
3,421 |
Traditional distortions |
18 |
MOS |
|
Synthetic images |
245 |
24,545 |
Traditional and special distortions |
38 |
MOS |
Table 2. Impact of different parameter combinations on the IQA model performance
|
Depth of the Swin-Transformer block |
Number of Multi-Head Self-Attention Heads |
Distorted Image Ratio 50% |
Distorted Image Ratio 60% |
Distorted Image Ratio 70% |
|||
|
SROCC |
PLCC |
SROCC |
PLCC |
SROCC |
PLCC |
||
|
[2,4,4,2] |
[3,6,6,3] |
0.956 |
0.963 |
0.934 |
0.935 |
0.846 |
0.888 |
|
[4,4,4,4] |
[6,6,6,6] |
0.957 |
0.968 |
0.941 |
0.931 |
0.848 |
0.879 |
Table 3. Comparison of IQA model performance at different distorted image ratios
|
Model |
Distorted Image Ratio 50% |
Distorted Image Ratio 60% |
Distorted Image Ratio 70% |
|||
|
PLCC |
SROCC |
PLCC |
SROCC |
PLCC |
SROCC |
|
|
PSNR |
0.856 |
0.887 |
0.821 |
0.811 |
0.667 |
0.678 |
|
SSIM |
0.923 |
0.936 |
0.845 |
0.856 |
0.784 |
0.715 |
|
VDP |
0.937 |
0.945 |
0.879 |
0.912 |
0.823 |
0.785 |
|
FSIM |
0.958 |
0.956 |
0.921 |
0.923 |
0.865 |
0.846 |
|
MS-SSIM |
0.938 |
0.948 |
0.915 |
0.935 |
0.911 |
0.889 |
|
CNN |
0.956 |
0.953 |
0.946 |
0.936 |
0.812 |
0.778 |
|
DBNs |
0.954 |
0.958 |
0.923 |
0.921 |
0.784 |
0.678 |
|
GANs |
0.923 |
0.928 |
0.917 |
0.924 |
0.823 |
0.812 |
|
Deep Autoencoders |
0.948 |
0.936 |
0.935 |
0.948 |
0.845 |
0.814 |
|
The proposed model in this study |
0.958 |
0.967 |
0.947 |
0.9356 |
0.926 |
0.912 |
Table 4. Cross-database validation results for IQA models (SROCC)
|
Training |
Natural Scene Images |
Medical Images |
Synthetic Images |
|||
|
Testing |
Artificial Scene Images |
Synthetic Images |
Remote sensing Images |
Synthetic Images |
Artificial scene Images |
Remote Sensing Images |
|
CNN |
0.638 |
0.439 |
0.847 |
0.389 |
0.578 |
0.438 |
|
DBNs |
0.614 |
0.217 |
0.789 |
0.178 |
0.058 |
0.112 |
|
GANs |
0.589 |
0.459 |
0.762 |
0.283 |
0.524 |
0.326 |
|
Deep Autoencoders |
0.712 |
0.412 |
0.869 |
0.256 |
0.639 |
0.589 |
|
The proposed model in this study |
0.748 |
0.526 |
0.913 |
0.369 |
0.689 |
0.614 |
Figure 7. Scatter plots of real quality score vs. objective predicted score for different IQA models
In stark contrast, Figure 7(b)'s scatter distribution exhibits the objective predicted scores of the newly proposed model maintaining a high consistency level with the actual quality scores across the spectrum. This pattern infers that the proposed model can accurately and effectively predict image quality, maintaining a high precision degree across diverse scoring ranges. Such scatter plots lead to several key conclusions. The IQA model rooted in manual features reveals noticeable discrepancies in mirroring real quality scores. This discrepancy between the predicted and actual scores is observable across various scoring tiers. The newly proposed model accurately mirrors the real quality scores, underscoring its proficiency in IQA. Faced with complex image distortions, such as variations in color saturation, multiple Gaussian distortions, noise distortions, compression artifacts, and chromatic aberrations, the manual feature-based model lacks sufficient discriminatory power. This is because manual features cannot comprehensively capture all the details and dynamic changes affecting human visual perception. The model based on manual features fails to achieve more precise predictions of visual quality scores due to its limited adaptability to complex and varied types of distortions, which are common in real-world image processing. The proposed model, employing multi-level deep feature fusion, excels in capturing key features in image quality, particularly in processing details, textures, colors, and structural information of images. The proposed model demonstrates good discriminatory power for different degrees of image quality issues, attributed to its effective use of deep learning technology to extract and fuse multi-level features, a significant improvement over traditional models based on manual features.
The model structure proposed in this study, through its end-to-end multi-scale IQA module and design based on multi-level deep feature fusion, has been demonstrated to effectively extract and integrate features across various scales and levels. Experimental results indicate that the model achieves notable performance across all datasets, particularly in multi-scale image block encoding and quality prediction. This is achieved by harnessing information from various scales to refine the accuracy of evaluations.
The model's generalization capability has been rigorously tested through cross-validation across a spectrum of image datasets, encompassing natural and artificial scenes, medical, remote sensing, and synthetic images. In various training and testing combinations, the model consistently predicts image quality, maintaining robust performance even in scenarios with high distortion ratios. Compared to existing IQA methods, including traditional algorithms like PSNR and SSIM, as well as other deep learning-based models such as CNNs, DBNs, GANs, and Deep Autoencoders, the model presented in this study achieves superior results on multiple evaluation metrics. Particularly in terms of SROCC and PLCC indices, the model demonstrates higher correlation and predictive precision. The dual-branch prediction head strategy proposed in this study, which combines the quality score of each pixel with its corresponding weight, provides an effective method for comprehensive assessment of overall image quality. Such a strategy enables meticulous processing of local quality variations and facilitates accurate global-level predictions. The model employs a joint loss function that includes MSE loss, KL divergence loss, and ordinal loss. This design assists the model in considering various aspects of IQA during the learning process, thereby enhancing overall evaluation performance.
In conclusion, the IQA method based on multi-level deep feature fusion proposed in this paper demonstrates significant advantages in both theoretical and practical applications. Capable of effectively adapting to various types of images and distortion conditions, this method provides a powerful and reliable tool for automated IQA.
[1] Movva, R.B., Kontham, R.K. (2021). Blind image quality assessment using a CNN and edge distortion. Revue d'Intelligence Artificielle, 35(4): 315-324. https://doi.org/10.18280/ria.350406
[2] Bouida, A., Khelifi, M., Beladgham, M., Hamlili, F.Z. (2021). Monte Carlo optimization of a combined image quality assessment for compressed images evaluation. Traitement du Signal, 38(2): 281-289. https://doi.org/10.18280/ts.380204
[3] Cai, R., Fang, M. (2023). Blind image quality assessment by simulating the visual cortex. Visual Computer, 39(10): 4639-4656. https://doi.org/10.1007/s00371-022-02614-y
[4] Luo, X.J. (2021). Three-dimensional image quality evaluation and optimization based on convolutional neural network. Traitement du Signal, 38(4): 1041-1049. https://doi.org/10.18280/ts.380414
[5] Teymournezhad, K., Azgomi, H., Asghari, A. (2022). Detection of counterfeit banknotes by security components based on image processing and GoogLeNet deep learning network. Signal, Image and Video Processing, 16(6): 1505-1513. https://doi.org/10.1007/s11760-021-02104-z
[6] Shameem, B., Narain, B. (2021). An elephant identification by trunk using digital image processing in deep learning. In 2021 IEEE International Conference on Technology, Research, and Innovation for Betterment of Society (TRIBES), Raipur, India, pp. 1-6. https://doi.org/10.1109/TRIBES52498.2021.9751664
[7] Tripathi, A., Goel, A. (2021). A survey on exploring deep learning in medical image processing. In Proceedings - 2021 3rd International Conference on Advances in Computing, Communication Control and Networking (ICAC3N), Greater Noida, India, pp. 412-418. https://doi.org/10.1109/ICAC3N53548.2021.9725414
[8] Orchi, H., Sadik, M., Khaldoun, M. (2021). A general survey on plants disease detection using image processing, deep transfer learning and machine learning techniques. In Ubiquitous Networking-7th International Symposium, UNet 2021, Revised Selected Papers, pp. 210-224. https://doi.org/10.1007/978-3-030-86356-2_18
[9] Guo, J., Wu, X., Liu, J., Wei, T., Yang, X., Yang, X., He, B., Zhang, W. (2021). Non-contact vibration sensor using deep learning and image processing. Measurement: Journal of the International Measurement Confederation, 183: 109823. https://doi.org/10.1016/j.measurement.2021.109823
[10] Lee, S.H., Kim, S.W. (2023). Dual-branch vision transformer for blind image quality assessment. Journal of Visual Communication and Image Representation, 94: 103850.
[11] Liang, Z., Lu, W., Zheng, Y., He, W., Yang, J. (2023). The context effect for blind image quality assessment. Neurocomputing, 521: 172-180. https://doi.org/10.1016/j.neucom.2022.11.026
[12] Schulz, D., Maureira, J., Tapia, J., Busch, C. (2022). Identity documents image quality assessment. In 30th European Signal Processing Conference, EUSIPCO 2022-Proceedings, Belgrade, Serbia, pp. 1017-1021. https://doi.org/10.23919/EUSIPCO55093.2022.9909773
[13] Babnik, Z., Štruc, V. (2022). Assessing bias in face image quality assessment. In 2022 30th European Signal Processing Conference (EUSIPCO), Belgrade, Serbia, pp. 1037-1041. https://doi.org/10.23919/EUSIPCO55093.2022.9909867
[14] Lu, Y., Fu, J., Li, X., Zhou, W., Liu, S., Zhang, X., Wu, W., Jia, C.F., Liu, Y., Chen, Z. (2022). RTN: Reinforced transformer network for coronary CT angiography vessel-level image quality assessment. In International Conference on Medical Image Computing and Computer-Assisted Intervention, Springer, Cham, pp. 644-653. https://doi.org/10.1007/978-3-031-16431-6_61
[15] Schlett, T., Rathgeb, C., Henniger, O., Galbally, J., Fierrez, J., Busch, C. (2022). Face image quality assessment: A literature survey. ACM Computing Surveys (CSUR), 54(10s): 1-49. https://doi.org/10.1145/3507901
[16] Jing, C., Zhao, X., Xiong, Q., Guo, Y. (2022). Blind image quality assessment for multiple distortion image. Circuits, Systems, and Signal Processing, 41(10): 5807-5826. https://doi.org/10.1007/s00034-022-02055-x
[17] Kretz, T., Mueller, K.R., Schaeffter, T., Elster, C. (2020). Mammography image quality assurance using deep learning. IEEE Transactions on Biomedical Engineering, 67(12): 3317-3326. https://doi.org/10.1109/TBME.2020.2983539
[18] Yu, Z., Tang, K., Song, X. (2021). Denoising method for image quality improvement in photoacoustic microscopy using deep learning. In Proceedings of SPIE-The International Society for Optical Engineering, pp. 31-35. https://doi.org/10.1117/12.2600759
[19] Toprak, İ., Toygar, Ö. (2021). Detection of spoofing attacks for ear biometrics through image quality assessment and deep learning. Expert Systems with Applications, 172: 114600. https://doi.org/10.1016/j.eswa.2021.114600
[20] Zhao, P., Chen, X., Chung, V., Li, H. (2021). DeLFIQE -A low-complexity deep learning-based light field image quality evaluator. IEEE Transactions on Instrumentation and Measurement, 70: 1-11. https://doi.org/10.1109/TIM.2021.3106113
[21] Gao, Y., Gao, L., Li, X. (2021). A generative adversarial network based deep learning method for low-quality defect image reconstruction and recognition. IEEE Transactions on Industrial Informatics, 17(5): 3231-3240. https://doi.org/10.1109/TII.2020.3008703
[22] Fan, F., Zhang, J., Zhu, L., Ma, Z., Zhu, J. (2021). Improving cerebral microvascular image quality of optical coherence tomography angiography with deep learning-based segmentation. Journal of Biophotonics, 14(11): e202100171. https://doi.org/10.1002/jbio.202100171
[23] Greffier, J., Dabli, D., Frandon, J., Hamard, A., Belaouni, A., Akessoul, P., Fuamba, Y., Le Roy, J., Guiu, B., Beregi, J.P. (2021). Comparison of two versions of a deep learning image reconstruction algorithm on CT image quality and dose reduction: A phantom study. Medical Physics, 48(10): 5743-5755. https://doi.org/10.1002/mp.15180
[24] Hosu, V., Lin, H., Sziranyi, T., Saupe, D. (2020). KonIQ-10k: An ecologically valid database for deep learning of blind image quality assessment. IEEE Transactions on Image Processing, 29: 4041-4056. https://doi.org/10.1109/TIP.2020.2967829