Cüneyt Yücelbaş*![]() | Şule Yücelbaş
| Şule Yücelbaş![]()
© 2023 IIETA. This article is published by IIETA and is licensed under the CC BY 4.0 license (http://creativecommons.org/licenses/by/4.0/).
OPEN ACCESS
The efficacy of emerging and established learning algorithms warrants scrutiny. This examination is intrinsically linked to the results of classification performance. The primary determinant influencing these results is the distribution of the training and test data presented to the algorithms. Existing literature frequently employs standard and stratified (S-CV and St-CV) k-fold cross-validation methods for the creation of training and test data for classification tasks. In the S-CV method, training and test groups are formed via random data distribution, potentially undermining the reliability of performance results calculated post-classification. This study introduces innovative cross-validation strategies based on k-means and k-medoids clustering to address this challenge. These strategies are designed to tackle issues emerging from random data distribution. The proposed methods autonomously determine the number of clusters and folds. Initially, the number of clusters is established via Silhouette analysis, followed by identifying the number of folds according to the data volume within these clusters. An additional aim of this study is to minimize the standard deviation (Std) values between the folds. Particularly in classifying large datasets, the minimized Std negates the need to present each fold to the system, thereby reducing time expenditure and system congestion/fatigue. Analyses were carried out on several large-scale datasets to demonstrate the superiority of these new CV methods over the S-CV and St-CV techniques. The findings revealed superior performance results for the novel strategies. For instance, while the minimum Std value between folds was 0.022, the maximum accuracy rate achieved was approximately 100%. Owing to the proposed methods, the discrepancy between the performance outputs of each fold and the overall average is statistically minimized. The randomness in creating the training/test groups, which has been previously identified as a negative contributing factor to this discrepancy, has been significantly reduced. Hence, this study is anticipated to fill a critical and substantial gap in the existing literature concerning the formation of training/test groups in various classification problems and the statistical accuracy of performance results.
large-scale classification, cross-validation methodology, k-means, k-medoids, clustering techniques
Addressing classification challenges in practical artificial intelligence (AI) applications often requires handling large-scale datasets. To effectively navigate these challenges, specific adjustments, tailored to the nuances of these expansive datasets, are necessary. For classifier systems leveraging machine learning to yield optimal results, prior training is essential. This involves partitioning the dataset into training and testing groups, followed by a testing phase. Both groups encompass data with unique target values. The features of each dataset are presented to the classifier with the aim of producing outputs that closely match the target values. These generated outputs are subsequently compared to the target values, allowing an evaluation of the classifier's performance, and thus determining the accuracy rate. The interpretation of system outputs may be based on low error values or standard deviation among results, a decision subject to the researcher's discretion according to the study's objectives [1, 2].
Accuracy rates can also be described as the likelihood of accurately determining the target value of a randomly selected sample from the dataset. However, the extent to which randomly chosen data truly reflects the system's performance remains uncertain, as the ability to distinguish the optimal and suboptimal features of the selected dataset is entirely contingent on chance. This process can potentially compromise the reliability of performance outcomes for the proposed classifier systems. In studies where classifier systems have been utilized, data is typically divided into training and test groups initially. This segmentation involves allocating a certain quantity of data for training and the remaining for testing. This method partitions the dataset into specific ratios, such as 80/20, 70/30, 60/40, or 50/50, for the training and testing groups [3]. Proportional distribution is determined based on user preference. Subsequently, the system is trained using the rate defined by the training data. The trained system is then assessed using the test data generated for performance evaluation. Nonetheless, this method possesses certain limitations. The most prominent challenge lies in deciding the inclusion of data in the training and test groups. Grouping data based on user preferences reduces reliability, and with random grouping, statistical accuracy may decrease. Consequently, a more reliable approach could be to calculate system performance by integrating each dataset into both the training and test groups [4]. To achieve this, the cross-validation method, originally introduced by Geisser [4], was adopted. The k-fold cross-validation (CV) method was formulated by including the k-parameter to denote the number of verifications in this method [4]. This approach yielded more reliable results compared to the train/test split method. However, in this method, the data are randomly divided into groups. This randomness can result in significant disparities between the results of the folds, consequently increasing the standard deviation values between them. While this discrepancy may not be an issue for smaller datasets, it can pose a challenge for large datasets in certain instances.
Several methods based on the k-fold Cross-Validation (CV) technique have been proposed in the literature for the segregation of data into training and test groups [5]. One such method is the nested CV approach [6]. In the training phase of this approach, unique classification models are crafted for each fold to secure classification performances [6]. However, employing multiple models for different folds is often impractical in real-world scenarios due to potential time loss and increased complexity. The model optimized for one specific fold may not deliver optimal performance on others. Another variant is the partially nested CV [5], which, in addition to the nested CV, involves feature selection from each fold's training data. The results are then derived from the test data of each fold based on these selected features. However, the practical implementation of this approach is challenging due to potential system slowdowns and excessive complexity. In another study, researchers proposed an alternate accuracy estimation method that deterministically divides data into folds instead of relying on random sampling [7]. This proposed approach, referred to as either single-centered or clustering-based, was tested on various datasets with limited data samples [7]. However, the effectiveness of this approach varied across datasets with different fold numbers [7], which introduces uncertainty about the optimal number of folds for real-world applications. Another widely used method for forming training and test groups is the leave-one-out Cross-Validation (CV) [8]. As the number of folds aligns with the data count in this approach, it is essentially a derivative of standard CV (S-CV) [4, 6]. However, its applicability is limited to small datasets, as it is typically employed in scenarios with low data counts. An alternative CV technique that allocates data to folds according to specific rules is stratified cross-validation (St-CV) [9-11]. Although this method aims to maintain nearly identical class distributions within each fold [9], it has been observed that obtaining highly accurate results via this method can be challenging.
Clustering algorithms are among the analytical tools extensively utilized by researchers across various domains to manage large datasets. This unsupervised learning method involves grouping samples within a dataset based on their features, distinguishing similarities and dissimilarities. In this approach, the aim is to maximize intra-cluster similarity while maintaining a relatively low inter-cluster similarity. Similarities among dataset samples are determined through distance calculations from designated centroids, using metrics like Euclidean, squared Euclidean, and Manhattan distances. The primary motivation for applying clustering to data is to condense the divided dataset into distinct groups [12]. Clustering algorithms include various sub-methods, with the k-means and k-medoids algorithms, used in this study, classified under partitioning methods. Velmurugan and Santhanam conducted a comparative analysis of k-means and k-medoids algorithms on datasets generated via normal and uniform distributions [13]. Their findings showed that the k-means method, for both distributions, took slightly longer to complete processes than the other methods [13]. Moreover, both methods exhibited longer completion times when working with datasets derived from normal distributions compared to other distributions [13]. Interestingly, the k-medoids algorithm demonstrated a reduced processing time for the maximum data volume [13].
Classification problems in literature often involve the construction of training and test data groups where data is usually distributed randomly. However, this random distribution often invites skepticism from researchers regarding the classification performance results of systems, given the potential for both the best and the worst data to be assigned to the training or test groups. To address this issue in data distribution, this study proposes novel data distribution approaches based on k-means and k-medoids clustering methods. With these approaches that utilize unsupervised learning and clustering algorithms, the number of clusters is automatically determined through Silhouette analysis, and folds are subsequently created from the data in the resulting clusters. This enables the formation of folds consisting of data that do not contain a random selection. Additionally, the system automatically determines the number of folds according to the number of samples in the clusters obtained through an algorithm. Artificial Neural Networks (ANN) were deployed for data classification. This study aimed to minimize the standard deviation value between the accuracy rates achieved for each fold.
The proposed approaches, especially tested on large data sets in the UCI Machine Learning Repository database [14], showcased improvements when compared with the S-CV and St-CV. Specifically, enhancements in ACC values were observed for the elect, occu, pen, skin, and stat data sets, demonstrating improvements of 3.62%, 2.81%, 3.34%, 6.91%, and 4.26%, respectively, over other standard methods. Similarly, in terms of Std, improvements of 98.19%, 91.32%, 95.68%, 99.08%, and 98.63% were achieved for the same data sets, respectively. Furthermore, the proposed methods showed at least a 265% speed increase in processing computational speeds.
The most practical contribution of the research is that with these proposed approaches, instead of presenting every fold to the classifier to achieve the same performance outputs, it is sufficient to provide only one fold. This is inferred from the significantly low Std values between the ACC results obtained from the folds generated by the proposed approaches, and the substantial improvement in the Std value compared to traditional methods. Consequently, in the classification of large-scale data sets, both time loss and system fatigue arising from presenting each fold to the system will be minimized, while elevating the system's success to higher levels. This approach will largely eliminate data assignment problems affecting the reliability of even larger data set classifications. This research is expected to fill an important and necessary gap in the literature in terms of forming training/test groups in many classification problems and enhancing the statistical accuracy of performance results.
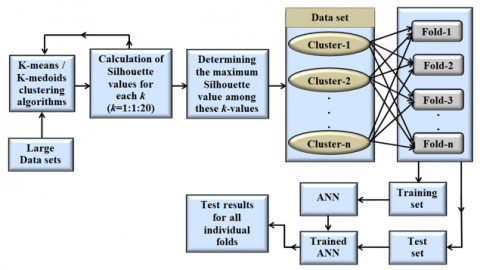
In this paper, novel data distribution approaches based on k-means and k-medoids clustering are presented from which the CV method was derived. The block diagram of the proposed approaches is given in Figure 1.
As depicted in Figure 1, the initial phase involved applying k-means or k-medoids clustering operations to the targeted extensive dataset. For both approaches, the number of clusters to be generated within each dataset was automatically determined through Silhouette analysis. Subsequently, the dataset was partitioned into folds automatically within the framework of the CV method, utilizing the generated clusters. Lastly, for result comparison purposes, the data acquired through these methodologies underwent classification using the ANN system, which possesses fixed parameters. A comprehensive illustration of all these stages is meticulously delineated in a step-by-step fashion within the flow diagram portrayed in Figure 2.
Figure 1. Block diagram of novel CV approaches based on k-means and k-medoids clustering
Figure 2. Flow diagram of the algorithm composed within the scope of the study
The flow diagram given in Figure 2 briefly runs in accordance with the following steps:
Step-1: The algorithm is started by presenting the data set to the system.
Step-2: The data are presented separately to both proposed approaches and the S-CV method.
Step-3: Data for k-means and k-medoids approaches are analyzed and automatically divided into the number of clusters determined.
Step-4: The desired or specified fold number is set.
Step-5: The data in the clusters obtained for the proposed approaches are separated according to the folds. This separation is automatically adjusted to have samples from each cluster in each fold.
Step-6: For the S-CV method used for comparison with the proposed approaches, the number of folds is set to be equal to the others.
Step-7: The parameters of the ANN classifier used for comparison of methods are fixed in the same way for all methods.
Step-8: Folds obtained for each method are presented to the ANN system for the training/test.
Step-9: The results are recorded.
Step-10: The performances of the proposed CV approaches are compared with the results of the S-CV method.
Step-11: The algorithm is finished.
2.1 Standard (S-CV) and Stratified (St-CV) k-fold CV methods
CV is centered on the segmentation of a dataset into one or more partitions. While all partitions but one is employed to train the chosen algorithm, the remaining partition is allocated for testing or validation. This approach facilitates the fine-tuning of optimal system parameters to ensure the selected algorithm yields the best possible outcome. Larson [15] pioneered the utilization of this method for algorithm training and performance evaluation. Subsequently, Mosteller and Tukey, Stone, and Geisser explored various facets of this approach in 1968, 1974, and 1975, respectively [4, 6, 16]. While numerous variations of this technique are available, the S-CV and St-CV k-fold CV methods are most commonly favored. The implementation of these approaches adheres to the user-defined k-parameter. In literature, setting this parameter to 10 has demonstrated enhanced precision in results [10]. A visual representation of these CV techniques is illustrated in Figure 3.
As depicted in Figure 3, within the S-CV method, the entire dataset is randomly partitioned based on the designated number of folds. The classifier system's parameters used in this technique remain consistent throughout the application across all folds. Consequently, while favorable outcomes might be achieved for one fold in accordance with the fixed parameters, contrasting outcomes could arise for another fold. Hence, the variance between the performance results across folds can be substantial. This situation is notably regarded as the most conspicuous drawback of the S-CV method. Conversely, in the alternative CV method (St-CV), stratified sampling is employed instead of random sampling. Through this approach, the class distributions across the complete dataset are uniformly allocated to each fold. The primary objective of this method is to ensure a near-equivalent class distribution within each fold.
Figure 3. Representation of the standard and stratified k-fold CV methods
2.2 K-means clustering-based CV
One of the fundamental goals of clustering algorithms, which belong to the category of unsupervised learning methods, is to partition a dataset into clusters based on specific criteria. While the similarity within formed clusters is maximized, the similarity between clusters is minimized. Whether data points resemble each other is calculated using distance metrics like Euclidean, squared Euclidean, and Manhattan [12]. A widely used partitioning method, the k-means algorithm, possesses the capability to minimize cluster error [17]. Introduced by MacQueen, the k-means algorithm is a clustering technique that sharply divides a dataset into k groups [18]. The core mechanism of the algorithm involves the random selection of k elements, each representing a distinct cluster. Subsequently, all data points in the dataset are assigned to a cluster based on their distances from the center points, ensuring that no data point remains unassigned. In the subsequent steps, cluster centers are determined by calculating the average of the data points within each cluster. These steps are iterated until there is no further change in the cluster centers [17-19].
This proposed CV approach initiates with the application of the k-means clustering algorithm to datasets. In this clustering method, the user defines the k-parameter within a specified range, and its automatic determination is based on certain calculations. This automatic determination process relies on the Silhouette value computed within the algorithm. The Silhouette value serves as an indicator of the extent to which a sample within the dataset pertains to the cluster it is a part of. This measure serves as a criterion aiding in the interpretation of data consistency within resulting clusters. In essence, this criterion offers both numerical and graphical insights into whether data points are appropriately grouped within clusters, as inferred from necessary computations. This analytical approach is commonly favored for determining the optimal number of clusters in clustering algorithms like k-means and k-medoids. The calculation of the Silhouette value involves the utilization of distance metrics such as Euclidean and Manhattan distances.
The CV approaches presented in the study were designed to be used with large data consisting of high dimensions and a large number of instances. As presented by Aggarwal et al. [20], it was stated that the Manhattan calculation criterion gives more consistent results than the Euclidean, especially for applications concerning high dimensional data; therefore, it is correct to choose this method. Manhattan was preferred as the distance calculation, since the data sets used in our study contain a large number of samples and are high in size.
Assume that X and Y are two d-dimensional points as X=[x1, x2, x3…… xd] and Y=[y1, y2, y3…… yd]. Accordingly, the Manhattan distance (1) between these two points is calculated as shown below:
$\operatorname{dist}(X, Y)=\sum_{j=1}^d\left|x_j-y_j\right|$ (1)
Thus, by using the same distance measure in the proposed CV approaches, integrity and harmony can be achieved within the system. Using a different distance calculation in the Silhouette analysis may cause misinterpretation of the cluster number. For this reason, it is necessary to pay particular attention to the use of the same criteria in distance calculations. The mathematical expression of the silhouette value is shown in Appendix.
As a result of this calculation in Appendix [21-23], a value is obtained in the range of [−1, 1]. Obtaining s(i) as close to 1 means that the cluster to which the sample belongs is correct [23]; however, values less than 0 and close to −1 mean that the sample belongs to the wrong cluster [23]. Calculating this value as 0 indicates the instability of whether the data belongs to C(A) or C(B). The s(i) value of the whole class is calculated by taking the average of the s(i) values of all of the samples in the data set [23]. In this study, the mean s(i) values were calculated by changing the number of clusters (k) in the range of [3, 23] for each data set. Accordingly, analyzes were performed by taking the number of clusters with the maximum mean s(i) value. Silhouette analysis graphs, which were obtained for different number of clusters [5-13] of the occupancy detection (occu) data set used in the study are given in Figure 4.
In the graph belonging to the occu data set, the silhouette values calculated for k values between 2 and 10 were calculated as 0.6542, 0.6957, 0.3957, 0.4107, 0.4050, 0.4333, 0.4380, 0.4533, and 0.4051, respectively. As a result, the highest value was obtained as 0.6957 for k = 3.
Figure 4. Silhouette analysis graphs for different number of clusters
In the next stage of the algorithm, operations were performed based on the number of clusters with the maximum s(i) value. The data within clusters formed based on the k-value play a crucial role in determining the number of folds in the CV process. The maximum number of folds was set at 10 in the proposed systems; however, if the data count within any cluster is below 10, the fold count is adjusted to match the number of data points within that cluster. This adjustment ensures an equitable distribution of data across folds from each cluster. Given that every cluster encompassed a minimum of 10 samples, the fold count was uniformly set at 10, and subsequent procedures were carried out accordingly.
Subsequent to the segmentation of clusters into folds, training and test groups were established to facilitate the analyses. An ANN classifier was employed to compare the performances of the proposed methodologies. Within this ANN system, a multi-layered structure comprising input, hidden layer, and output layers was adopted. In this setup, which favors a feed-forward neural network architecture, the hidden layer was configured with 10 neurons. The architecture of this ANN and other pertinent parameters remained constant across all conducted analyses within the study. To attain more robust and distinct outcomes, the ANN system was executed 100 times for each fold, and the ultimate outcome was derived by averaging the results. The resultant process culminates in a comparative assessment of classification accuracy rates, along with their corresponding standard deviation values, across folds for all systems.
2.3 K-medoids clustering based CV
The k-medoids algorithm, akin to k-means, falls within the category of partitioned methods and constitutes a clustering approach within the realm of unsupervised learning. At its core, this algorithm aims to identify k-representatives (medoids) that best capture the structural essence of the dataset [23]. The sample nearest to the centroid of the pertinent cluster is selected as the representative and bears the title of 'medoid'. Numerous iterations of this clustering algorithm exist, showcasing robustness against outliers in the dataset. However, the Partitioning Around Medoids (PAM) algorithm, originally introduced by Kaufman and Rousseeuw, stands out as the most widely employed variant [23]. Within this approach, k-medoids are initially designated based on user input, and every data sample is assigned to the nearest representative, culminating in the creation of k-clusters. Subsequently, the swapping process is initiated. For each new element's integration into the cluster, the same sequence of actions is undertaken, pinpointing the element with the most substantial contribution. Subsequent to this identification, the swap mechanism is executed, with the previously identified point assuming the role of the new center, while the previous center assumes the position of a typical cluster element. These operations endure until the medoid's position remains unaltered [23, 24].
The PAM algorithm consists of two stages [23]. In the initial stage in which the first cluster is formed, the following steps are performed:
Stage 1: Select the Initial Unselected Object (m)
Stage 2: Select Another Unselected Object and Calculate Difference (n)
Stage 3: Calculate Contribution Value (Cnm)
Stage 4: Calculate Total Gain
Stage 5: Select Object with Maximum Contribution
Second Stage of the Algorithm: Swap Operation (the displacement process)
Stage 1: Calculate Contribution to Swap Process (Cnmp)
Stage 2: Calculate Total Effect
Stage 3: Decision to Execute Swap Process
In the CV approach proposed in this study, PAM algorithm was employed, and the Manhattan distance metric was utilized for distance calculations. Similar to the k-means CV method, the system automatically determines the optimal value through requisite assessments across various k values. Furthermore, during the CV stage, the number of folds is automatically ascertained based on the quantity of elements within the resultant clusters. Given that the count of elements within all clusters resulting from the application on the relevant datasets exceeded 10, the fold count was set at 10, mirroring the approach taken in other presented methodologies. An ANN was employed as a classifier to assess system performance and facilitate comparison with alternative methods. Additionally, measures were taken to ensure uniformity in the classifier's parameters, aligning them with those employed in other instances.
2.4 Used data sets
Up to this point, the study has encompassed an overview and elucidation of the newly proposed approaches. Additionally, explanations have been provided for the S-CV and St-CV methods, with which these approaches are being contrasted. At the stage of obtaining experimental outputs of the study, five data sets recorded in different fields detailed in Table 1 were used. All of these data sets were taken from the UCI Machine Learning Repository database [14]. Data sets with abbreviated names in Table 1 are the Electrical Grid Stability Simulated data set (elect) [25], Occupancy Detection data set (occu) [26], Pen-Based Recognition of Handwritten Digits data set (pen) [27], Skin Segmentation data set (skin) [28, 29], and Statlog-Shuttle data set (stat) [14]. When the data sets selected for the study were compared with the sample number of the data sets in many studies in the literature, it could be seen that they contain an extremely large number of samples. For this reason, these preferred data sets were named as “large data set”.
Table 1. Information about data sets used in this study
|
Used Data Sets [14] |
Data Set Characteristics |
Attribute Characteristics |
Area of Data Set |
Number of Classes |
Number of Attributes |
Number of Instances |
|
elect |
Multivariate |
Real |
Physical |
2 |
13 |
10000 |
|
occu |
Multivariate, Time-Series |
Real |
Computer |
2 |
5 |
20560 |
|
pen |
Multivariate |
Integer |
Computer |
10 |
16 |
10992 |
|
skin |
Univariate |
Real |
Computer |
2 |
3 |
245057 |
|
stat |
Multivariate |
Integer |
Physical |
7 |
8 |
58000 |
The data sets providing general information as shown in Table 1 have a minimum of 2 and a maximum of 10 classes. In addition, their dimensions and number of samples ranged from 3 to 16 and 10000 to 245057, respectively. When evaluating the data in terms of sample numbers, it is possible to evaluate the data as large.
When literature studies are examined, it can be seen that the data sets with low number of samples (such as 200, 500, and 900) are generally used. However, it is known that real-world data is always large. Accordingly, as can be seen in Table 1, exceptionally large data (in the range of 10000 to 245057) were preferred for performing the experimental processes in this study. Thus, it was possible to test the ability of the proposed systems to analyze such data compatible with the real world.
In this study, an experimental comparison of the two proposed novel CV approaches (k-means and k-medoids CVs) was made, both among themselves and with the S-CV and St-CV methods. In order to make these comparisons, five different data sets [25-29] with an excess number of samples taken from the UCI Machine Learning Repository [14] were used. These data sets were elect, occu, pen, skin, and stat with the number of samples between 10000 and 245057. The ANN classifier was used to obtain and compare the classification results of the systems. A feed-forward neural network structure was used within the classifier. This structure consists of input-hidden-output layers. For all methods, the number of hidden layer neurons was taken as 10 and remains constant. The number of neurons in the input and output layers was determined entirely by the characteristics of the data sets. The number of neurons in the input was determined according to the dimension of the data set (ie, the number of features), while the output layer was formed according to the number of classes. Accordingly, the number of input and output neurons for elect, occu, pen, skin, and stat were 13-2, 5-2, 16-10, 3-2, and 8-7, respectively. Also, all experiments were run on a computer with 1.8GHz CPU, 8GB of RAM, 128GB HDD, 128MB of VRAM, number of cores 7 (i7), and Windows 10 pro operating system.
The Levenberg–Marquardt optimization function was used to train the network structure of the classifier system. In the ANN classifier, hyperbolic tangent sigmoid (tansig), which can obtain faster output rates for the hidden and output layers [30], and purelin transfer functions, which can handle the hidden layer output data more consistently [30], were used. Within the classifier, the mean squared error (MSE) is used as a loss function (performance function). The MSE operation computes the loss between network predictions and target classes. The additional training parameters of the neural network include a maximum number of training epochs (the number of iterations=1000), a performance goal set to zero, a control parameter (momentum constant: mu) for adapting/learning rate set at 0.001, and a learning rate (lr) of 0.01. These system parameters of the ANN classifier used in this study were initially fixed and were never changed in any of the applications of this study. In this way, it was ensured that the performances of all of the proposed approaches and traditional CV methods were obtained under equal conditions.
As a result of running the study strategy, outputs for the CV methods were obtained. As part of this strategy, the ANN classifier was run 100 times for each fold of each data set in order to evaluate the performance of each method. Before running the classifier system, the number of folds to which the relevant data set will be separated is performed automatically according to the number of samples in the obtained clusters. However, the number of samples in the clusters was at least 10 in all of the data sets; accordingly, the number of folds was assigned as 10 for all the data sets used in the study. The number of clusters that would occur for each data set was determined according to the automatically calculated Silhouette value, as mentioned in the previous sections. After this stage, the MSE values were obtained for each fold of the data sets by the ANN classifier. Percentage means accuracy rates and standard deviation values between folds were calculated using these error values. The accuracy (ACC), standard deviation (Std) values, number of clusters, and computation time for each data set obtained as a result of these calculations are given in Table 2.
When Table 2 is examined, the maximum average classification accuracy for all the data sets was obtained using the k-means CV method. However, when the results obtained for each fold were evaluated in terms of the standard deviation values, the minimum deviation was obtained in the k-medoids CV method for all of the other data sets except stat. Among all of the data sets, the minimum Std value in skin was 0.022. This data set had the highest number of samples and the lowest number of features among all the data sets. The St-CV method was last with respect to all of the data sets in terms of both accuracy and standard deviation (ACC and Std, respectively). The best ACC value was obtained as about 100% in the elect data set with two classes and a minimum number of samples. Graphical representation of the ACC and Std values obtained for each data set as a result of the applied methods is given in Figure 5.
Table 2. Comparative results for k-means CV, k-medoids CV, S-CV, and St-CV methods (F: Fold, ACC: Average classification accuracy, Std: Standard deviation, Nc: Number of clusters, Ct: Computation time (minute))
|
Data |
CV Methods |
F-1 |
F-2 |
F-3 |
F-4 |
F-5 |
F-6 |
F-7 |
F-8 |
F-9 |
F-10 |
ACC |
Std |
Nc |
Ct |
|
elect |
k-means |
100 |
100 |
100 |
99.9 |
99.95 |
99.97 |
99.98 |
99.98 |
100 |
100 |
99.98 |
0.032 |
4 |
0.29 |
|
k-medoids |
100 |
99.94 |
99.92 |
99.98 |
99.99 |
99.94 |
99.99 |
99.99 |
99.99 |
99.93 |
99.97 |
0.031 |
3 |
0.21 |
|
|
S-CV |
96.52 |
97.58 |
98.85 |
94.78 |
96.45 |
97.26 |
94.37 |
95.46 |
98.51 |
96.64 |
96.64 |
1.480 |
- |
5.78 |
|
|
St-CV |
94.48 |
96.52 |
98.74 |
97.41 |
95.36 |
99.12 |
94.85 |
97.37 |
96.74 |
94.25 |
96.48 |
1.722 |
- |
5.92 |
|
|
occu |
k-means |
99.3 |
98.82 |
99.46 |
99.27 |
99.13 |
99.08 |
99.04 |
99.01 |
99.06 |
99.07 |
99.12 |
0.178 |
3 |
0.96 |
|
k-medoids |
99.11 |
98.98 |
99.2 |
98.76 |
99.26 |
99.12 |
99.07 |
99.26 |
99.08 |
99.1 |
99.09 |
0.146 |
2 |
0.87 |
|
|
S-CV |
94.63 |
98.82 |
97.39 |
96.02 |
97.17 |
98.97 |
95.2 |
98.83 |
98.97 |
98.68 |
97.47 |
1.668 |
- |
7.62 |
|
|
St-CV |
96.82 |
95.49 |
94.85 |
95.52 |
96.84 |
97.56 |
93.08 |
97.33 |
98.5 |
98.25 |
96.42 |
1.681 |
- |
7.75 |
|
|
pen |
k-means |
98.68 |
98.66 |
98.6 |
98.76 |
98.52 |
98.51 |
98.97 |
98.56 |
98.72 |
98.62 |
98.66 |
0.136 |
5 |
1.82 |
|
k-medoids |
98.52 |
98.59 |
98.58 |
98.64 |
98.6 |
98.45 |
98.7 |
98.57 |
98.71 |
98.68 |
98.60 |
0.082 |
2 |
1.74 |
|
|
S-CV |
95.56 |
97.61 |
96.29 |
93.31 |
94.48 |
96.87 |
95.87 |
96.15 |
95.35 |
98.19 |
95.97 |
1.431 |
- |
11.04 |
|
|
St-CV |
93.53 |
96.79 |
94.44 |
92.52 |
95.77 |
94.32 |
97.73 |
98.24 |
94.47 |
96.87 |
95.47 |
1.898 |
- |
11.23 |
|
|
skin |
k-means |
99.74 |
99.75 |
99.72 |
99.75 |
99.71 |
99.7 |
99.72 |
99.75 |
99.78 |
99.73 |
99.74 |
0.024 |
2 |
9.18 |
|
k-medoids |
99.71 |
99.71 |
99.75 |
99.73 |
99.7 |
99.72 |
99.71 |
99.77 |
99.72 |
99.71 |
99.72 |
0.022 |
2 |
9.13 |
|
|
S-CV |
92.74 |
92.59 |
95.63 |
97.63 |
94.75 |
95.73 |
98.75 |
92.65 |
97.65 |
93.72 |
95.18 |
2.279 |
- |
23.48 |
|
|
St-CV |
93.27 |
91.72 |
96.62 |
92.89 |
97.83 |
91.61 |
90.14 |
94.65 |
91.75 |
92.52 |
93.30 |
2.401 |
- |
24.16 |
|
|
stat |
k-means |
99.95 |
99.91 |
99.94 |
99.95 |
99.93 |
99.9 |
99.89 |
99.89 |
99.95 |
99.91 |
99.92 |
0.025 |
2 |
3.37 |
|
k-medoids |
99.93 |
99.92 |
99.92 |
99.88 |
99.86 |
99.94 |
99.86 |
99.92 |
99.91 |
99.92 |
99.91 |
0.029 |
2 |
3.29 |
|
|
S-CV |
94.73 |
97.93 |
93.16 |
96.87 |
95.83 |
97.78 |
98.82 |
94.55 |
96.83 |
97.78 |
96.43 |
1.809 |
- |
15.24 |
|
|
St-CV |
95.84 |
92.73 |
97.84 |
94.835 |
96.682 |
98.84 |
95.86 |
96.94 |
94.91 |
93.96 |
95.84 |
1.826 |
- |
15.46 |
Figure 5. ACC and Std results obtained for each data set and method
Thanks to the proposed CV approaches, especially large-scale data sets are initially divided into clusters. This ensures that data with similar structures and features find their place within these established clusters. In contrast, in other traditional CV techniques (S-CV and St-CV), the folding process is performed entirely randomly. Due to this randomness, the performance outcomes between folds vary. Therefore, when using standard CV methods, it becomes necessary to present the entire data set to the classifier. This situation leads to both time loss and sluggishness in the system. The core logic of the proposed approaches is prominently demonstrated here. In essence, the presence of similar-structured data within the same cluster will ensure compatibility among the data in the generated folds. This reasoning has led to a significant reduction in the Std among the folds, a key achievement in this study. In this way, it is ensured that the achieved performance outputs are more reliable. Consequently, instead of the whole data set, it has been proven that it will be sufficient to execute the operations on only one of the folds created by using the proposed approaches.
When the results were interpreted according to the number of clusters obtained as a result of applying clustering methods, it appears that more clusters were formed in the elect, occu, and pen data sets via k-means CV. For the other data sets, an equal number of clusters were obtained with both CV approaches. As a result of applying these methods, a maximum of five and a minimum of two clusters were formed for the k-means and k-medoids CV techniques, respectively.
When the methods are evaluated in terms of calculation time, the shortest time for all data sets was obtained in k-medoids and k-means CV methods. The time difference between these two methods is negligible. However, in S-CV and St-CV methods, this process time was much longer. In general, it can be said that the computation time for all methods was affected by all of the components of the data sets (the number of classes, attributes, and instances). The correlation coefficients calculated between these components and the computation times of the methods were given in Table 3.
To discuss the results in more detail; when the performance outputs obtained are evaluated in terms of ACC, the proposed approaches provide a minimum of 2.81% and a maximum of 6.91% improvement compared to other traditional CV techniques. In terms of Std, it has been proven that the difference between the folds is improved at minimum and maximum 91.32% and 99.08%, respectively. In addition, as a result of using the proposed methods, 28, 8.9, 6.45, 2.64, and 4.7 times faster operations were concluded for elect, occu, pen, skin, and stat datasets, respectively. The proposed CV approaches are believed to have a positive impact on the classification of large heterogeneous data sets commonly found in real-world applications. Because, on the basis of these methods, first of all, the data with scattered properties are grouped by clustering techniques and then the process of dividing them into folds is carried out. In this way, the disadvantage of heterogeneous data is mitigated. To substantiate this, in this research, extensive experimental research has been conducted on both heterogeneous and large-scale data sets, yielding successful outcomes.
Upon examining Table 3, it becomes apparent that a robust correlation exists between the number of samples (constituting a fundamental data set element) and the processing time. In essence, this element exhibits a primary influence on computational speed. Subsequently, the number of features comes into play. Notably, the number of classes exerts the least impact. While these components are assessed independently, they collectively contribute to the overall system dynamics. To illustrate using the utilized system as an example, the number of features and classes corresponding to each data set instance determine the neuron count within the network's input and output layers during formation. For this reason, these components directly affect the network structure and therefore the time spent. As a result, choosing data with a fewer number of features, classes, and instances will positively affect the system time no matter the method. Although it is not possible to intervene in the number of classes belonging to the data, the time can be manipulated by changing the number of features with various methods. However, it should be known that additional time should be allocated for this process. Therefore, the operations to be performed on the data should be implemented after careful consideration of the advantages and disadvantages. When Table 2 is examined, it ca be seen that the computation times of the k-means and k-medoids methods are much less than the others. The reason for this difference is that new approaches divide the data into clusters in advance and distribute them equally to folds. Thus, the classifier can label the data in the folds much more easily and quickly. The absence of such a preliminary stage in other methods causes the system time to be longer. It could be also seen that the time difference between the proposed approaches and other methods varies inversely with the number of instances.
As a result, it is clear from the above-mentioned performance results that the techniques suggested for larger data sets can complete operations in less time than needed for other data sets. Accordingly, when the methods are compared in terms of computation time, the temporal superiority of the k-means and k-medoids CV is seen much more, especially for large data. Apart from all of these features, intervenable factors affecting the specified times are the computer's hardware features used for analysis. The higher the quality of these technical features, the shorter the analysis time for the methods and systems.
As a culmination of these applications, it became evident that the cluster-based CV methods introduced within the study effectively minimized the Std value among folds while simultaneously maximizing the overall ACC value. Consequently, this approach significantly mitigated challenges like time inefficiency, complexity, and system strain in classifying extensive data sets. This investigation revealed that presenting the entire array of folds to the system during data classification is unnecessary. Instead, employing a selected fold yielded nearly equivalent performance outcomes compared to the use of all folds. The Std values observed among folds, resulting from the implementation of the proposed CV methods, consistently exhibited reasonable levels across all data sets. In essence, these suggested CV techniques demonstrate a high level of reliability and can be confidently applied to diverse data sets.
Table 3. Correlation coefficients between the components of the data sets and computation times of the methods
|
Used Data Sets [14] |
Components of the Data Sets |
Computation Times (minute) |
Correlation Coefficients |
|||||||
|
Number of Classes (A) |
Number of Attributes (B) |
Number of Instances (C) |
k-means CV (D) |
k-medoids CV (E) |
S-CV (F) |
St-CV (G) |
A - D |
B - D |
C - D |
|
|
elect |
2 |
13 |
10000 |
0.29 |
0.21 |
5.78 |
5.92 |
-0.173 |
-0.623 |
0.983 |
|
occu |
2 |
5 |
20560 |
0.96 |
0.87 |
7.62 |
7.75 |
A - E |
B - E |
C - E |
|
pen |
10 |
16 |
10992 |
1.82 |
1.74 |
11.04 |
11.23 |
-0.173 |
-0.622 |
0.983 |
|
A - F |
B - F |
C - F |
||||||||
|
skin |
2 |
3 |
245057 |
9.18 |
9.13 |
23.48 |
24.16 |
0.003 |
-0.562 |
0.925 |
|
A - G |
B - G |
C - G |
||||||||
|
stat |
7 |
8 |
58000 |
3.37 |
3.29 |
15.24 |
15.46 |
-0.006 |
-0.564 |
0.929 |
In the literature, the classification performances of systems are examined during the testing process of the learning algorithms that are introduced by the researchers. The main factors affecting the results are the separation of data as training-test and other system parameters. If the training-test data distribution is not suitable, no matter how well the system parameters are adjusted, it is inevitable that the system will have low performance values. For this reason, the preparation stage for giving the studied data set to the classifier is the most important part of the general flow. In this section, proportional (80/20, 70/30, 60/40, and others) and CV methods were used in order to separate the data as training and test data sets. Although the proportional separation method was usually used in preparation of these data, “k-fold CV” and “leave-one-out CV” are currently used in almost all of the studies in this field. However, in the CV method, data are assigned randomly to training/test groups. This randomness has always raised doubts regarding the classification results. For this reason, the possibility that the elements in which the classes in the data set are best separated from each other in either the training or test group exists. In this study, novel CV approaches based on k-means and k-medoids clustering are presented in order to minimize such disadvantages caused by data distribution. Thanks to these approaches, negative situations and doubts that may arise due to random data assignment can be minimized, if not eliminated. The results pertaining to confirmation of the reliability of the approaches proposed in the study were compared with the results of the S-CV and St-CV techniques, which were tried under equal conditions. According to the results of the comparison, the minimum Std value between the created folds was obtained thanks to the new approaches proposed in the study.
When the literature is examined, large data sets were used in a small number of studies for classification purposes because many researchers hesitate to test their new classification algorithms on large data sets due to the long training period and system fatigue. Thanks to the use of the approaches presented in this study, the Std value between the fold results of large data sets was minimized. Accordingly, it was proven that presenting a randomly selected fold without having to give all the folds to the classifier system yields approximately the same performance result. Thanks to this study, it is thought that large data sets can be easily used by researchers in testing of classifier systems.
Some aspects of the new approaches proposed in the study, which can be considered as advantages, are summarized below:
Thanks to these novel approaches, it is believed that the utilization of large-scale datasets, which have been less preferred in the existing literature, will increase. Nevertheless, as with any research, this study also has its share of limitations. The foremost among these limitations is the presence of inaccurate or missing values within the datasets. It is imperative to ascertain the presence of samples with missing value attributes in the datasets under examination. Otherwise, it will cause errors because the related system cannot identify this situation. On the other hand, it is possible to correct or complete the data defined as incorrect/incomplete with some methods. Nonetheless, introducing additional methods into the system to identify and rectify such instances necessitates an extra computational burden. In truth, this issue of missing data is pervasive within this research domain and calls for further investigation. The second limitation pertains to working on more real-world problems with large data in order to enhance the dependability of the systems. However, challenges persist in terms of accessing and recording extensive data in the literature. Moreover, the number of researchers inclined to work with these datasets in the literature remains relatively limited. This acts as a hindrance to the wider proliferation of big data. In essence, when evaluated from this standpoint, we believe that our research has the potential to steer the attention of researchers in the field towards large-scale data.
In recent years, data analysis methods based on machine learning have gained significant importance. However, the application of these methods on large datasets is limited. Researchers have avoided these datasets due to reasons such as computation time and performance imbalances. Moreover, the reliability of data separation methods discussed in the literature is questioned due to the random distribution of data. In this study, unlike those in the literature, novel CV approaches based on k-means and k-medoids clustering were presented in order to overcome a deficiency in this field. In this way, the study aim was to eliminate the disadvantages caused by randomness and doubts in the results. In algorithms created using clustering methods, the number of clusters into which the data will be divided and the number of resulting folds was automatically realized. The system benefited from the number of samples in clusters obtained at the stage of determining the number of folds. While determining the number of folds required for each data set, the number of samples in the clusters was examined. If the number of samples in the clusters is not less than 10, the number of folds is taken as 10. Otherwise, the number of folds is taken equal to the minimum number of samples. Based on the proposed CV methods, the data in the folds were composed without randomness in a certain order. The methods were tested on large data sets and compared with the results of S-CV and St-CV. When the results are analyzed, the maximum ACC values were reached for all the data sets using the k-means CV approach. However, the minimum Std values between the folds were obtained for 4 out of 5 data sets using the k-medoids CV. As a result of the application, the maximum ACC value was reached in elect data with approximately 100%. When examining the datasets, it is observed that skin has the highest number of instances. Regarding the Std results, it is seen that the best performance was achieved with a value of 0.022 in this dataset. This result indicates that as the number of examples increases, more coherent clusters can form within them, reducing the standard deviation difference between folds, and enhancing the reliability of the results. Furthermore, the potential positive contribution of having a higher number of features in the data to the success of class separations should not be ignored. The St-CV, for which the performance values were compared, was the worst method in terms of both the ACC and Std results for all of the tested data sets. When the results are generally evaluated in terms of Std values, it could be seen that minimum Std results were obtained by the proposed novel CV approaches. To put it briefly; in particular, presenting all the folds of larger data sets to the systems will cause both an increase in calculation time and unnecessary system fatigue. Thanks to the CV approaches proposed in this study, rather than presenting all the folds to the system in order, performing analysis by selecting any of the folds could prevent similar disadvantages.
In future, the proposed methods can be applied on smaller, larger or more varied data sets. Also, number of folds and clusters can be changed for certain numbers in manual mode instead of automatically. In this way, the effect of number of folds on the results can be examined. In addition to this, other classifier algorithms such as Decision Trees, Support Vector Machines, Random Forest or Naive Bayes can be used. After applying the feature selection and dimension reduction methods frequently used in the literature, the methods can be presented to the proposed approach algorithms. Thus, it can be understood which feature contributes positively or negatively to the algorithm’s performance. As a result, the system will be capable of completing transactions more quickly. It is thought that techniques similar to those that can be applied on the properties of the data will contribute positively to the processing of large data sets.
The data that support the findings of this study are available at reference [14] (UCI Machine Learning Repository [http://archive.ics.uci.edu/ml]).
YC: Supervision, Conceptualization, Methodology, Software, Formal analysis, Validation, Investigation, Writing - Original Draft, Writing - Review & Editing; YŞ: Conceptualization, Methodology, Software, Formal analysis, Validation, Investigation, Writing - Original Draft, Writing - Review & Editing.
YC is an Asst. Prof. Dr. of Electronics and Automation Department at Tarsus University in Turkey. In 2016, he received the “Young Scientist Award” from the Aalborg University, Department of Energy Technology, Esbjerg, Denmark. His research focuses on biomedical and digital signal processing, expert systems, classification, data mining, artificial intelligence and machine learning algorithms, etc.
YŞ is an Assoc. Prof. Dr. of Computer Engineering Department at Tarsus University in Turkey. In 2016, she received the “Young Scientist Award” from the Aalborg University, Department of Energy Technology, Esbjerg, Denmark. Her research focuses on biomedical and digital signal processing, expert systems, classification, data mining, artificial intelligence and machine learning algorithms, etc.
The mathematical expression of the silhouette value [21-23]:
i: any sample in the data set (data(i))
A: the cluster in which data(i) is located (cluster-A) ‘C(A)’
a(i): average of the distance of data(i) from other data in C(A). a(i) is an indication of how much data(i) belongs to the cluster in which it is located. A direct proportion between the smallness of this value and the degree to which it is assigned to the cluster exists.
B: the adjacent cluster closest to the cluster to which data(i) belongs among other clusters (cluster-B) ‘C(B)’
b(i): average of the distance of data(i) from other samples in C(B).
s(i): Silhouette value (2) [21-23]
$s(i)=\frac{b(i)-a(i)}{\max (a(i), b(i))}$ (2)
[1] Tax, D.M., Van Breukelen, M., Duin, R.P., Kittler, J. (2000). Combining multiple classifiers by averaging or by multiplying? Pattern Recognition, 33(9): 1475-1485. https://doi.org/10.1016/S0031-3203(99)00138-7
[2] Chan, K., Lee, T.W., Sample, P.A., Goldbaum, M.H., Weinreb, R.N., Sejnowski, T.J. (2002). Comparison of machine learning and traditional classifiers in glaucoma diagnosis. IEEE Transactions on Biomedical Engineering, 49(9): 963-974. https://doi.org/10.1109/TBME.2002.802012
[3] Muraina, I. (2022). Ideal dataset splitting ratios in machine learning algorithms: general concerns for data scientists and data analysts. In 7th International Mardin Artuklu Scientific Research Conference, pp. 496-504.
[4] Geisser, S. (1975). The predictive sample reuse method with applications. Journal of the American Statistical Association, 70(350): 320-328. https://doi.org/10.1080/01621459.1975.10479865
[5] Arlot, S., Celisse, A. (2010). A survey of cross-validation procedures for model selection. Statistics Surveys, 4: 40-79. https://doi.org/10.1214/09-SS054
[6] Stone, M. (1974). Cross‐validatory choice and assessment of statistical predictions. Journal of the Royal Statistical Society: Series B (Methodological), 36(2): 111-133. https://doi.org/10.1111/j.2517-6161.1974.tb00994.x
[7] Diamantidis, N.A., Karlis, D., Giakoumakis, E.A. (2000). Unsupervised stratification of cross-validation for accuracy estimation. Artificial Intelligence, 116(1-2): 1-16. https://doi.org/10.1016/S0004-3702(99)00094-6
[8] Allen, D.M. (1974). The relationship between variable selection and data agumentation and a method for prediction. Technometrics, 16(1): 125-127. https://doi.org/10.1080/00401706.1974.10489157
[9] Breiman, L., Friedman, J.H., Olshen, R.A., Stone, C.J. (1984). Classification and regression trees. Belmont, CA: Wadsworth. International Group, 432: 151-166.
[10] Breiman, L., Spector, P. (1992). Submodel selection and evaluation in regression. The X-random case. International Statistical Review/Revue Internationale de Statistique, 6(3): 291-319. https://doi.org/10.2307/1403680
[11] Kohavi, R. (1995). A study of cross-validation and bootstrap for accuracy estimation and model selection. International Joint Conference on Artifcial Intelligence (IJCAI), 14(2): 1137-1145.
[12] Tan, P.N., Steinbach, M., Kumar, V. (2006). Introduction to Data Mining. Addison Wesley, p. 769.
[13] Velmurugan, T., Santhanam, T. (2010). Computational complexity between K-means and K-medoids clustering algorithms for normal and uniform distributions of data points. Journal of Computer Science, 6(3): 363-368.
[14] Dua, D., Graff, C. (2019), UCI Machine Learning Repository. University of California, School of Information and Computer Science, Irvine, CA. http://archive.ics.uci.edu/ml.
[15] Larson, S.C. (1931). The shrinkage of the coefficient of multiple correlation. Journal of Educational Psychology, 22(1): 45-55. https://doi.org/10.1037/h0072400
[16] Mosteller, F., Tukey, J.W. (1968) Data analysis, including statistics. Handbook of Social Psychology, Vol. 2, G. Lindzey and E. Aronson, Eds. Addison-Wesley, 8: 203.
[17] Likas, A., Vlassis, N., Verbeek, J.J. (2003). The global k-means clustering algorithm. Pattern Recognition, 36(2): 451-461. https://doi.org/10.1016/S0031-3203(02)00060-2
[18] MacQueen, J. (1967). Some methods for classification and analysis of multivariate observations. Proceedings of the fifth Berkeley symposium on mathematical statistics and probability. Oakland, CA, USA, 1: 281-297.
[19] Evans, R.S., Lloyd, J.F., Stoddard, G.J., Nebeker, J.R., Samore, M.H. (2005). Risk factors for adverse drug events: A 10-year analysis. Annals of Pharmacotherapy, 39(7-8): 1161-1168. https://doi.org/10.1345/aph.1E642
[20] Aggarwal, C.C., Hinneburg, A., Keim, D.A. (2001). In: Van den Bussche J., Vianu V. (eds) Database Theory — ICDT 2001. Lecture Notes in Computer Science. Springer, Berlin, Heidelberg, 1973: 420-434. https://doi.org/10.1007/3-540-44503-X_27
[21] Rousseeuw, P.J. (1987). Silhouettes: A graphical aid to the interpretation and validation of cluster analysis. Journal of Computational and Applied Mathematics, 20: 53-65. https://doi.org/10.1016/0377-0427(87)90125-7
[22] De Amorim, R.C., Hennig, C. (2015). Recovering the number of clusters in data sets with noise features using feature rescaling factors. Information Sciences, 324: 126-145. https://doi.org/10.1016/j.ins.2015.06.039
[23] Kaufman, L., Rousseeuw, P.J. (2009). Finding Groups in Data: An Introduction to Cluster Analysis. John Wiley & Sons.
[24] Park, H.S., Jun, C.H. (2009). A simple and fast algorithm for K-medoids clustering. Expert Systems with Applications, 36(2): 3336-3341. https://doi.org/10.1016/j.eswa.2008.01.039
[25] Arzamasov, V., Böhm, K., Jochem, P. (2018). Towards concise models of grid stability. In 2018 IEEE International Conference on Communications, Control, and Computing Technologies for Smart Grids (SmartGridComm), Aalborg, Denmark, pp. 1-6. https://doi.org/10.1109/SmartGridComm.2018.8587498
[26] Candanedo, L.M., Feldheim, V. (2016). Accurate occupancy detection of an office room from light, temperature, humidity and CO2 measurements using statistical learning models. Energy and Buildings, 112: 28-39. https://doi.org/10.1016/j.enbuild.2015.11.071
[27] Alimoglu, F. (1996). Combining multiple classifiers for pen-based handwritten digit recognition. Master’s Thesis, Institute of Graduate Studies in Science and Engineering, Bogazici University.
[28] Bhatt, R.B., Sharma, G., Dhall, A., Chaudhury, S. (2009). Efficient skin region segmentation using low complexity fuzzy decision tree model. In 2009 Annual IEEE India Conference, Ahmedabad, India, pp. 1-4. https://doi.org/10.1109/INDCON.2009.5409447
[29] Dhall, A., Sharma, G., Bhatt, R., Khan, G.M. (2009). Adaptive digital makeup. In International Symposium on Visual Computing. Springer Berlin Heidelberg, pp. 728-736. https://doi.org/10.1007/978-3-642-10520-3_69
[30] Dorofki, M., Elshafie, A.H., Jaafar, O., Karim, O.A., Mastura, S. (2012). Comparison of artificial neural network transfer functions abilities to simulate extreme runoff data. International Proceedings of Chemical, Biological and Environmental Engineering, 33: 39-44.