Ozge Nur Ergun![]() | Hamza Osman Ilhan*
| Hamza Osman Ilhan*![]()
© 2023 IIETA. This article is published by IIETA and is licensed under the CC BY 4.0 license (http://creativecommons.org/licenses/by/4.0/).
OPEN ACCESS
In the realm of ophthalmology, diabetic retinopathy (DR) represents a critical concern, arising from the detrimental effects of blood sugar fluctuations on retinal vessels, and frequently evades early detection due to the absence of initial symptoms. Addressing this challenge, the current study delineates a novel classification methodology designed to gauge the severity of DR, thereby laying the groundwork for an early warning system. Within this methodology, an assortment of five deep learning models—namely VGG16, VGG19, EfficientNetB5, EfficientNetB7, and EfficientNetV2S—underwent training and evaluation processes utilizing the Asia Pacific Tele-Ophthalmology Society (APTOS) 2019 dataset, characterized by its imbalanced nature. The study juxtaposes the VGG models, noted for their simplicity yet burdened with a higher parameter count, hence more computationally and memory-intensive, against the EfficientNet models, which are renowned for their efficiency achieved through optimal network scaling. This selection of two VGG variants and three EfficientNet models facilitated a comprehensive analysis of the effects of model complexity, parameter volume, and computational efficiency on the classification efficacy in DR. Additionally, the study employed ensemble techniques, encompassing both hard and soft voting methods along with stacked generalization, to enhance classification performance by counteracting the impact of dataset imbalance. The individual model performances revealed that the EfficientNetB5 model registered the lowest accuracy at 88.12%, while the EfficientNetB7 model attained the highest accuracy, standing at 94.07%. The ensemble approaches, incorporating both soft and hard voting techniques, demonstrated further improvement, achieving accuracy scores of 94.84%. However, it was the stacked generalization approach that emerged as the most effective, recording a remarkable accuracy of 95.55%. These findings corroborate that the ensemble models, through their collective strength, surpass the accuracy rates of individual models, thereby eclipsing the performance benchmarks set by existing literature in the field by effectively mitigating the influence of data imbalance on classification accuracy.
diabetic retinopathy (DR), ensemble deep learning, hard voting, soft voting, stacked generalization
Diabetes, characterized by elevated and fluctuating blood sugar levels, stands as an incurable disease impacting over 400 million individuals globally. It is projected that by 2040, approximately 642 million middle-aged individuals will be affected by diabetes [1]. This chronic condition not only poses a direct threat to life but also precipitates secondary complications in various bodily systems, including the heart, blood vessels, kidneys, and eyes. Among these complications, DR, a consequence of retinal vessel damage induced by high blood sugar, is a prominent concern.
DR is typically categorized into two principal stages: non-proliferative and proliferative [2]. The non-proliferative stage, being the initial phase, is marked by blurred vision due to leakage from minute blood vessels. The proliferative stage represents an advanced progression of the disease. In the absence of early detection, the retina commences the formation of new blood vessels, which are prone to bleeding. The severity of bleeding correlates with the risk of intermittent or permanent vision loss [3].
The necessity of early detection of DR to prevent vision impairment is well-acknowledged. Annual diabetic eye screenings are advocated for individuals with diabetes. These screenings entail the examination of retinal vessels through photographic imaging, facilitating the early identification of DR prior to any significant impact on vision [4]. Timely diagnosis enables patients to mitigate the side effects of DR through lifestyle modifications.
In the diagnostic process, photographs from diabetic eye screenings are scrutinized by medical professionals, with a focus on blood vessel and retinal feature analysis. To enhance this diagnostic approach, the application of deep learning methods is being explored. Deep learning, a subset of computer science, endeavors to emulate human brain functions to address complex issues [5]. The implementation of deep learning techniques offers the potential to utilize existing eye screening data for the predictive analysis of new screening images.
The literature has seen the publication of several datasets, notably APTOS 2019 [6], EyePACS [7], IDRiD [8], and Messidor [9], all aimed at advancing automated deep learning-based tools for DR detection. These datasets are composed of retinal eye fundus color images, each presenting varying severity levels of DR, and have been clinically graded by medical experts. The primary challenges associated with these datasets are their size and the distribution of classes within them. For instance, IDRiD exhibits a limited number of image samples across each class, presenting a significant hurdle for deep learning-based research. Conversely, the APTOS 2019 dataset is characterized by an imbalance in the quantity of images per class, which introduces bias into the classification results.
Focusing on the APTOS 2019 dataset, studies utilizing the transfer learning approach have yielded commendable results in classification performance. Sheikh and Qidwai's investigation involving four pre-trained networks-DenseNet, VGG, ResNet, and Inception models-revealed that the utilization of PNG format images in model training enhanced classification performance when compared to JPEG format images [10]. They underscored the critical role of normalization in achieving more precise and consistent outcomes. Their research documented classification accuracies on the APTOS 2019 dataset using PNG format images post-normalization: 90.5% with DenseNet121, 79.3% with VGG16, 84.7% with ResNet50, and 85.8% with InceptionV3 models.
In a similar vein, Rahman and Dola explored the efficacy of data augmentation techniques applied to original RGB format images as a preliminary step in dataset balancing [11]. They then applied three deep learning networks within a transfer learning framework to the APTOS 2019 dataset. Their findings indicated classification accuracies of 96.54% for DenseNet169, 90.93% for DenseNet121, and 90.93% for ResNet50 models.
In a distinct approach, Lu et al. [12] implemented an enhancement of images by integrating YPbPr and brightness spaces. Their methodology incorporated various image processing techniques including resizing, contrast-limited adaptive histogram equalization, and background removal. A custom architecture was developed, comprising two distinct blocks: the ShuffleNet V2 basic block and the ShuffleNet V2 block for spatial downsampling. This approach yielded a maximum accuracy of 96.66% on the APTOS 2019 dataset.
Yadav et al. [13] explored multiple architectures, such as InceptionResNetV2, InceptionV3, Xception, MobileNetV2, VGG19, and DenseNet201. Their findings highlighted InceptionResNetV2 architecture as the most accurate model.
Considering the importance of image processing in computer vision problems, Samanta et al. [14] applied crucial preprocessing steps such as the elimination of non-informative black backgrounds and the application of CLAHE (Contrastive Limited Adaptive Histogram Equalization). Utilizing a transfer learning approach with the DenseNet121 network on the APTOS 2019 dataset, they achieved a kappa score of 0.8836 on validation data and 0.9809 on training data.
Sugeno et al. [15] commenced their study by removing blurry or duplicate images from the dataset, followed by extracting non-essential content from the background. They also applied a Laplacian filter and introduced a masking method for red or white lesions. Post-preprocessing, the EfficientNetB3 model was implemented under a transfer learning framework, achieving a classification accuracy of 84% on the APTOS 2019 dataset.
In a similar endeavor, Gangwar and Ravi [16] focused on the Messidor and APTOS 2019 datasets to determine DR severity. Techniques such as blurring, background elimination, and data augmentation were employed during preprocessing. Their architecture included a modified pre-trained InceptionResNet-v2 model with additional convolutional layers. The proposed model attained test accuracies of 72.33% and 82.18% on the Messidor and APTOS 2019 datasets, respectively.
Islam et al. [17] adopted the CLAHE technique for image enhancement on the APTOS 2019 dataset as an initial step. Moreover, they utilized supervised contrastive learning, a method involving two augmented versions of the same input to identify similar feature sets for varying input images' detection processes. This technique led to classification accuracies of 98.36% for DR and non-DR categorization and 84.36% for predicting DR severity.
Ingle and Ambad [18] incorporated CLAHE in part of their research, developing two models using CLAHE and FastAI model generation techniques. They implemented image preprocessing steps, such as rotation, scaling, and lighting, to improve model accuracies before introducing the augmented data to a pretrained ResNet50 model. Their findings indicated accuracies of 93% for the CLAHE-based method and 95% for the FastAI-based approach on the processed APTOS 2019 dataset.
Hayati et al. [19] also adopted a CLAHE-based image enhancement technique to develop an accurate classifier. Post image preprocessing, they utilized pretrained models like VGG16, ResNet34, InceptionV3, and EfficientNetB4, reporting an accuracy of 97.83% on the APTOS 2019 dataset with the EfficientNetB4 model.
Aswini et al. [20] introduced a novel histogram equalization method to augment contrast. Subsequently, they employed the Grey Level Cooccurrence Matrix (GLCM) for feature extraction and fed these features into an Improved AlexNet Model-based CNN (IAM-CNN) classifier to ascertain DR severity levels.
In various studies, feature vectors have been pivotal in extracting retinal information, with the classification of these features indicating potential for enhanced results. For example, Bodapati et al. analyzed the feature maps of the pretrained VGG16 model, achieving a classification accuracy of 84.31% on the APTOS 2019 dataset [21].
Shaik and Cherukuri [22] applied CLAHE separately to the RGB channels of retinal images. They utilized the VGG16 network for feature extraction, reporting classification accuracies of 85.54% on the APTOS 2019 dataset and 66.41% on the IDRiD dataset.
In a study conducted by Shaik and Cherukuri [23], the Xception architecture was employed to extract lesion-specific features from retinal images. Utilizing these features, a neural SVM was trained, achieving accuracies of 63.24% on the IDRiD dataset and 84.31% on the APTOS 2019 dataset.
Canayaz [24] adopted a neural network-based feature extraction methodology for classifying images from both the APTOS 2019 and Messidor-2 datasets. The study employed DenseNet121 and EfficientNetB0 models for deep feature extraction, followed by the application of feature selection algorithms. The selected features were then utilized in conjunction with classical machine learning models, such as support vector machine, random forest, and k-nearest neighbor, culminating in an accuracy of 95.85%.
Zhang et al. [25] implemented a multi-point attention-based semi-supervised learning approach on the APTOS 2019 dataset, reporting an accuracy of 90.3%. Cahoon et al. [26] noted the high imbalance of classes within the APTOS 2019 dataset and advocated for data augmentation to achieve class balance, resulting in a reported accuracy of 80% post-balancing.
The concept of model or dataset ensembling has been explored in several studies to improve the prediction performance for DR severity levels. Karki and Kulkarni [27] merged two DR datasets, namely APTOS 2019 and EyePACS, to create an ensemble of deep learning models. They trained models including EfficientNetB1, EfficientNetB2, EfficientNetB3, and EfficientNetB5, and achieved a kappa score of 92.43%.
Sikder et al. [28] extracted histogram features from retinal images and constructed an ensemble of decision trees using the bagging method. They documented a classification accuracy of 91.07% on the APTOS 2019 dataset. In a subsequent study, Sikder et al. [29] eliminated noisy and duplicate images and adjusted the contrast levels of images as a preprocessing measure. The proposed ensemble of classifiers reported an accuracy score of 94.20% on the APTOS 2019 dataset.
Ensemble techniques have been a focal point in numerous studies involving deep neural networks. Bodapati et al. [30] implemented a multi-model fusion strategy using pretrained VGG16 and Inception models. Their findings indicated that this multi-model fusion significantly enhanced classification performance, achieving a DR detection accuracy of 97.82% and a DR severity prediction accuracy of 82.54% on the APTOS 2019 dataset. Kaushik et al. [31] employed a technique of concatenating the outputs of three custom-built CNNs, which were then input into an additional dense layer for classification. This approach resulted in an accuracy of 97.92% for DR detection and 87.45% for DR grading.
Yue et al. [32] introduced an attention-driven cascaded network concept, focused on detecting the severity level of DR. This model extracts context features from the current layer to aid in the generation of lesion-aware information for subsequent layers, reporting an accuracy of 83.40% on the APTOS 2019 dataset.
Playout et al. [33] developed a custom vision transformer and compared its performance with ResNet152, WideResnet101, and Optic-Net71 CNN models on the APTOS 2019 dataset. Among these, the Optic-Net71 emerged as the most accurate, with an accuracy of 92.59%.
Nahiduzzaman et al. [34] proposed an extreme learning machine architecture. Following feature scaling, the extracted features were fed into this network, culminating in a classification accuracy of 97.27% on the APTOS 2019 dataset. Bhuvaneswari and Vaidyanathan [35] generated feature maps using convolutional layers and then constructed an ensemble comprising support vector machine, random forest, and Adaboost classifiers, reporting an accuracy of 96.2%.
Some studies have concentrated specifically on the detection of the presence or absence of DR, rather than assessing its severity. In these instances, retinal images within datasets are reclassified into two groups: DR and no_DR. The primary aim of such analyses is to efficiently identify DR cases, without delving into the severity level of the condition.
Cinarer and Kilic [36] applied a Gaussian filter and data augmentation to the reorganized APTOS 2019 dataset, categorized into DR and no_DR groups. Their approach yielded classification accuracies of 95.26% for the AlexNet model and 98.17% for the VGG16 model. Dwivedi and Attry [37] explored various models within transfer learning approaches for binary classification of DR on the APTOS 2019 dataset. The highest recorded accuracy was 96.73% using the MobileNetV2 model.
Sanjana et al. [38] utilized a range of models including Xception, InceptionResNetV2, MobileNetV2, DenseNet121, and NASNetMobile on the APTOS 2019 dataset for DR detection. The respective accuracies achieved were 86.25%, 96.25%, 93.75%, 81.25%, and 80%.
Padmanayana and Anoop [39] focused on creating an accurate binary classifier for the APTOS 2019 dataset. Their methodology encompassed image processing techniques such as cropping, resizing, Gaussian blur, and CLAHE filtering, followed by inputting the images into a custom-built CNN model. They reported a test accuracy of 94.6% in DR detection.
Zhang et al. [40] adopted a source-free transfer learning approach, initially training models from scratch on the extensive EyePACS dataset, specifically for retinopathy images. Post-learning phase, these models were employed to classify the APTOS 2019 dataset, which was reclassified into two classes: DR and no-DR. This method achieved an accuracy of 91.2% on the binary dataset for DR classification.
In a study focusing on DR detection, Adriman et al. [41] extracted Local Binary Patterns (LBP) from retinal images in the APTOS 2019 dataset. They then trained models such as ResNet, DenseNet, and DetNet using these LBP feature sets. The highest accuracy of 96.35% was observed with the ResNet34 model, while Densenet121 and DetNet59 models achieved accuracies of 84.05% and 93.99%, respectively.
Li et al. [42] innovated in the field of binary DR detection by implementing a graph network. Utilizing auto-encoder feature learning for retinal feature extraction, they applied a graph convolutional network (GCN) with these features, achieving an accuracy of 94.4% on the APTOS 2019 dataset.
While previous studies have made significant strides in the machine learning-based diagnosis of DR, there remains a lack of research employing a stacked generalization approach over a soft voting-based fusion concept. The current study introduces an ensemble learning model that incorporates decision-level fusion and a stacked generalization approach using a 1D CNN architecture, aiming to enhance the classification of DR across four severity levels.
The key contributions of this research are outlined as follows: i) The proposed model was tested on the APTOS 2019 dataset, renowned in DR research, to assess its generalization capabilities and mitigate bias in unbalanced databases. ii) The individual performances of five advanced deep learning architectures, namely VGG16, VGG19, EfficientNetB5, EfficientNetB7, and EfficientNetv2S, were evaluated. iii) A combination of the decisions from individual classifiers was achieved using two majority voting schemas (hard and soft voting) for decision-level fusion. iv) The ensemble learning approach, not previously applied in DR classification literature, was anticipated to yield more accurate results than base models, particularly through the novel implementation of a stacked generalization ensemble concept. v) Experimental results underscored the effectiveness and robustness of the proposed ensemble approach in accurately determining the severity level of DR, as evidenced by high general accuracy, F1-scores, precision, and recall values.
The structure of the remainder of the study is organized as follows: Section 2 introduces the materials and methods used; Section 3 presents the experimental results; Section 4 discusses these findings; and Section 5 concludes the study.
In this study, five advanced deep learning models, specifically VGG19, VGG16, EfficientNetB3, EfficientNetB7, and EfficientNetv2S, were employed to assess the severity of DR. Furthermore, two majority voting schemes, namely hard and soft voting, were applied to evaluate the contribution of decision-level fusion to the classification performance of individual models. Additionally, a 1-D CNN model-based stacked generalization approach was implemented on the outcomes of the soft voting process. All experiments were conducted using the APTOS 2019 dataset, recognized as the most prominent DR dataset.
2.1 Dataset information
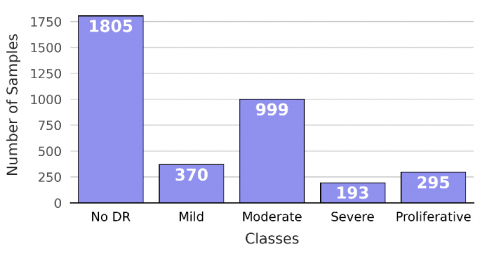
In 2019, the APTOS compiled a dataset for DR, aiming to facilitate the prediction of its severity and presence. The APTOS 2019 dataset, which is publicly accessible and downloadable from Kaggle [6], comprises 3662 retinal images. These images were sourced from multiple clinics utilizing various camera types. Experts have classified the images into five categories: no DR, mild, moderate, severe, and proliferative DR. Figure 1 illustrates the distribution of these images across the different classes.
Figure 1. The distribution of the images over the classes in APTOS 2019 dataset
2.2 Proposed approach
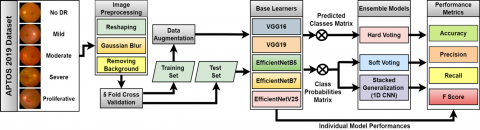
This study introduces a stacked generalization approach applied to the soft voting results of five deep learning models for classifying the severity of DR in the APTOS 2019 dataset. Prior to the training phase, various de-noising processes were performed on the images. The deep neural network architectures selected as base learners for the decision-level fusion step included VGG19, VGG16, EfficientNetB3, EfficientNetB7, and EfficientNetv2S. 1D-CNN was designed for use in the stacked generalization phase. The workflow of the study is summarized in Figure 2, with detailed explanations provided in subsequent sub-sections.
Figure 2. Flowchart of the proposed approach
2.2.1 Preprocessing methods
The APTOS 2019 dataset, comprising retinal images collected from multiple clinics using different camera types, inherently includes noisy and blurred images due to the varied equipment used. To address this, data preprocessing techniques were employed as a preliminary part of the proposed approach.
Initially, the high-resolution retinal images were resized to 224×224 pixels, a dimension compatible with the specific requirements of the VGG and EfficientNet architectures utilized. Subsequently, a Gaussian filter was applied to mitigate salt and pepper noise, characterized by sudden pixel intensity variations. Furthermore, considering the retinal zone in the images is typically encircled by uninformative black backgrounds, a histogram-based automatic cropping process was implemented. This step aimed at eliminating the background and isolating the retinal area. It involved threshold-based histogram filtering on the intensity values of each pixel, where columns or rows consisting solely of black pixels were removed. Finally, spatial domain data augmentation techniques were applied to the original images to enhance model robustness and consistency. The chosen augmentation methods included rotations up to 60 degrees, horizontal and vertical image flipping, image zooming by a scale of 0.2, and intensity rescaling to grayscale. These parameters were selected to maintain the integrity of the original image data and avoid distortions that could introduce errors, potentially resulting in inaccurate data inputs into the models.
2.2.2 Base learners: Deep learning models
Machine learning, a subset of artificial intelligence, harnesses data to develop predictive models for intricate problems, blending statistical and artificial intelligence techniques [43]. Deep learning, a specialized branch of machine learning, utilizes neural networks. Unlike traditional neural networks, deep networks not only learn the relationships among variables but also comprehend the underlying principles governing these relationships [44]. Consequently, deep learning methods have achieved remarkable accuracy and effectiveness in complex classification challenges, such as diagnosing DR.
In this research, deep networks were employed as the foundational learners in predicting the presence and severity of DR using retinal images from the well-regarded APTOS 2019 dataset. Five models-VGG16, VGG19, EfficientNetB5, EfficientNetB7, and EfficientNetV2S-were chosen for their unique attributes. VGG models, although older, are known for their simplicity but tend to be computationally expensive and memory-intensive due to their large parameter count. In contrast, the EfficientNet series represents more recent architectures, designed to balance high performance with efficiency through optimal network scaling. This study selected different versions of both VGG and EfficientNet models to examine the effects of model complexity, parameter quantity, and computational efficiency on classifying DR. Each model was adapted using the transfer learning approach, pre-trained on the extensive ImageNet dataset. Modifications to dense and dropout layers were made to optimize them for the APTOS 2019 dataset. During the training phase, hyperparameter tuning was conducted, and the optimal parameters were identified. The Adam optimizer was set at a learning rate of 0.0001 with a batch size of 32, based on preliminary study findings. Training iterations were capped at 25 epochs with an early stopping feature, which halts training if no progress in loss function is observed after 5 epochs.
Given the significant class imbalance in the dataset, a class weight balancing technique was applied. During training, each class was assigned a weight inversely proportional to its sample size. This technique adjusted the training loss calculation to consider class weights, applying more severe penalties for misclassifications in heavily weighted classes. This approach aimed to counteract the models' tendency to favor predicting the more common class. Unlike previous studies that relied solely on data augmentation to synthesize images for balancing class samples, this study utilized both class weight balancing and data augmentation, emphasizing the importance of original images during training.
In terms of model validation, two prominent methods are generally employed. One common method involves dividing the dataset into three distinct subsets: training, validation, and testing, each allocated specific ratios. However, it is crucial to acknowledge that the random division of data in this approach can potentially skew the model's performance, as it may not representatively reflect the overall dataset. Additionally, a fixed split could restrict the amount of data available for training or validation, possibly leading to less-than-optimal model training and tuning. Consequently, the k-fold cross-validation method is deemed more suitable, particularly for datasets with limitations and imbalances, such as the APTOS 2019. This method provides a more comprehensive evaluation of the trained model's performance [45]. In this study, a 5-fold validation was employed, necessitated by the computational demands of training five pre-trained deep learning models. In this validation scheme, each model is subjected to training and validation five times, with each of the five folds serving as the validation set once (comprising 732 images from the APTOS 2019 dataset), while the remaining folds are utilized for training. The ultimate performance metric is calculated as the average outcome across all iterations.
Ensemble learning, the strategy of integrating multiple base learners to generate a collective output, is also known as decision-level fusion in deep networks [46]. This method is efficient in producing models that are not only individually successful but also function as independent decision-makers. In this research, three different decision-level ensemble approaches were applied to the base learners to achieve enhanced accuracy.
2.2.3 Hard voting
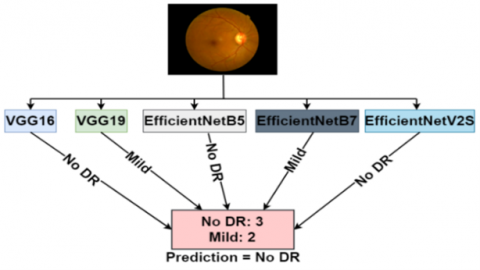
Hard voting is an ensemble technique that amalgamates the class predictions from multiple models. In this study, five deep learning models were trained using identical training sets. For each image in the test set, the classification predictions from each model were collated. The final class assignment for each image was determined by the majority vote among these predictions in the hard voting ensemble method. The implementation of hard voting is illustrated in Figure 3, using an example image for demonstration.
Figure 3. Hard voting over an example image
2.2.4 Soft voting
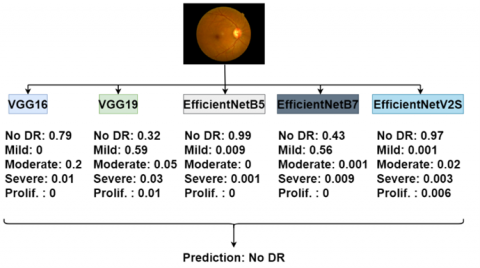
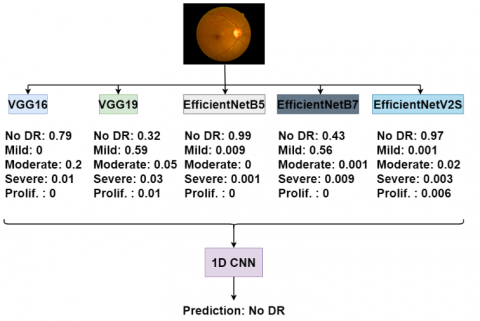
Soft voting, akin to hard voting, is a decision-level fusion method that leverages outputs from multiple models. However, it diverges in its approach by considering the class assignment probabilities of each model instead of solely relying on classification predictions, as in hard voting. The ensemble structure takes into account the summed probabilities of class assignments from different models. The final decision is then based on the majority of these total probabilities. To evaluate the performance of the soft voting ensemble method, a similar training and testing procedure was executed as with hard voting. The models were trained with the same dataset, and the classification probabilities generated by these models were aggregated. The class of the image is then determined based on the highest total probability ratio. The implementation of soft voting is depicted in Figure 4.
Figure 4. Soft voting over an example image
2.2.5 Stacked generalization
Stacked generalization, akin to hard and soft voting methods, is another ensemble learning technique that utilizes multiple models for the final decision-making process. However, distinct from the majority voting mechanism employed in both soft and hard voting, stacked generalization is founded on the principle of training an additional model using the outputs of the base models [47]. This can be executed by employing either the predicted classes or the prediction probabilities of the base models. Prior research indicates that the use of model probabilities tends to yield more accurate results [48]. Accordingly, a stacked generalization architecture that leverages the prediction probabilities of base learners has been implemented for analyzing retinal images. The output probabilities from the five base learners are input into a 1D-CNN model. The workflow of the stacked generalization method applied in this study is depicted in Figure 5.
Figure 5. Stacked generalization over an example image
2.2.6 Performance metrics
In evaluating the models' performance for determining the severity of DR, this study utilized accuracy, precision, recall, and F1-score metrics. Accuracy indicates the proportion of correctly predicted samples in the entire dataset. Precision measures the fraction of positive identifications that are actually correct. Recall assesses how many true positive instances are correctly identified. The F1-score is a composite metric that reflects the balance between precision and recall. These metrics collectively provide a comprehensive assessment of the models' effectiveness in accurately classifying the severity levels of DR.
The experiments were conducted using Python on Google Colab, with the aid of an Nvidia Tesla T4 GPU (16GB) to expedite the training phase of the models. The test platform was also equipped with 12 GB of RAM and an Intel(R) Xeon(R) CPU, operating at a speed of 2.2 GHz.
Given the diverse conditions under which the images were collected, several preprocessing techniques such as background removal, blurring, resizing, and data augmentation were applied to standardize the input for the models. Five deep learning models—VGG16, VGG19, EfficientNetB5, EfficientNetB7, and EfficientNetV2—were chosen as base learners. For each model's training, the same augmented dataset version was used.
The efficacy of ensemble model approaches is intrinsically linked to the performance of the individual base models. Enhancing the performance of each base learner contributes to a more accurate overall classification score in the ensemble. To maximize base learner accuracy, a preliminary fine-tuning of hyper-parameters was conducted. Various combinations of hyperparameters, including the number of neurons, learning rate, dropout rate, activation functions, and optimization algorithms, were explored for each model. Additionally, early stopping was implemented as a criterion to halt training and prevent model overfitting. A learning rate scheduling approach was applied, where the rate remained unchanged for the initial 10 epochs, allowing the optimizer to make significant strides towards the global optimum. Subsequently, the learning rate was reduced by a factor of 0.1 every 10 epochs, facilitating finer optimization adjustments.
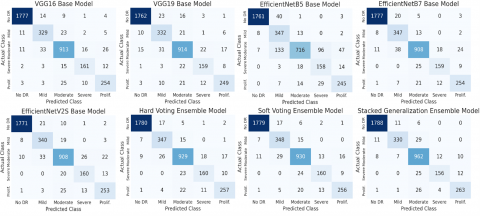
Figure 6. Confusion matrices of the models
Table 1. The performances of individual and ensemble usage of models (%)
|
Model Name |
Acc. |
Prec. |
Rec. |
F-Score |
|
VGG16 VGG19 EfficientNetB5 EfficientNetB7 EfficientNetV2S Hard Voting Soft Voting Stacked General. |
93.78 93.28 88.12 94.07 93.71 94.84 94.84 95.55 |
89.29 89.57 78.64 89.53 88.68 90.87 91.10 93.64 |
89.66 89.13 85.87 90.32 88.91 91.08 91.08 90.90 |
89.47 88.49 81.97 89.92 89.29 90.97 91.09 92.25 |
For validating the performance of both base and ensemble models, a K-Fold Cross-validation schema was employed, with the K-value set at five. This meant that the data was divided into training and test sets at an 80/20 ratio, with this arrangement repeated five times, each with a uniquely constituted 20% test set. The models' performances were validated based on scores obtained from the confusion matrices for each fold.
The final confusion matrices for each individual model, as well as the ensemble versions utilizing hard voting, soft voting, and the stacked generalization approach, are presented in Figure 6. The derived Accuracy, Precision, Recall, and F1 Scores from these matrices (Figure 6) are summarized in Table 1.
According to Table 1, the VGG16 and VGG19 models demonstrated comparable classification accuracies, largely due to their shared VGG architectural framework. These networks feature a sequential layer arrangement, which accounts for their higher parameter count and consequent computational and memory demands. When comparing methods with closely matched accuracies, such as VGG16 and VGG19, the F1 score, a combination of precision and recall, offers deeper insights. Notably, VGG16, being more compact and faster than VGG19, emerged as more efficient in DR classification, achieving an F1 Score approximately 1% higher. This advantage can be ascribed to the limited sample size of the APTOS 2019 dataset, which is not extensive enough to fully exploit the parameter-rich VGG19 network. Consequently, the scaled-down VGG model displayed slightly superior performance in certain classes, as indicated by its higher F-Score.
The EfficientNet architecture has been adapted into various sub-versions, each varying in width, depth, resolution, and other compound aspects. This study focused on two advanced iterations of the original EfficientNet baseline-B5 and B7-along with EfficientNet V2S, a custom variant designed to expedite training. From the 5-fold validation results, the EfficientNet B5 model displayed the lowest performance across all metrics, a consequence of its compact structure intended for versatile implementation across platforms. Specifically, its accuracy, precision, and recall were 88.12%, 78.64%, and 85.87%, respectively. In contrast, EfficientNet B7, characterized by greater depth and width than its counterparts and more sophisticated connections than VGG's sequential networks, outperformed all other individual models. It achieved accuracy, precision, and recall scores of 94.07%, 89.53%, and 90.32%, respectively, with the highest F1 score at 89.92%. EfficientNetV2S, incorporating custom adjustments to the EfficientNet framework, such as the removal of superfluous layers and parameter optimization, mirrored the performance of EfficientNetB7 closely. These results underscore the impact of network architecture adjustments on model efficiency and effectiveness.
Table 2. Class-wise performances of ensemble approaches
|
Method |
Acc. |
Label |
Prec. |
Recall |
F-Score |
|
Hard Voting |
94.84 |
No DR Mild Moderate Severe Prolif. Average |
99.05 88.07 93.46 84.21 89.55 90.87 |
98.61 93.78 92.99 82.90 87.12 91.08 |
98.83 90.84 93.22 83.55 88.31 90.97 |
|
Soft Voting |
94.84 |
No DR Mild Moderate Severe Prolif. Average |
98.94 87.22 93.47 85.10 90.78 91.10 |
98.56 94.05 93.09 82.90 86.78 91.08 |
98.75 90.50 93.28 83.99 88.73 91.09 |
|
Stacked General. |
95.55 |
No DR Mild Moderate Severe Prolif. Average |
98.89 94.56 91.79 90.70 92.28 93.64 |
99.06 89.19 96.29 80.83 89.15 90.90 |
98.98 91.79 93.99 85.48 90.69 92.25 |
In this study, three ensemble approaches were implemented alongside individual models. The hard voting approach combined the class assignment results from each model, with the final decision based on the majority vote. A crucial aspect of this method is the use of an odd number of models to avoid a tie in votes, representing a significant trade-off in hard voting. On the other hand, the soft voting approach aggregated class assignment probabilities, with the final classification based on the class having the highest cumulative probability. The key challenge in this method is efficient memory utilization. Both hard and soft voting are categorized as decision-level fusion techniques. Additionally, a stacked generalization approach was employed, which involved a 1D CNN architecture for classification, processing the output from the soft voting method. The design of the 1D CNN is critical, as it requires careful consideration of various parameter trade-offs. The overarching goal of these ensemble methods is to improve classification performance by capitalizing on the strengths of each base model, thereby achieving a more accurate and reliable outcome.
The results outlined in Table 1 demonstrate that all three ensemble methods surpassed individual network performances across all evaluated metrics. Both hard and soft voting methods achieved a classification accuracy of 94.84%. Notably, the soft voting approach was more effective in class label determination, evidenced by its higher precision score of 91.10%. The stacked generalization approach outperformed the others in terms of classification accuracy, achieving the highest rate at 95.55%. Furthermore, this approach also attained the highest precision score, which contributed to the highest F1 score of 92.25%, indicating a superior balance of precision and recall compared to the other methods.
As the ensemble model approaches yielded superior results, detailed class-wise metrics for the three utilized ensemble methods are provided in Table 2. This allows for a more granular analysis of each method's performance across different classes.
The three ensemble approaches demonstrated comparable performance for the 'No DR' and 'Moderate' DR classes, with each approach achieving around 98% and 93% accuracy, respectively. Notably, the hard voting approach, which focuses on model outputs rather than class probabilities, offers computational advantages due to its lower complexity. In the classification of the 'Mild' and 'Proliferative' DR classes, the stacked generalization method slightly surpassed both hard and soft voting methods. However, its most notable superiority was evident in the classification of the 'Severe' DR class, where it outperformed the other two approaches. In terms of precision, which measures the accuracy of positive identifications, stacked generalization was approximately 5% more precise than both hard and soft voting. However, hard and soft voting recorded recall scores—indicating the proportion of actual positives correctly identified—nearly 2% higher than that of stacked generalization. Consequently, this led to the stacked generalization approach achieving F1 scores, a balance of precision and recall, that were 2% and 1.5% higher than those of the hard and soft voting methods, respectively.
This research presented an evaluation of the performance of five deep learning models and three ensemble methods in classifying DR. The analysis, utilizing the APTOS 2019 dataset, focused on accuracy, precision, recall, and F1 score metrics. In selecting models for experimental validation, VGG16 and VGG19 were chosen to assess the efficacy of classical convolutional neural network architectures. Additionally, two official enhancements (B3 and B7) and one custom-designed model (V2S) based on the EfficientNet architecture were selected for exploring the impact of more complex structures on the APTOS 2019 dataset. Beyond the assessment of individual models, three ensemble approaches-hard voting, soft voting, and stacked generalization-were also examined.
The VGG16 and VGG19 models, though similar in their deep architecture, differ in their number of convolutional layers; VGG16 comprises 138.4 million parameters, while VGG19 has 143.7 million. Experimental findings revealed comparable performance for both models on the APTOS 2019 dataset, suggesting a need for larger datasets to effectively train deeper models such as VGG19.
From the EfficientNet architecture variants, three models were selected for this study: the B5 and B7 versions of EfficientNet, comprising 30.6 million and 66.7 million parameters, respectively, and the EfficientNet V2S, a custom design with 21.6 million parameters, engineered to expedite the training phase [49]. Despite having fewer parameters compared to the VGG16 and VGG19 models, EfficientNet B7 outperformed all with the most accurate classification. In contrast, EfficientNet B5, exhibiting a precision score at least 10% lower than its counterparts, recorded the lowest performance, indicating a higher rate of class assignment errors. This analysis demonstrates the significance of parameter count and architectural efficiency in deep learning models, particularly in the context of DR classification.
The experimental outcomes underscore the efficacy of ensemble methods in enhancing classification performance. The weakest base learner in this study, EfficientNet B5, achieved an individual classification accuracy of 88%. However, the ensemble approaches surpassed the accuracy of any single model, indicating that the integration of multiple models in the decision-making step can compensate for the incorrect classifications of individual base models.
Soft voting is particularly advantageous when the class probabilities provided by the base learners are closely matched. For example, if one model predicts a 49% probability for class 1 and another model predicts 51% for class 2, a model adept at distinctly differentiating between these two classes can offset the first model's uncertainty. Nevertheless, the findings of this study reveal that both soft and hard voting ensembles yielded comparable performance levels. This suggests that the class differentiation by the base learners was consistent and stable, and the choice between using class assignments or probabilities did not markedly affect the ensemble results. In the context of hard voting, it is imperative to employ an odd number of models to ensure an uneven number of decisions. This setup prevents a deadlock scenario where equal votes might render the ensemble ineffective, making this consideration vital for the success of the hard voting method.
Stacked generalization is anticipated to outperform soft voting as it utilizes the class probabilities to train an additional model. This model is capable of discerning the tendencies of each base learner by examining their outputs alongside the actual class labels. By acknowledging these tendencies, it can potentially achieve more precise results. The experimental findings of this study affirm that the stacked generalization model attained the highest accuracy, precision, and F1-score values. However, in the context of medical diagnosis, inaccurately classifying patients as healthy can have serious consequences. Hence, recall becomes a critical metric, representing the model's ability to correctly identify patients with the condition. Both the hard voting and soft voting models demonstrated recall values of 91%, while stacked generalization achieved a comparable recall rate of 90.9%. Given the proximity of these metrics across the evaluated ensemble models, hard voting might be considered a preferable option. This is attributed to the fact that, unlike soft voting and stacked generalization, hard voting solely relies on the class output of the base learners, leading to reduced computational demands.
In comparing our three ensemble methods—soft voting, hard voting, and stacked generalization—with current state-of-the-art studies, it is evident that our ensemble approach enhances performance, surpassing previous research in various metrics. This improvement aligns with the anticipated benefits of ensemble methods, which harness the accuracy and diversity of individual models to create a more formidable classifier. In terms of accuracy and recall, Rahman and Dola's study, utilizing a single DenseNet model, showed notable results. However, our stacked generalization framework excelled in precision, benefiting from the incorporation of multi-model fusion. Furthermore, all our ensemble techniques outdid the single-model application of DenseNet in precision, a vital metric for accurate DR stage determination. Zhang et al. [25] achieved a higher recall score (95.90%) but trailed in accuracy and precision. Importantly, their attention network underperformed in the 'No DR' classification compared to our ensemble techniques. Similarly, Sikder et al. [29] reported higher precision (94.34%) but lower accuracy and recall. In the context of healthcare, where detecting the presence of DR is crucial, recall emerges as a critical metric, underscoring the effectiveness of our proposed ensemble methods. Nahiduzzaman et al.'s [34] results demonstrated better accuracy and precision but a reduced recall (95.00%). Hayati et al. [19] reported a higher accuracy value (97.83%) but did not provide precision or recall metrics, which limits a comprehensive comparison. For a detailed evaluation, a comparative analysis of these studies is presented in Table 3, illustrating the efficacy of our ensemble approaches in the context of DR classification.
Table 3. Performance comparison of proposed framework and present studies
|
Dataset |
Paper |
Methodology |
Accur. % |
Precision % |
Recall % |
|
APTOS2019(3662imagesin5categories) |
Rahman and Dola [11] |
DenseNet169 Transfer Learning |
96.54 |
90.79 |
96.23 |
|
Sugeno et al. [15] |
EfficientNet-B3 |
84.00 |
- |
- |
|
|
Sheikh and Qidwai [10] |
DenseNet121 |
90.5 |
87.00 |
90.00 |
|
|
Playout et al. [33] |
Optic-Net71 |
92.59 |
93.22 |
91.96 |
|
|
Nahiduzzaman et al. [34] |
Extreme Learning Machine |
97.27 |
96.00 |
95.00 |
|
|
Bodapati et al. [30] |
Multi-Model Fusion on Pre-trained VGG16 and Inception Models |
82.54 |
82.00 |
83.00 |
|
|
Gangwar and Ravi [16] |
Pre-trained Inception-ResNet-v2 Model Customized by Adding Convolutional Layers |
82.18 |
- |
- |
|
|
Hayati et al. [19] |
EfficientNetB4 |
97.83 |
- |
- |
|
|
Lu et al. [12] |
Transfer Learning-based Lightweight Convolutional Neural Network |
96.66 |
97.00 |
96.85 |
|
|
Zhang et al. [25] |
Multi-Point Attention-based Semi-supervised Learning Approach |
90.30 |
86.40 |
95.90 |
|
|
Yue et al. [32] |
Attention-Driven Cascaded Network |
83.40 |
69.66 |
67.70 |
|
|
Islam et al. [17] |
Supervised Contrastive Learning Using Margin Hyperparameter Tuning for Optimization |
84.36 |
70.51 |
73.84 |
|
|
Ingle and Ambad [18] |
Pretrained Resnet50 Model using FastAI Model Generation Approach |
95.00 |
- |
- |
|
|
Canayaz [24] |
Feature Extraction Using EfficientNetB0 and DenseNet121 Classification with Traditional Models |
95.85 |
95.85 |
95.85 |
|
|
Bodapati et al. [21] |
Analyzing Feature Maps of Pre-trained VGG16 Model |
84.31 |
- |
- |
|
|
Shaik and Cherukuri [22] |
Hinge Attention Network |
85.54 |
85.91 |
85.54 |
|
|
Shaik and Cherukuri [23] |
Training a Neural SVM Using the Lesion-Specific Features that are Extracted by Using Xception Architecture |
84.31 |
75.86 |
66.16 |
|
|
Sikder et al. [29] |
Training a Tuned XGBoost Model Using GLCM and Histogram Features |
94.20 |
94.34 |
92.68 |
|
|
Sikder et al. [28] |
Using Histogram Features of Retinal Images on an Ensemble of Decision Trees |
91.07 |
90.40 |
89.54 |
|
|
Proposed Framework |
Hard Voting Ensemble |
94.84 |
92.01 |
90.87 |
|
|
Proposed Framework |
Soft Voting Ensemble |
94.84 |
91.07 |
91.10 |
|
|
Proposed Framework |
Stacked Generalization Ensemble |
95.55 |
90.91 |
93.64 |
This research focused on developing ensembles of deep learning models, employing hard voting, soft voting, and stacked generalization techniques, to classify the severity levels of DR. The APTOS 2019 dataset, encompassing four severity levels of the condition and a healthy state, was utilized for experimentation.
Due to the varied conditions under which retinal images were collected, a range of image preprocessing methods were applied. These included the removal of non-informative backgrounds, application of blurring, resizing, and data augmentation. Hyperparameter tuning was conducted to optimize the training of the base models, exploring different configurations of neurons, learning rates, dropout rates, activation functions, and optimization algorithms. Techniques such as early stopping and learning rate scheduling were also employed.
Models based on the VGG architecture, known for their simplicity but associated with high parameter counts, were contrasted with the more recent EfficientNet series, designed for enhanced performance through efficient network scaling. Two versions of VGG and three variations of EfficientNet were selected, aiming to investigate the impact of model complexity, parameter count, and computational efficiency on the classification of DR. The base models for the ensemble approaches included VGG16, VGG19, EfficientNetB5, EfficientNetB7, and EfficientNetV2S.
The results revealed that ensembles outperformed individual models in precision, recall, accuracy, and F1 scores. The stacked generalization method achieved the highest accuracy at 95.55%, while both hard voting and soft voting models attained an accuracy of 94.84%. Compared to prior state-of-the-art research, the proposed ensemble methods exhibited superior performance across all metrics. This signifies a significant contribution to the existing literature by providing more accurate results.
A limitation of this study is the increased computational demand associated with constructing ensemble models, necessitating the training of multiple models and the amalgamation of their outputs. Despite this, an application for predicting the severity of DR is planned, utilizing pre-trained networks for image testing to reduce processing times. This application could serve as a valuable diagnostic tool, offering improved accuracy over many existing methods. Future research will explore the utilization of diverse networks such as NasNet, DenseNet, ResNet, and lighter networks like AlexNet and ShuffleNet within the stacked generalization ensemble framework to potentially enhance performance and reduce computational costs. The development of this application will facilitate practical and swift analyses of fundus images obtained from eye screening tests, significantly improving the accuracy and reliability of clinical results.
|
1D |
one dimensional |
|
Acc. |
accuracy |
|
AdaBoost |
adaptive boosting |
|
APTOS |
Asia Pacific Tele-Ophthalmology Society |
|
CNN |
convolutional neural network |
|
CPU |
central processing unit |
|
DenseNet |
deterministic networking |
|
DetNet |
dense convolutional network |
|
DR |
diabetic retinopathy |
|
EfficientNet |
efficient convolutional neural network |
|
FCM |
fuzzy c-means clustering |
|
GB |
gigabyte |
|
GCN |
graph convolutional network |
|
GLCM |
grey level cooccurrence matrix |
|
GPU |
graphics processing unit |
|
IDRiD |
Indian Diabetic Retinopathy Image Dataset |
|
JPEG |
Joint Photographic Experts Group |
|
M |
million |
|
Optic-Net |
optical network |
|
PNG |
portable network graphics |
|
Prec. |
precision |
|
Prolif. |
proliferative |
|
RAM |
random access memory |
|
Rec. |
recall |
|
ResNet |
residual network |
|
RGB |
red green blue |
|
SVM |
support vector machine |
|
VGG |
Visual Geometry Group |
|
Xception |
extreme inception |
|
XGBoost |
extreme gradient boosting |
|
YPbPr |
analog video signal carried in cable |
[1] Ogurtsova, K., Fernandes, J.R., Huang, Y., Linnenkamp, U., Guariguta, L., Cho, N.H., Cavan, D., Shaw, J.E., Makaroff, L.E. (2009). EyePACS: An adaptable telemedicine system for diabetic retinopathy screening. Diabetes Research and Clinical Practice, 3(3): 509-516. https://doi.org/10.1177/193229680900300315
[2] Subudhi, A., Pattnaik, S., Sabut, S. (2016). Blood vessel extraction of diabetic retinopathy using optimized enhanced images and matched filter. Journal of Medical Imaging, 3(4): 44003. https://doi.org/10.1117/1.JMI.3.4.044003
[3] Ong, G.L., Ripley, L.G., Newsom, R.S., Cooper, M., Casswell, A.G. (2004). Screening for sight-threatening diabetic retinopathy: Comparison of fundus photography with automated color contrast threshold test. American Journal of Ophthalmology, 137(3): 445-452. https://doi.org/10.1016/j.ajo.2003.10.021
[4] Saranya, P., Prabakaran, S. (2020). Automatic detection of non‑proliferative diabetic retinopathy in retinal fundus images using convolution neural network. Journal of Ambient Intelligence and Humanized Computing. https://doi.org/10.1007/s12652-020-02518-6
[5] Nicholas, J.A., Chan, H.W.H., Baker, M.A.B. (2017). Deep into the brain: Artificial intelligence in stroke imaging. Journal of Stroke, 19(3): 277-285. https://doi.org/10.5853/jos.2017.02054
[6] Kaggle. APTOS 2019 Blindness Detection. https://www.kaggle.com/competitions/aptos2019-blindness-detection/data/, accessed on May. 28, 2023.
[7] Cuadros, J., Bresnick, G. (2009). EyePACS: An adaptable telemedicine system for diabetic retinopathy screening. Diabetes Research and Clinical Practice, 3(3): 509-516. https://doi.org/10.1177/193229680900300315
[8] Porwal, P., Pachade, S., Kokare, M., Deshmukh, G., Son, J., Bae, W., Liu, L., Wang, J., Liu, X., Gao, L., Wu, T., Xiao, J., Wang, B., Wang, Y., Danala, G., He, L., Choi, Y.H., Lee, Y.C., Jung, S., Li, Z., Sui, X., Wu, J., Li, X., Zhou, T., Toth, J., Baran, A., Kori, A., Chennamsetty, S.S., Safwan, M., Alex, V., Lyu, X., Cheng, L., Chu, Q., Li, P., Ji, X., Zhang, S., Shen, Y., Dai, L., Saha, O., Sathish, R., Melo, T., Araujo, T., Harangi, B., Sheng, B., Fang, R., Sheet, D., Hajdu, A., Zheng, Y., Mendonca, A.M., Zhang, S., Campilho, A., Zheng, B., Shen, D., Giancardo, L., Quellec, G., Meriaudeau, F. (2020). IDRiD: Diabetic retinopathy – Segmentation and grading challenge. Medical Image Analysis, 59: 101561. https://doi.org/10.1016/j.media.2019.101561
[9] Decenciere, E., Zhang, X., Cazuguel, G., Lay, B., Cochener, B., Trone, C., Gain, P., Ordonez, R., Massin, P., Erginay, A., Charton, B., Klein, J. (2014). Feedback on a publicly distributed image database: The Messidor database. Image Analysis and Stereology, 33(3): 231-234. https://doi.org/10.5566/ias.1155
[10] Sheikh, S., Qidwai, U. (2021). Smartphone-based diabetic retinopathy severity classification using convolution neural networks. Intelligent Systems and Applications, 1252: 469-481. https://doi.org/10.1007/978-3-030-55190-2_35
[11] Rahman, M.T., Dola, A. (2021). Automated grading of diabetic retinopathy using DenseNet-169 architecture. 2021 5th International Conference on Electrical Information and Communication Technology (EICT), Khulna, Bangladesh, pp. 1-4. https://doi.org/10.1109/EICT54103.2021.9733431
[12] Lu, Z., Miao, J., Dong, J., Zhu, S., Wang, X., Feng, J. (2023). Automatic classification of retinal diseases with transfer learning-based lightweight convolutional neural network. Biomedical Signal Processing and Control, 81: 104365. https://doi.org/10.1016/j.bspc.2022.104365
[13] Yadav, Y., Chand, S., Sahoo, R.C., Kumar, S. (2022). Comparative analysis of detection and classification of diabetic retinopathy by using transfer learning of CNN based models, Journal of Intelligent & Fuzzy Systems, 43(1): 985-999. https://doi.org/10.3233/JIFS-212771
[14] Samanta, A., Saha, A., Satapathy, S.C., Fernandes, S.L., Zhang, Y, (2020). Automated detection of diabetic retinopathy using convolutional neural networks on a small dataset. Pattern Recognition Letters, 135: 293-298. https://doi.org/10.1016/j.patrec.2020.04.026
[15] Sugeno, A., Ishikawa, Y., Ohshima, T., Muramatsu, R. (2021). Simple methods for the lesion detection and severity grading of diabetic retinopathy by image processing and transfer learning. Computers in Biology and Medicine, 137: 104795. https://doi.org/10.1016/j.compbiomed.2021.104795
[16] Gangwar, A.K., Ravi, V. (2004). Diabetic retinopathy detection using transfer learning and deep learning. Advances in Intelligent Systems and Computing, 1176: 679-689. https://doi.org/10.1007/978-981-15-5788-0_64
[17] Islam, M.R., Abdulrazak, L.F., Nahiduzzaman, M., Goni, M.O.F., Anower, M.S., Ahsan, M., Haider, J., Kowalski, M. (2022). Applying supervised contrastive learning for the detection of diabetic retinopathy and its severity levels from fundus images. Computers in Biology and Medicine, 146: 105602. https://doi.org/10.1016/j.compbiomed.2022.105602
[18] Ingle, V., Ambad, P. (2023). Diabetic retinopathy grading by a source-free transfer learning approach. Biomedical Signal Processing and Control, 72(3): 1765-1773. https://doi.org/10.1016/j.bspc.2021.103423
[19] Hayati, M., Muchtar, K., Roslidar, Maulina, N., Syamsuddin, I., Elwirehardja, G.N., Pardamean, M. (2023). Impact of CLAHE-based image enhancement for diabetic retinopathy classification through deep learning. Procedia Computer Science, 216: 57-66. https://doi.org/10.1016/j.procs.2022.12.111
[20] Aswini, A.A., Sivarani, T.S. (2023). Modified capsule network for diabetic retinopathy detection and classification using fundus images. Journal of Intelligent & Fuzzy Systems, 44(4): 5521-5542. https://doi.org/10.3233/JIFS-221112
[21] Bodapati, J.D., Shaik, N.S., Naralasetti, V. (2021). Deep convolution feature aggregation: An application to diabetic retinopathy severity level prediction. Signal, Image and Video Processing, 15: 923-930. https://doi.org/10.1007/s11760-020-01816-y
[22] Shaik, N.S., Cherukuri, T.K. (2021). Hinge attention network: A joint model for diabetic retinopathy severity grading. Applied Intelligence, 52(13): 15105-15121. https://doi.org/10.1007/s10489-021-03043-5
[23] Shaik, N.S., Cherukuri, T.K. (2021). Lesion-aware attention with neural support vector machine for retinopathy diagnosis. Machine Vision and Applications, 32: 126. https://doi.org/10.1007/s00138-021-01253-y
[24] Canayaz, M. (2022). Classification of diabetic retinopathy with feature selection over deep features using nature-inspired wrapper methods. Applied Soft Computing, 128: 109462. https://doi.org/10.1016/j.asoc.2022.109462
[25] Zhang, C., Chen, P., Lei, T. (2023). Multi-point attention-based semi-supervised learning for diabetic retinopathy classification. Biomedical Signal Processing and Control, 80(2): 104412. https://doi.org/10.1016/j.bspc.2022.104412
[26] Cahoon, S., Shaban, M., Switala, A., Mahmoud, A., El-Baz, A. (2022). Diabetic retinopathy screening using a two-stage deep convolutional neural network trained on an extremely un-balanced dataset. SoutheastCon 2022, Mobile, AL, USA, pp. 250-254. https://doi.org/10.1109/SoutheastCon48659.2022.9764079
[27] Karki, S., Kulkarni, P. (2021). Diabetic retinopathy classification using a combination of EfficientNets. 2021 International Conference on Emerging Smart Computing and Informatics (ESCI), pp:68-72. https://doi.org/10.1109/ESCI50559.2021.9397035
[28] Sikder, N., Chowdhury, M.S., Arif, A.S.M., Nahid, A. (2019). Early blindness detection based on retinal images using ensemble learning. 22nd International Conference on Computer and Information Technology (ICCIT), Dhaka, Bangladesh, pp. 1-6. https://doi.org/10.1109/ICCIT48885.2019.9038439
[29] Sikder, N., Masud, M., Bairagi, A.K., Arif, A.S.M., Nahid, A.A., Alhumyani, H.A. (2021). Severity classification of diabetic retinopathy using an ensemble learning algorithm through analyzing retinal images. Symmetry, 13(4): 670. https://doi.org/10.3390/sym13040670
[30] Bodapati, J.D., Shaik, N.S., Naralasetti, V. (2021). Composite deep neural network with gated-attention mechanism for diabetic retinopathy severity classification. Journal of Ambient Intelligence and Humanized Computing, 12: 9825-9839. https://doi.org/10.1007/s12652-020-02727-z
[31] Kaushik, H., Singh, D., Kaur, M., Alshazly, H., Zaguia, A., Hamam, H. (2021). Diabetic retinopathy diagnosis from fundus images using stacked generalization of deep models. IEEE Access, 9: 108276-108292. https://doi.org/10.1109/ACCESS.2021.3101142
[32] Yue, G., Li, Y., Zhou, T., Zhou, X., Liu, Y., Wang, T. (2023). Attention-driven cascaded network for diabetic retinopathy grading from fundus images. Biomedical Signal Processing and Control, 80(2): 104370. https://doi.org/10.1016/j.bspc.2022.104370
[33] Playout, C., Duval, R., Boucher, M.C., Cheriet, F. (2022). Focused attention in transformers for interpretable classification of retinal images. Medical Image Analysis, 82: 102608. https://doi.org/10.1016/j.media.2022.102608
[34] Nahiduzzaman, Islam, R., Goni, O.F., Anower, S., Ahsan, M., Haider, J., Kowalski, M. (2023). Diabetic retinopathy identification using parallel convolutional neural network based feature extractor and ELM classifier. Expert Systems with Applications, 217: 119557. https://doi.org/10.1016/j.eswa.2023.119557
[35] Bhuvaneswari, R., Vaidyanathan, G. (2021). Classification and grading of diabetic retinopathy images using mixture of ensemble classifiers. Journal of Intelligent, 41(6): 7407-7419. https://doi.org/10.3233/JIFS-211364
[36] Cinarer, G., Kilic, K. (2021). Diabetic retinopathy detection with deep transfer learning methods. Intelligent and Fuzzy Techniques for Emerging Conditions and Digital Transformation, 308: 147-154. https://doi.org/10.1007/978-3-030-85577-2_17
[37] Dwivedi, S.A., Attry, A. (2021). Juxtaposing deep learning models efficacy for ocular disorder detection of diabetic retinopathy for ophthalmoscopy. 2021 6th International Conference on Signal Processing, Computing and Control (ISPCC), Solan, India, pp. 352-357. https://doi.org/10.1109/ISPCC53510.2021.9609368
[38] Sanjana, S., Nazmus, S.S., Farzana, M. (2021). Automated diabetic retinopathy detection using transfer learning models. 2021 5th International Conference on Electrical Engineering and Information Communication Technology (ICEEICT), Dhaka, Bangladesh, pp. 1-6. https://doi.org/10.1109/ICEEICT53905.2021.9667793
[39] Padmanayana, Anoop, B.K. (2022). Binary classification of DR-diabetic retinopathy using CNN with fundus colour images. Materials Today: Proceedings, 58(1): 212-216. https://doi.org/10.1016/j.matpr.2022.01.466
[40] Zhang, W.J., Yang, G., Lin, Y., Ji, C., Gupta, M.M. (2018). On definition of deep learning. 2018 World Automation Congress (WAC), 19(3): 1-5. https://doi.org/10.23919/WAC.2018.8430387
[41] Adriman, R., Muchtar, K., Maulina, N. (2021). Performance evaluation of binary classification of diabetic retinopathy through deep learning techniques using texture feature. Procedia Computer Science, 179: 88-94. https://doi.org/10.1016/j.procs.2020.12.012
[42] Li, Y., Song, Z., Kang, S., Jung, S., Kang, W. (2021). Semi-supervised auto-encoder graph network for diabetic retinopathy grading. IEEE Access, 9: 140759-140767. https://doi.org/10.1109/ACCESS.2021.3119434
[43] Awad, M., Khanna, R. (2015). Machine Learning. In: Efficient Learning Machines. Apress, Berkeley, CA. https://doi.org/10.1007/978-1-4302-5990-9_1
[44] Zhang, W.J., Yang, G., Lin, Y., Ji, C., Gupta, M.M. (2018). On definition of deep learning. 2018 World Automation Congress (WAC), 19(3): 1-5. https://doi.org/10.23919/WAC.2018.8430387
[45] Yadav, S.A., Shukla, S. (2016). Analysis of K-fold cross-validation over hold-out validation on colossal datasets for quality classification. 2016 IEEE 6th International Conference on Advanced Computing (IACC), Bhimavaram, India, pp. 78-83. https://doi.org/10.1109/IACC.2016.25
[46] Ilhan, H.O., Serbes, G., Aydin, N. (2022). Decision and feature level fusion of deep features extracted from public COVID-19 data-sets. Applied Intelligence, 52: 8551-8571. https://doi.org/10.1007/s10489-021-02945-8
[47] Wolpert, D.H. (1992). Stacked generalization. Neural Networks: The Official Journal of the International Neural Network Society, 5(2): 241-259. https://doi.org/10.1016/S0893-6080(05)80023-1
[48] Ting, K.M., Witten, I.H. (1999). Issues in stacked generalization. Journal of Artificial Intelligence Research, 10: 271-289. https://doi.org/10.48550/arXiv.1105.5466
[49] Tan, M., Le, Q.V. (2021). EfficientNetV2: Smaller models and faster training. International Conference on Machine Learning, pp. 10096-10106. https://doi.org/10.48550/arXiv.2104.00298