Huizhen Wang![]()
© 2023 IIETA. This article is published by IIETA and is licensed under the CC BY 4.0 license (http://creativecommons.org/licenses/by/4.0/).
OPEN ACCESS
The burgeoning global logistics industry has necessitated the development of intelligent logistics systems as a crucial means to augment efficiency and curtail costs. Paramount to bolstering logistics system performance is the optimization of cargo capacity in logistics vehicles, intrinsically linked to diminishing logistics expenses and augmenting transportation efficiency. Conventional approaches for gauging vehicle cargo capacity, predominantly reliant on manual measurements, have encountered challenges of inefficiency and lack of precision. In response to these impediments, this study advocates an innovative image processing-based methodology for optimizing vehicle cargo capacity. The research initially concentrates on refining stereo matching algorithms, aiming to elevate measurement accuracy and stability amidst complex environmental conditions. This enhancement proves particularly efficacious in measuring cargos with irregular contours and diverse reflective properties, facilitating more precise volume estimations. Additionally, the study introduces a novel methodology for volume calculation, predicated on the statistical analysis of pixel heights in images. This technique, utilizing meticulous camera calibration coupled with the extraction of pixel height data, enables the swift and accurate determination of cargo volume in vehicles, thereby markedly improving measurement efficiency and precision. The progress delineated herein not only paves a novel technological path for optimizing cargo capacity in logistics vehicles but also advances the application of image processing technology within the realm of intelligent logistics. The advancements hold substantial market potential and research significance, presenting a promising avenue for future explorations in this field.
intelligent logistics, cargo capacity optimization, image processing, stereo matching algorithms, volume measurement
The burgeoning e-commerce sector and the rise of online shopping platforms have precipitated unprecedented challenges and opportunities within the logistics industry. Central to the efficiency enhancement and operational cost reduction in this sector is intelligent logistics, emerging as a pivotal technology [1-3]. A fundamental aspect underpinning the performance improvement of logistics systems is the optimization of cargo capacity in logistics vehicles, a factor directly influencing logistics expenses and transportation efficiency. Conventional approaches for determining vehicle cargo capacity have traditionally relied on manual measurements, which have been beset by inefficiencies and a lack of precision and reliability [4-7]. Consequently, the demand for an automated, high-precision system to measure cargo capacity, leveraging image processing, has emerged as an urgent necessity in the industry.
The expeditious and precise quantification of cargo volume, coupled with the optimization of cargo capacity, forms a critical research trajectory in the domain of intelligent logistics [8-10]. In this realm, image processing technology holds substantial promise. It facilitates the automatic quantification of cargo volume through the analysis of images of goods within logistics vehicles, thereby streamlining loading strategies [11-13]. The advancement in research related to this field not only contributes to the enhancement of intelligent logistics systems but also paves the way for breakthroughs in the practical applications of computer vision and image processing technologies [14, 15].
Nevertheless, existing research encounters certain limitations in the volume measurement of cargo in logistics vehicles. Stereo matching algorithms, for example, often lack the requisite precision in complex scenarios, particularly when dealing with objects that are obstructed or of varied shapes and materials [16-19]. Moreover, the real-time performance and robustness of traditional algorithms necessitate further refinement to align with the rigorous demands of industrial applications [20, 21].
This paper presents a system designed to optimize the cargo capacity of intelligent logistics vehicles through the application of image processing, addressing these challenges. Key improvements have been made to stereo matching algorithms, enhancing the precision and stability of measurements in complex environments, especially for cargos characterized by irregular shapes and a range of reflective properties. This facilitates more accurate estimations of cargo volume. Additionally, the paper introduces an innovative method for volume calculation based on the statistical analysis of image pixel heights, incorporating accurate camera calibration and the extraction of pixel height information. This approach enables the rapid and precise computation of cargo volume in vehicles. The findings and methodologies delineated in this paper not only raise the technological bar for optimizing cargo capacity in logistics vehicles but also offer efficient solutions for intelligent logistics systems, thereby holding significant theoretical and practical application value.
In this research, stereo matching algorithms have been employed for the measurement of cargo volume in logistics vehicles. The selection of these algorithms is predicated on their ability to reconstruct three-dimensional models by analyzing disparity information from the same object captured in multiple images taken from varied angles. This approach is instrumental for the automated acquisition of accurate volume information of cargo, avoiding direct contact and enabling the precise measurement of dimensions, even for cargos of irregular shapes. In the domain of logistics, the implications of this approach are manifold, leading to enhanced spatial planning and optimization of cargo capacity. This advancement results in a reduction of operational costs and an elevation in transportation efficiency.
In scenarios where image processing is utilized for cargo volume measurement in logistics vehicles, traditional semi-global stereo matching algorithms, which rely on Census cost computation, often exhibit critical shortcomings. These limitations include a marked dependence on central pixels, diminished matching precision in areas with similar or weak textures, and reduced accuracy in regions of depth discontinuity. The stability and robustness of the traditional Census transformation, heavily dependent on central pixels, are susceptible to degradation when central pixels are affected by noise interference or significant variations in illumination. Furthermore, the Census transformation is prone to producing ambiguous matches in areas with similar or weak textures, owing to minimal feature variation, resulting in an insufficient matching cost to accurately differentiate true matching points. The algorithm's approach to depth discontinuities, often biased towards spatial continuity, can obscure actual depth boundaries, thereby affecting the precision of volume measurements, particularly in complex logistics scenarios.
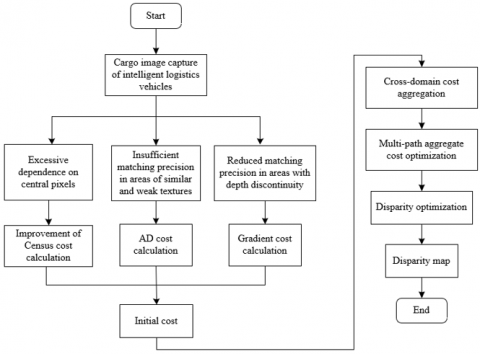
In this research, the semi-global stereo matching algorithm, traditionally based on Census cost computation, has been refined to address the challenges posed by various disturbances prevalent in logistics environments, such as uneven lighting and reflections on vehicle surfaces, as illustrated in Figure 1. These factors have been observed to affect the grayscale value of central pixels, leading to inaccuracies in the traditional Census transformation, which predominantly relies on these pixels. The enhancement of the algorithm is achieved through the integration of neighborhood pixel constraints and threshold judgment. This advancement enables the algorithm to effectively identify and mitigate disturbances impacting central pixels, thereby maintaining the non-linear characteristics of the Census transformation while diminishing the influence of noise on measurement outcomes. Consequently, the refined algorithm significantly improves the accuracy of depth estimation in stereo matching, enhancing the reliability and precision of cargo volume measurements in complex logistics settings. An illustrative example of the transformation results, post-improvement of the Census cost computation, is displayed in Figure 2. The process involves defining the reference grayscale value for the non-parametric transformation, represented by Ud(a,b), averaging the grayscale values of neighboring pixels external to the center pixel, denoted by U-(a,b), specifying the grayscale value of the center pixel itself as U(a,b), and setting the judgment threshold, labeled as S. The formula for establishing the reference grayscale value is articulated as follows:
$U_d(a, b)=\left\{\begin{array}{l}U(a, b),|\bar{U}(a, b)-U(a, b)| \leq S \\ \bar{U}(a, b),|\bar{U}(a, b)-U(a, b)|>S\end{array}\right.$ (1)
Figure 1. Flowchart of the improved semi-global stereo matching algorithm based on Census cost calculation
Figure 2. Example of the transformation results after improving the Census cost computation
In this segment of the methodology, it is identified that the Census algorithm, which hinges on the arrangement of pixel intensities in localized neighborhood windows, and the Absolute Difference (AD) algorithm, grounded solely in pixel grayscale values, are both vulnerable to inaccuracies in regions characterized by repetitive textures or along the edges of images. The reliance on Hamming distance as the primary metric for matching cost, as depicted in Figure 3, can result in scenarios where the calculated Hamming distance is nil despite the presence of actual differences in grayscale values. Such challenges are notably pronounced in logistics environments due to the varied surface textures of goods, which can complicate the algorithmic matching process. Figure 3 offers a schematic representation of the Hamming distance computation.
Enhancements to the traditional semi-global stereo matching algorithm, utilized in image processing for calculating cargo volume in logistics vehicles, have been undertaken to improve its performance in areas with weak textures and along edges. These improvements involve the integration of gradient information, recognized for its sensitivity to image edges and its robustness against variations in noise and lighting. Such integration enables the refined algorithm to more precisely identify and delineate edge features within images. Consequently, this leads to a marked increase in the accuracy of matching, particularly in intricate logistics scenarios characterized by densely stacked goods, intricate texture details, or less-than-ideal lighting conditions.
In the context of this study, it is posited that the grayscale values of the red, green and blue (RGB) channels for a given pixel o in the image are denoted by Um(o). Furthermore, the grayscale value of the corresponding point at a specific disparity f for the same pixel o is indicated by Ue(o,f). The absolute difference in the grayscale values of these two pixels is represented by ZXF(o,f), forming the basis of the AD calculation, as outlined in the following equation:
$Z_{x f}(o, f)=\frac{1}{3} \sum_{u=E, H, Y}\left|U_u^m(o)-U_u^e(o, f)\right|$ (2)
Moreover, the gradient cost at a given disparity f is represented by ZH. The formulation for this gradient-based cost calculation is provided:
$Z_H=\sum\left(\begin{array}{l}\left\|\nabla U_{a m}(o)-\nabla U_{a e}(o, f)\right\| +\left\|\nabla U_{b m}(o)-\nabla U_{a e}(o, f)\right\|\end{array}\right)$ (3)
The process for the initial cost calculation, incorporating these elements, is further detailed:
$\begin{aligned} & Z(o, f)=\vartheta\left(Z_{C E}(o, f), \eta_z\right)+\vartheta\left(Z_{X F}(o, f), \eta_{X F}\right)+\vartheta\left(Z_H(o, f), \eta_H\right)\end{aligned}$ (4)
To ensure uniformity across the various cost calculation methodologies, a normalization process is employed. In this context, the matching cost value of the algorithm is symbolized by z, and the weight parameter of the algorithm's cost is represented by η. The normalization formula is as follows:
$\vartheta(z, \eta)=1-\exp \left(-\frac{z}{\eta}\right)$ (5)
Subsequently, the formula for the normalized matching cost calculation, integrating these factors, is presented:
$\begin{aligned} & X=3-\exp \left(-\frac{Z_{C E}(o, f)}{\eta_z}\right)-\exp \left(-\frac{Z_{X F}(o, f)}{\eta_{X F}}\right)-\exp \left(-\frac{Z_H(o, f)}{\eta_H}\right)\end{aligned}$ (6)
Figure 3. Schematic of hamming distance calculation
The algorithmic improvement proposed in this study for the precise measurement of cargo volume in logistics vehicles entails a holistic optimization of the original image processing workflow. Initially, grayscale processing is applied to the images to eliminate disturbances caused by color information. Subsequently, filtering techniques are employed to remove random noise, and contrast enhancement is performed to ensure the clarity of image details. Stereo correction is utilized to rectify distortions and inconsistencies in epipolar constraints during the camera imaging process, guaranteeing geometric consistency in the image pairs. The processed image pairs are then subjected to an enhanced suite of algorithms: the refined Census algorithm, the AD algorithm, and the gradient transformation method. Each of these algorithms is tailored to optimize specific image characteristics, thereby enriching the utilization of texture information, grayscale variations, and edge gradients. The culmination of this process involves normalizing the cost values derived from these algorithms to mitigate disparities arising from different scales. These normalized values are then aggregated to yield a comprehensive matching cost value that encapsulates diverse feature information. This cost aggregation not only augments the algorithm's adaptability to the varied characteristics of logistics goods but also bolsters the precision and robustness of the volume measurement, ensuring reliable cargo volume measurement across various logistics environments and aiding in the optimization of logistics systems' efficiency.
In typical logistics scenarios, the stacking of goods often results in pronounced depth changes in disparity maps. The inadequate handling of these discontinuous edges can lead to substantial errors in volume estimation. Moreover, the surface textures of logistics goods, often characterized by repetition or weakness, present challenges for traditional matching algorithms in discerning true matching points. To address these issues, this study integrates the cross-domain cost aggregation method and the multi-path dynamic programming algorithm into the conventional semi-global stereo matching algorithm based on Census cost computation. These enhancements effectively mitigate the challenges associated with discontinuous disparities and areas of weak or repetitive textures. The application of the cross-domain algorithm for preliminary aggregation correction of initial costs significantly enhances the capability of the semi-global stereo matching algorithm, particularly in locating depth boundaries and improving its performance in regions with discontinuous disparity. This methodological advancement is instrumental in achieving more effective utilization of cost information along distinct paths, while simultaneously maintaining a balance in disparity coherence across these paths. This optimization crucially enhances the matching accuracy of the algorithm, especially in scenarios characterized by repetitive or weak textures, a common challenge in complex logistics environments.
A cross-domain aggregation window, centered around the current pixel, is constructed to aptly capture and delineate vertical and horizontal edge information in images, aligning with common edge structures found in goods within logistics vehicles. This construction aids in enhancing the continuity and accuracy of disparity values at edges. Figure 4 presents an exemplar of the cross-domain aggregation window construction. The color difference between the initial pixel and its surrounding pixels is denoted by Fz, and the pixel distance is denoted by Ft, with the associated calculation formula provided as:
$\begin{aligned} & F_z\left(o_m, o\right)=\underset{u=E, H, Y}{M A X}\left|U_u\left(o_m\right)-U_u(o)\right| \\ & F_t\left(o_m, o\right)=\left|o_m-o\right|\end{aligned}$ (7)
Specific constraints within the cross-domain are established to effectively mitigate noise and mismatches during the cost aggregation process, concurrently enhancing the consistency of disparity among neighboring pixels. These constraints may include limiting the threshold of pixel differences within the neighborhood during aggregation and applying specialized weight treatment for edge pixels within the cross-domain. The detailed constraints are articulated in the following formulation:
$\begin{aligned} & F_z\left(o_m, o\right)<\pi_1 A N D F_z\left(o_m, o_m+(1,0)\right)<\pi_1 \\ & F_t\left(o_m, o\right)=\left|o_m-o\right|<M_1 \\ & F_z\left(o_m, o\right)<\pi_2, I F M_2<F_s\left(o_m, o\right)<M_1\end{aligned}$ (8)
Figure 4. Example of constructing a cross-domain aggregation window
Subsequently, further cost aggregation is conducted within each pixel's cross-domain. This phase incorporates the spatial information surrounding each pixel, aggregating cost data from neighboring pixels to augment matching accuracy and robustness. The aggregated cost value for pixel o, denoted as R(F), is derived by considering the number of pixels included in the aggregation window, represented by ||If(o)||, and the initial cost value of neighboring pixels, denoted by Z(t). The formula for the aggregated cost is as follows:
$R(F)=\frac{1}{\left\|I_f(o)\right\|} \sum_{t \in I_f(o)} Z(t)$ (9)
The optimized aggregated cost formula, a crucial part of the process, is delineated below:
$Z_e(o, f)=Z_1(o, f)+M I N\left\{\begin{array}{l}Z_e(o-e, f) \\ Z_e(o-e, f-1)+o_1 \\ Z_e(o-e, f+1)+o_1 \\ \underset{j}{M I N} Z_e(o-e, j)+o_2\end{array}\right\}-\underset{j}{M I N} Z_e(o-e, j)$ (10)
The methodology involves cost aggregation in four distinct directions: upward, downward, left, and right. In each direction, the aggregation process takes into account the disparity change trends, employing dynamic programming to optimize the aggregated cost along each path. This approach ensures comprehensive cost optimization in every direction. The final stage involves computing the average of the optimized costs aggregated from all four directions. This average serves as the final matching cost for the current pixel, enabling the synthesis of information from various directions and balancing their respective influences. This meticulous process is designed to yield a disparity estimation that is both more precise and stable. The calculation formula for this comprehensive process is provided as:
$Z_2(o, f)=\frac{1}{4} \sum_e Z_e(o, f)$ (11)
This study introduces an image pixel-based method for calculating cargo volume in logistics vehicles, grounded in the principles of stereoscopic imaging geometry. Initially, the method employs a binocular stereo vision system to capture the three-dimensional profile of the cargo pile within the logistics vehicle. The process involves registering and matching images from left and right cameras to determine the disparity between corresponding pixels. This disparity, combined with the baseline distance and focal length of the cameras, undergoes a series of geometric transformations, resulting in the computation of each pixel's depth information relative to the camera. Figure 5 illustrates the relative positioning of the camera and the calibration board, highlighting this crucial step in the process. Given the diverse surface heights characteristic of irregular cargo piles, this approach facilitates the precise reconstruction of the cargo pile's surface height model. Furthermore, by examining the top view of the cargo pile and identifying its contour boundaries, the method integrates this information with the height data to compute the total volume of the cargo pile. This methodology is particularly effective for irregularly shaped goods, as it does not rely on the regularity of cargo shape, thereby providing accurate volumetric data essential for optimizing cargo capacity in logistics vehicles. Assuming uniform distribution of points in the depth map of the cargo pile, the method denotes the surface area corresponding to a pixel by Δt and the height of the small cubic volume corresponding to the pixel from the pile's surface by gu. The total number of pixels in the target area is represented by V. The formula for the specific calculation of the triple integral, integral to this method, is delineated as follows:
$N=\iiint d a d b d g \approx \sum_0^V \Delta t \cdot g_u$ (12)
The methodology employed in this study addresses the challenges of accurately estimating the volume of cargo piles in logistics vehicles. A direct estimation based solely on the average height of sampling points risks overlooking the intricate geometric characteristics and uneven height distribution of cargo piles, potentially leading to substantial errors in volume estimation. To circumvent these issues, each pixel within the image is assigned an exact spatial position, specifically its actual height, derived from precise three-dimensional reconstruction technology. This approach, complemented by the incorporation of pixel equivalent values, facilitates a more accurate estimation of the entire pile's volume. This method takes into account the intricate details of each point on the cargo pile's surface within the logistics vehicle. Such meticulous attention to detail significantly mitigates computational errors that might arise due to complex surface geometries or pronounced variations in height. This refinement in methodology thereby substantially contributes to the overarching research goal of optimizing cargo volume measurement in logistics vehicles. The specific steps for implementing this improved method are as follows:
Step 1: Upon acquiring the depth image of the cargo area in a logistics vehicle, the initial step involves transforming this image into depth information. Each pixel's depth value signifies its distance from the camera. The intrinsic parameters of the camera, such as focal length and optical center, along with its extrinsic parameters, encompassing rotation and translation matrices, are utilized to map the two-dimensional pixel coordinates onto a three-dimensional spatial coordinate system. This task, encompassing intricate geometric transformations and matrix operations, ensures precise alignment of each pixel's three-dimensional coordinates with corresponding points on the physical surface of the object. This phase is critical for reconstructing the spatial structure of the vehicle's cargo pile, thereby providing vital three-dimensional data for subsequent volume estimation. Following this, image segmentation techniques are applied to delineate the cargo from the background within the image. This step involves meticulous pixel counting within the designated cargo area, incorporating the distance from the camera to the cargo surface and the camera's field of vision to determine the actual projected area. Accurate identification of the cargo's edges and contours is essential here, as it contributes to the precision of the calculated area, ensuring it closely reflects the actual dimensions. In environments characterized by complex logistics, this process may involve advanced edge detection and pattern recognition algorithms, tailored to accommodate varying types and colors of cargo surfaces. The three-dimensional coordinates of the depth image's upper-left and lower-right vertices are denoted by X(AX,BX,CX) and Y(AY,BY,CY), respectively. The actual plane area represented by the entire image is represented by T. The formula for calculating this area is structured as follows:
$T=\left(A_Y-A_X\right) \times\left(B_X-B_Y\right)$ (13)
Step 2: The ratio of pixels within the cargo area to the total pixels in the image is calculated. This ratio is integral to the volume estimation process. The analysis involves counting pixels within the designated cargo area and comparing this count to the total pixel count of the entire image, thereby deriving the necessary ratio. This ratio effectively represents the proportion of the cargo area within the full image, a crucial factor for subsequent volume calculations. Once the pixel ratio within the cargo area is ascertained, it is combined with the previously calculated projected area. This step entails multiplying the projected area by the pixel ratio to estimate the actual area occupied by the cargo. Such a process ensures that the actual proportion of cargo in the image is accounted for, thereby negating the influence of non-cargo areas on the area computation and providing an accurate base area value for the overall volume calculation. Assuming the ratio of pixels in the cargo pile area to the entire image is denoted by O0, the actual area corresponding to the depth image is represented by T, and the actual area of the cargo pile region is denoted by T0. The formula for deriving T0 involves multiplying O0 with T, and is articulated as follows:
$T_0=T \times o_0$ (14)
Step 3: In the subsequent phase of the methodology, the depth information for each pixel in the cargo pile area of the logistics vehicle is utilized to determine disparity values. Disparity, representing the horizontal displacement difference between corresponding pixels in binocular stereo vision, is indicative of the positional variance of the same object point in the left and right camera images. These disparity values, once computed, enable the calculation of the distance from each pixel to the camera plane. To address issues of noise and discontinuities present in the disparity map, a smoothing and filtering process is applied to the disparity values. Subsequently, pixels are categorized according to the magnitude of their disparity values, with each category corresponding to different depth layers. This categorization facilitates independent volume calculations for various depth layers in the subsequent steps. The number of pixels corresponding to each disparity category, denoted by vu, is divided by the total pixel count R in the image, yielding the ratio Ou, articulated as:
$o_u=\frac{v_u}{R}$ (15)
Step 4: Each disparity category encompasses a collection of pixels within a specific depth range. The pixel count within each category is ascertained and then divided by the total pixel count in the image to obtain the proportion corresponding to each disparity category. This proportion reflects the spatial occupation of the goods at particular depth levels, serving as a fundamental metric for calculating the volume at each depth. In practice, this stage may involve statistical and probability distribution computations to ensure the accuracy and representativeness of disparity categorization. The final step involves estimating the volume at each depth level using the previously calculated ratios and disparity values. Specifically, the proportion corresponding to each disparity category is multiplied by the estimated distance from the pixel to the ground and the base area, determining the volume for that depth level. The aggregate of these individual depth level volumes constitutes the total volume of the cargo pile within the logistics vehicle. Given that volume calculation is independently conducted for each depth level, this method offers enhanced adaptability to the irregular shape of cargo piles, thereby improving overall volume measurement accuracy. The ratio of pixels sharing the same disparity value to the total pixel count in the area is denoted by ou, and the various disparity levels are categorized, represented by L. The calculation formula, which integrates the variables ou and T0, and the vertical distance from each pixel to the ground surface, is formulated as follows:
$N=\sum_{u=0}^L O_u \bullet T_0 \bullet g_u$ (16)
The calculation of the cargo pile's height g1 in the logistics vehicle, assuming the distance from the camera to the pile's surface as G and the depth value corresponding to different disparities as cu, is given by:
$g_u=G-c_u$ (17)
Figure 5. Relative positioning of the camera and calibration board
Figure 6 presents a histogram depicting the distribution of pixel numbers corresponding to different disparity values, namely 50, 100, and 150. The histogram reveals that at a disparity value of 50, a progressive increase in the pixel count is observed, rising from 0.02 to a peak at 0.35, before gradually declining to 0.1. This trend signifies a specific region of the logistics goods, where the number of pixels initially escalates to a maximum as the disparity value increases, implying greater distances from the camera, and subsequently diminishes. The apex of this curve is indicative of the primary volumetric area of the object. In contrast, at a disparity value of 100, the pixel distribution exhibits a similar pattern to that at 50, albeit with a generally higher pixel count, particularly in the median disparity range. This suggests a denser concentration of the object's volume at intermediate distances. At a disparity value of 150, a sharp decrease in pixel numbers is evident, commencing with a lower count, peaking slightly, and then rapidly falling to zero. This pattern suggests a diminished volume of the object at further distances from the camera, or possibly the outer edges of the object residing within this disparity range. The data from Figure 6 are pivotal for the intelligent logistics vehicle cargo optimization system based on image processing, as they furnish essential three-dimensional insights. These insights enable the system to estimate object volume using pixel distribution and disparity information, thereby facilitating more precise optimization of cargo loading.
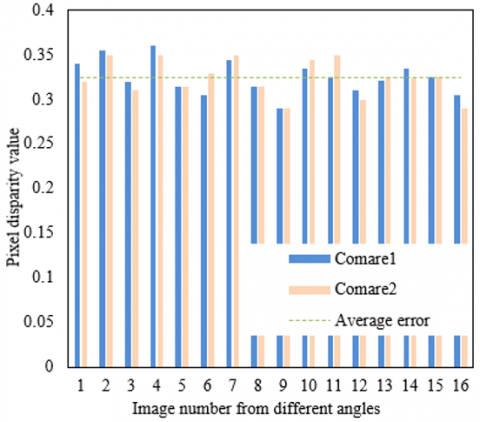
Figure 7 displays two sets of disparity values (Comare1 and Comare2), along with their average errors. These values are derived from images captured at varying angles, and the average error provides a benchmark for the accuracy of disparity calculations. It is observed in the figure that the disparity values for each image pair are closely aligned, signifying consistent outcomes produced by the stereo matching algorithm. The constancy of the average error across different disparity values suggests that a uniform error model is applied throughout the evaluation. The disparity values exhibit minimal fluctuation (ranging from 0.29 to 0.36), indicating that changes in disparity are not extreme. This consistency is indicative of either relatively flat object surfaces or stable conditions in camera positioning and capturing. The inference drawn is that the stereo matching algorithm demonstrates uniform and stable performance across various viewpoints, maintaining coherence in disparity value calculations across different images. The presence of a uniform average error underscores the stability of the algorithm but also signals a consistent level of error across all images, underscoring the need for further optimization to reduce these errors and enhance precision.
Figure 6. Histogram of pixel numbers for different disparity values
Figure 7. Disparity values corresponding to images from different angles
The dataset, encompassing ten measurements of cargo pile volumes in a logistics vehicle at varying heights (8m, 9m, 10m), is meticulously recorded, alongside the relative errors when compared to a reference value (Table 1). The observed fluctuations in the measurement data, discernible at different heights, highlight the influence of several factors on volume measurement in real-world logistics scenarios. These factors include the irregular stacking of goods, lighting conditions, and the precision of imaging equipment. The findings suggest that the volume measurement method for logistics vehicle cargo, employing the enhanced stereo matching algorithm delineated in this study, achieves reasonable accuracy. The relative error, predominantly within an acceptable range, underscores the method's applicability across diverse heights and practical conditions, thereby demonstrating the method's practicality and robustness. To optimize accuracy, further refinement through system calibration, algorithmic adjustments, or environmental controls is advised. Notably, at a height of 10 meters, additional investigation is warranted to pinpoint the root causes of the elevated error rates and to devise appropriate corrective measures.
Table 2 documents the accuracy data of the stereo matching algorithm across six separate tests. Each test involved 53 matching attempts, with the occurrence of matching errors and their percentage being meticulously recorded. The data reveals variability in error rates across the tests, with two instances (tests two and six) demonstrating a 0% error rate, indicative of flawless matching accuracy. In contrast, the remaining four tests exhibited error rates varying from 3.8% to 9.3%. Collectively, across all 318 tests, 12 instances of matching errors were recorded, culminating in an aggregate error rate of 3.8%. These findings suggest that the enhanced stereo matching algorithm predominantly succeeds in accurately matching disparity maps and assessing cargo volume in logistics vehicles. The computed average error rate of 3.8% is deemed acceptable for practical applications, especially considering the inherent complexities and variabilities associated with volume measurement in the logistics sector. Moreover, this modest error rate implies that occasional mismatches are unlikely to substantially impede the overall operational efficiency of the logistics system.
The data presented in Figure 8 were scrutinized to evaluate the efficacy of the method employed for cargo volume calculation in logistics vehicles, which is based on the statistical analysis of image pixel heights. Observations of the three groups of measurement data revealed notable consistency and stability, despite fluctuations suggesting inherent uncertainties. These fluctuations are attributable to factors such as intrinsic camera errors, irregularities on object surfaces, and variations in the measurement environment. However, the clustering of measurement results within a defined range, absent of outliers, indicates the measurement system's commendable repeatability and stability. It was noted that measurement fluctuations marginally increased with distance, a trend consistent with the expectation that measurement errors escalate with increased distance. Hence, despite observed variances, the method under scrutiny demonstrates a reliable pattern of consistent and stable measurements across the entire dataset, underscoring its applicability and effectiveness in real-world scenarios for measuring cargo volume in logistics vehicles.
Table 3 details the measurements of cargo volumes and corresponding relative errors for three distinct logistics vehicles, identified as a, b, and c. Relative error, a measure of deviation from a benchmark or expected value, serves as an indicator of the precision of measurements. The data indicate fluctuations in relative error for each vehicle: for vehicle a, the error ranged between -6.31% and 4.32%; for vehicle b, between -6.24% and 7.68%; and for vehicle c, between -3.56% and 6.78%. These results suggest that the method for cargo volume calculation, predicated on the analysis of image pixel heights, consistently yields minimal relative errors in the majority of instances. This observation attests to the method's effectiveness and reliability in providing accurate volumetric assessments for various logistics vehicles.
Table 1. Corrected images of cargo piles in logistics vehicles and calculated disparity maps
|
Number of Times |
Height: 8m |
Height: 9m |
Height: 10m |
|||
|
Cargo Volume Measurement Value |
Relative Error |
Cargo Volume Measurement Value |
Relative Error |
Cargo Volume Measurement Value |
Relative Error |
|
|
1 |
4526.32 |
6.35 |
4125.32 |
-4.45 |
3895.22 |
-7.23 |
|
2 |
4589.36 |
8.56 |
4189.23 |
-5.23 |
4578.31 |
4.12 |
|
3 |
4125.36 |
-4.78 |
4157.58 |
-3.18 |
7689.45 |
9.26 |
|
4 |
4578.29 |
5.88 |
4463.89 |
6.38 |
4023.58 |
-5.57 |
|
5 |
4126.38 |
-4.26 |
4056.33 |
-5.11 |
4658.13 |
7.15 |
|
6 |
4568.27 |
7.65 |
4562.38 |
-3.12 |
4589.71 |
8.23 |
|
7 |
4015.23 |
-6.52 |
4478.68 |
6.65 |
4689.21 |
9.57 |
|
8 |
4125.17 |
-4.23 |
4412.23 |
6.37 |
4125.29 |
-6.36 |
|
9 |
4126.33 |
-5.17 |
4356.87 |
4.35 |
4187.22 |
-6.27 |
|
10 |
3989.26 |
-7.58 |
4523.28 |
5.48 |
4156.89 |
-5.21 |
Table 2. Algorithm matching accuracy data
|
Number of Times |
Total Number of Tests |
Number of Matching Errors |
Error Percentage (%) |
|
1 |
53 |
3 |
5.6 |
|
2 |
53 |
0 |
0 |
|
3 |
53 |
2 |
3.8 |
|
4 |
53 |
2 |
3.8 |
|
5 |
53 |
5 |
9.3 |
|
6 |
53 |
0 |
0 |
|
Total |
318 |
12 |
3.8 |
Table 3. Cargo volume measurement values of different logistics vehicles
|
Number of Times |
Logistics Vehicle a |
Logistics Vehicle b |
Logistics Vehicle c |
|||
|
Cargo Volume Measurement Value |
Relative Error |
Cargo Volume Measurement Value |
Relative Error |
Cargo Volume Measurement Value |
Relative Error |
|
|
1 |
291.25 |
-0.68 |
243.58 |
4.79 |
2897.15 |
1.35 |
|
2 |
284.25 |
-2.54 |
221.47 |
-4.56 |
2952.36 |
0.52 |
|
3 |
269.34 |
-5.63 |
236.89 |
0.63 |
2924.53 |
-0.14 |
|
4 |
311.73 |
3.10 |
246.23 |
5.56 |
2843.56 |
-3.56 |
|
5 |
278.93 |
-1.25 |
241.25 |
3.78 |
3001.26 |
2.01 |
|
6 |
301.45 |
2.56 |
212.23 |
-5.12 |
2956.24 |
1.21 |
|
7 |
274.89 |
-1.617 |
248.67 |
7.68 |
3124.58 |
6.78 |
|
8 |
288.63 |
-1.23 |
234.56 |
0.42 |
3126.36 |
3.56 |
|
9 |
304.12 |
4.32 |
228.36 |
-6.24 |
2897.53 |
-0.83 |
|
10 |
278.23 |
-6.31 |
239.56 |
2.89 |
3012.76 |
2.14 |
Figure 8. Key pixel distance measurements in cargo pile images of logistics vehicles
This research presents an intelligent logistics vehicle cargo optimization system, characterized by its innovative and effective approach. The cornerstone of this system is the utilization of an enhanced stereo matching algorithm, designed to augment measurement accuracy in multifaceted environments. This aspect proves crucial for addressing challenges associated with objects of irregular shapes and varied reflectivity. The refinement of this algorithm ensures the acquisition of consistent and reliable volume measurements across diverse conditions. Furthermore, the system transcends certain constraints inherent in traditional volume measurement methodologies, such as reliance on the reflective or absorptive properties of materials and the shape of objects. This transcendence is achieved through the implementation of a novel method, predicated on the statistical analysis of image pixel heights. Precision in camera calibration and the extraction of pixel height data facilitate the swift and accurate computation of vehicle cargo volume, enhancing the efficacy of loading optimization strategies.
Experimental data analysis corroborates the proposed method's consistency and precision across a spectrum of tests. Notwithstanding observable fluctuations in specific instances, the overall error rate is maintained at a minimal level, underscoring the system's dependability. The system's ability to provide stable volume measurements for various logistics vehicles at different heights further underscores its applicability in real-world settings.
In conclusion, the system developed in this study amalgamates an advanced stereo matching algorithm with a pixel height statistical analysis method. This fusion demonstrates substantial potential in managing intricate cargo types and diverse logistics environments. The system represents a forward-thinking technological solution, poised to substantially enhance logistics efficiency and reduce operational costs. Its application is anticipated to be extensive in future logistics and supply chain management, signifying a significant contribution to the evolution of intelligent logistics.
This work was supported by The Youth Innovation Team of Shaanxi Universities; Shaanxi Provincial Department of Science and Technology Project (Grant No.: 2023-GHYB-10); "The Belt and Road" International Land Port Logistics Joint Research Center of Shaanxi Province (Grant No.: GH202310); Shaanxi Provincial Social Science Fund Project (Grant No.: 2020D042); Xi’an Social Science Fund Project (Grant No.: JG59); Scientific Research Program Funded by Education Department of Shaanxi Provincial Government (Grant No.: 23JP145).
[1] Yu, H., Liu, J. (2023). Research on an intelligent logistics blockchain consensus algorithm. Lecture Notes in Electrical Engineering, 1044: 206-214. https://doi.org/10.1007/978-981-99-2092-1_26
[2] Farchi, F., Farchi, C., Touzi, B., Mabrouki, C. (2023). A comparative study on AI-based algorithms for cost prediction in pharmaceutical transport logistics. Acadlore Transactions on AI and Machine Learning, 2(3): 129-141. https://doi.org/10.56578/ataiml020302
[3] Tao, J., Ni, S., Ding, T. (2023). Research on collaborative innovation evaluation of intelligent logistics park. IEEE Transactions on Engineering Management, 70(12): 4048-4061. https://doi.org/10.1109/TEM.2021.3108417
[4] Wang, G., Cui, D. (2020). Research on vehicle routing branch pricing algorithm for multi-model electric vehicles based on board testing. In Proceedings of 2020 IEEE International Conference on Power, Intelligent Computing and Systems (ICPICS 2020), Shenyang, China, pp. 954-959. https://doi.org/10.1109/ICPICS50287.2020.9202175
[5] Wang, T.K., Lin, Y.H., Chuan, C.H., Lin, J.M. (2020). Applying ant algorithm to the automatic control system of freight load. In Proceedings - 2020 International Symposium on Computer, Consumer and Control (IS3C 2020), pp. 251-254. https://doi.org/10.1109/IS3C50286.2020.00072
[6] Yang, M., Li, K. (2020). Multi-Objective vehicle routing problem based on NSGA-II. In Proceedings of 2020 IEEE 3rd International Conference on Information Systems and Computer Aided Education (ICISCAE 2020), Dalian, China, pp. 382-386. https://doi.org/10.1109/ICISCAE51034.2020.9236882
[7] Kress, D., Meiswinkel, S., Pesch, E. (2019). Straddle carrier routing at seaport container terminals in the presence of short term quay crane buffer areas. European Journal of Operational Research, 279(3): 732-750. https://doi.org/10.1016/j.ejor.2019.06.028
[8] Ma, H. (2023). Simulation of logistics route optimization model based on genetic algorithm optimization neural network. Proceedings-2023 2nd International Conference on Artificial Intelligence and Autonomous Robot Systems, AIARS 2023, Bristol, United Kingdom, pp. 105-109. https://doi.org/10.1109/AIARS59518.2023.00028
[9] Tulach, P., Foltin, P., Gesvret, M., Zlatník, D. (2021). Replacement possibilities of the medium-size truck transport capability by UAVs in the disturbed logistics infrastructure. In Modelling and Simulation for Autonomous Systems: 7th International Conference, MESAS 2020, Prague, Czech Republic, October 21, 2020, Revised Selected Papers 7, Springer, Cham, pp. 139-153. https://doi.org/10.1007/978-3-030-70740-8_9
[10] Ulaganathan, V., Sengupta, A. (2023). Spatio-temporal programming of lyotropic phase transition in nanoporous microfluidic confinements. Journal of Colloid and Interface Science, 649: 302-312. https://doi.org/10.1016/j.jcis.2023.06.010
[11] Zhu, L., Sheng, X. (2022). On image-processing-based identification method of express logistics information. Traitement du Signal, 39(3): 1019-1025. https://doi.org/10.18280/ts.390329
[12] Mei, Z., Tang, Z. (2022). Heuristic search algorithm for three-dimensional packing problem. In Second International Conference on Advanced Algorithms and Signal Image Processing (AASIP 2022), Hulun Buir, China, 12475: 453-459. https://doi.org/10.1117/12.2659334
[13] He, S.H., Wang, Y., Liu, H.D. (2022). Image information recognition and classification of warehoused goods in intelligent logistics based on machine vision technology. Traitement du Signal, 39(4): 1275-1282. https://doi.org/10.18280/ts.390420
[14] Takahashi, Y., Zhou, Y., Miyamoto, T., Higashi, H., Nakamichi, N., Takeda, Y., Kato, Y., Korchev, Y., Fukuma, T. (2019). High-speed SICM for the visualization of nanoscale dynamic structural changes in hippocampal neurons. Analytical Chemistry, 92(2): 2159-2167. https://doi.org/10.1021/acs.analchem.9b04775
[15] Lee, S., Jevremovic, T. (2015). Modeling of high-Z materials detection in assessing brightness/density ratios and their impact on detection accuracy. In 2015 6th International Conference on Information, Intelligence, Systems and Applications (IISA), Corfu, Greece, pp. 1-6. https://doi.org/10.1109/IISA.2015.7388094
[16] Quan, Z., Wu, B., Luo, L. (2023). An image stereo matching algorithm with multi-spectral attention mechanism. Sensors, 23(19): 8179. https://doi.org/10.3390/s23198179
[17] Pérez-Patricio, M., Aguilar-González, A. (2019). FPGA implementation of an efficient similarity-based adaptive window algorithm for real-time stereo matching. Journal of Real-Time Image Processing, 16(2): 271-287. https://doi.org/10.1007/s11554-015-0530-6
[18] Qiao, S., Yang, J., Meng, L., Yan, S. (2019). Hardware implementation of census stereo matching algorithm. In 2019 IEEE International Conference on Electron Devices and Solid-State Circuits, EDSSC 2019, Xi'an, China, pp. 1-3. https://doi.org/10.1109/EDSSC.2019.8753990
[19] Kadmin, A.F., Hamzah, R.A., Manap, M.N.A., Hamid, M.S., Mohammed, N., Aziz, K.A.A. (2022). Improvement of disparity measurement of stereo vision algorithm using modified dynamic cost volume. In Lecture Notes in Electrical Engineering: Proceedings of the 6th International Conference on Electrical, Control and Computer Engineering, In ECCE 2021, Springer, Singapore, 842: 845-856. https://doi.org/10.1007/978-981-16-8690-0_74
[20] Gao, S., Wang, H., Lou, X. (2021). A low-complexity end-to-end stereo matching pipeline from raw bayer pattern images to disparity maps. IEEE Access, 9: 47786-47794. https://doi.org/10.1109/ACCESS.2021.3068497
[21] Toledo, J., Lauer, M., Stiller, C. (2022). Real-time stereo semi-global matching for video processing using previous incremental information. Journal of Real-Time Image Processing, 19(1): 205-216. https://doi.org/10.1007/s11554-021-01175-y