Sukru Aykat![]() | Sibel Senan*
| Sibel Senan*![]()
© 2023 IIETA. This article is published by IIETA and is licensed under the CC BY 4.0 license (http://creativecommons.org/licenses/by/4.0/).
OPEN ACCESS
Diabetic drusen, choroidal neovascularization (CNV), and macular edema (DME) are some retinal diseases that can cause severe blindness and vision loss. Early diagnosis of retinal diseases is vital to prevent this irreversible damage to the eye. The problem statement of this study can be given as presenting new deep learning based results for detecting these retinal diseases. For this purpose, OCT dataset was used to detect CNV, DME and Drusen patients. This data set, which is frequently used in the literature, consists of CNV, DME, Drusen and Normal retina images. RestNet50, InceptionV3, InceptionResnetV2, MobileNet, DenseNet-201, Xception, EfficentNetB4, EfficentNetB7 and EfficentNetV2S models of the CNN architecture were applied to the data set and the performance results of these models were obtained. Then, in order to increase the classification performance of each of these models, hyperparameter tuning was performed by reducing the learning rate by half in each epoch. Later, a hybrid version of the EfficientNetV2S and Xception convolutional neural network models, the most successful of these hyperparameter-tuned models, was developed. The performance analysis results of our proposed hybrid deep learning model are given by comparing them with traditional deep learning models in the literature. These comparison results show that the classification success of the proposed model is higher than the success of traditional deep learning models in the literature. Thus, the proposed hybrid model can shorten the clinical diagnosis time. In addition, the costs of healthcare services can be reduced by intervening in treatable diseases earlier, instead of more costly interventions in the advanced stages of the disease.
convolutional neural networks, deep learning, disease detection, retinal diseases
The human eye, a vital sensory organ, significantly influences our quality of life. Unfortunately, today, retinal diseases pose a severe threat, often leading to substantial visual impairment and even blindness. Among the most common retinal diseases are Myopia, Drusen, Diabetic Retinopathy (DR), Diabetic Hypertension (DH), Diabetic Macular Edema (DME), Glaucoma, Choroidal Neovascularization (CNV), Cataract, and Age-related Macular Degeneration (AMD). Early detection of these diseases is paramount to prevent irreversible ocular disorders [1]. In this paper, we present a study focusing on the detection of CNV, DME, and Drusen, which are among the most prevalent retinal diseases [2-10] and extensively discussed in the literature [11-20].
CNV is characterized by the formation of small, irregular blood vessels in the retina [21]. The inability to transport oxygen through the retinal blood vessels often leads to their abnormal dilation and fragility [22]. The resulting delicate vessels rupture under minimal pressure, resulting in retinal hemorrhages. CNV prompts visual loss due to vitreous hemorrhage and vasodilation. More than 200,000 people in the United States are diagnosed with CNV each year [23]. DME, on the other hand, is a condition prevalent among diabetics, caused by high blood sugar levels damaging the retinal vessels. The fluid from these compromised vessels leaks into the macula, leading to blurred vision [24]. Drusen comprises yellow deposits of lipids located beneath the retina [25].
The progression and detection of retinal diseases are observed through irregularities in or near various parts of the eye's retina, including the optic disc, blood vessels, and fovea [26]. Retinal images are essential for these observations. To accurately analyze retinal images, structures like the optic disc and macula in the retina's natural structure must be correctly identified and differentiated from degenerative signs [27]. Ophthalmologists diagnose retinal diseases by analyzing these images. However, some studies predict that in the future, a scarcity of ophthalmologists may render them unable to cater to all retinal patients [28]. This stark disproportion between retinal patients and the number of ophthalmologists could lead to service delays. Hence, in such a scenario, there would be a pressing need for systems that can automatically detect eye diseases, thereby assisting ophthalmologists in managing their workload.
Optical Coherence Tomography (OCT) is an imaging technique capable of evaluating retinal structures at microscopic resolution [29]. OCT measures the time delay between light emission and its reflection from the target tissue, akin to the sound used in ultrasonography. Due to the high speed of light scans, the reflection is measured as direct detection is unfeasible. OCT scans are obtained by rapidly scanning the macula from all sides with an OCT light source. Similar to ultrasound images, the B-scan is combined to form a linear image [30]. Currently, only a limited number of datasets containing OCT images are available. In this study, we utilized the publicly accessible OCT image dataset presented by Kermany et al. [31] in 2018 to detect the aforementioned retinal diseases.
In recent years, the medical field has increasingly leveraged artificial intelligence (AI) methodologies, with deep learning techniques being applied to medical imaging analysis to yield significant advancements. The literature review section of this study highlights the numerous recent investigations that utilize deep learning models for the analysis of retinal images.
The primary objective of this study is to employ a deep learning approach to detect retinal diseases with a high degree of accuracy. To accomplish this, we first applied nine different deep learning models to the OCT image database and analyzed their disease detection success rates. Additionally, we performed hyperparameter tuning to enhance these models' performance. Subsequently, we developed a hybrid model that we term EffXCeptNet. This model combines two pre-trained convolutional neural networks (CNNs), namely EfficientNetV2S and Xception, with modified hyperparameters. To demonstrate the efficacy of our proposed model, we conducted performance evaluations and presented the accuracy percentages of the discussed models. According to these evaluations, the proposed deep learning model, EffXceptNet, achieved accuracy, recall, and precision values of 99.90%. The performance analysis results indicate that EffXCeptNet outperforms the nine other deep learning models applied for the considered eye diseases. While the superior performance of EffXCeptNet is demonstrated for the eye diseases discussed in this study, we expect this model to yield equally successful results when trained with different medical image sets, implying that it can be applied for the detection of various diseases.
This study is organized into five sections:
The Introduction section provides an overview of retinal diseases, deep learning methodology, and the aim of this study.
The Literature Review section summarizes previous studies on the detection of retinal diseases.
The Material and Methods section describes the dataset used in this study for retinal disease classification, the deep learning methods employed, and the proposed hybrid deep learning model.
The Results section presents the performance outcomes of the examined models. It also demonstrates the efficiency and success of the proposed model by providing comparative analyses of the performance results of the discussed models and the proposed model.
The Conclusion section summarizes the key findings of the study.
Retinal images are typically obtained using imaging techniques such as Fundus Fluorescent Angiography (FFA), OCT, and Indocyanine Green Angiography (ICG) [32]. The literature abounds with studies that employ OCT images for the detection of retinal diseases.
For instance, Lu et al. [33] proposed a deep learning-based smart system to classify OCT images into four categories, offering predictions that exhibited greater reliability and better consistency than those made by experts. De Fauw et al. [34] developed a novel deep learning architecture applied to three-dimensional OCT images, demonstrating performance that matched expert detection in some retinal diseases.
Saha et al. [35] created a system for detecting AMD symptoms from OCT images. The proposed system used a transfer learning algorithm, eliminating the need for thousands of images or a highly specialized deep learning machine. Wang et al. [36] proposed a fully automated CNV segmentation and diagnosis algorithm using a CNN. They employed a clinical dataset that included eye scans of both CNV and non-CNV patients, achieving a specificity of 95% in their test data.
Sunija et al. [37] proposed a deeply separable convolution model to classify glaucoma and healthy images using Spectral-Domain OCT (SD-OCT) images. This proposed network resulted in a higher overall achievable accuracy with less computational complexity and produced effective results. Elsharkawy et al. [38] proposed a computer-assisted diagnostic method to detect DR using structural 3D retinal scans. They used prior shape information to segment retinal layers from 3D-OCT images.
Several studies have also binary-classified DME, Drusen, and CNV retina images against healthy retina images. Chan et al. [39] proposed a model that uses Principal Component Analysis to reduce the size of features extracted from GoogleNet, VggNet, and AlexNet. They then designed a model capable of classifying Normal and DME OCT images using majority voting based on the rule of multiplicity.
Perdomo et al. [40] presented an OCT-NET model for DME diagnosis based on a CNN that could automatically classify OCT volumes. Vahadane et al. [41] developed a two-part system to classify DME. Initially, they used image processing techniques to identify areas with hard exudates and fluid, followed by a deep CNN to predict the labels of the regions found. Finally, they employed a model to predict DME disease with the CNN model.
Jin et al. [42] developed a multimodal deep learning model using Optical Coherence Tomography Angiography (OCTA) and OCT images to assess CNV in AMD patients, achieving 95.5% accuracy for the dataset in their study. Daghistani [43] employed a method that includes a CNN for the DME classification task. Five models consisting of different convolution layers were created to demonstrate the effect of convolution. The CNN model with five convolutional layers exhibited the best performance in classifying DME, corroborating the notion that a higher number of convolution layers enhances the accuracy of the model.
Several studies in the literature, akin to our own, discuss machine learning methods used to detect individuals with CNV, DME, drusen, and healthy individuals from OCT images.
Kaymak and Serener [11] developed a system for automatically detecting AMD and DME from OCT images, employing a deep learning algorithm trained on images from healthy individuals as well as those with DME, wet AMD, and dry AMD.
Fang et al. [12] introduced a lesion-sensitive CNN method for classifying retinal OCT images. They originally designed a grid to detect lesions and then generated an attention map from the OCT image using this grid. This attention map was subsequently incorporated into the classification network.
Rong et al. [13] proposed a surrogate-assisted classification method to automatically classify retinal OCT images based on CNN. They first reduced the noise in the images, removed the masks by applying morphological thresholding and broadening, and used these images to create surrogate images. The test images were then estimated by averaging the outputs from the CNN model trained on representative images.
Rastogi et al. [14] endeavored to detect DME, CNV, and drusen from OCT images. They proposed a detection model based on deep learning architectures to detect retinal diseases, utilizing a Dense Connected Convolutional Neural Network (DenseNet) and achieved 98% accuracy on the training set.
Hwang et al. [44] integrated cloud computing with AI and telemedicine in their study for the diagnosis of AMD. They designed a user-friendly cloud system website, enabling anyone with an internet connection and a computer to use the AI model.
Li et al. [15] proposed a model that categorizes retinal patients into four classes: DME, CNV, normal, and drusen, using the pre-trained deep learning method VGG16. They achieved a prediction accuracy of 98.6% on a validation dataset of 1,000 images.
Shih and Patel [16] presented a new deep learning classification technique applied to OCT retinal images, with the dataset comprising one normal and three most common retinal disease scans. They evaluated several parameters and different classifiers in the training network architecture.
Adel et al. [17] proposed a multiclassification model based on OCT images to detect retinal eye diseases. They used transfer learning over direct CNN, employing the Xception and InceptionV3 transfer learning models. They opted for the categorical hinge loss function (known as SVM loss) over softmax loss to classify four eye diseases.
Berrimi and Moussaoui [18] proposed a new CNN classification architecture based on deep learning and transfer learning, using retinal images obtained from the OCT device. They compared their architecture's performance with pre-trained models such as VGG16 and InceptionV3 and achieved 98.5% accuracy on the test set.
Gupta et al. [19] aimed to design an AI-based automated network to help ophthalmologists more accurately identify and categorize eye diseases from OCT images, such as drusen, DME, and CNV. They achieved 83.66% accuracy performance for test images using a CNN architecture.
Yan et al. [45] developed a classification system based on OCT images, dividing them into four categories: drusen, inactive CNV, active CNV, and normal. They trained a ResNet-34 deep learning model containing a Convolutional Block Attention Module (CBAM) on the dataset.
Saleh et al. [20] used OCT images to classify patients as drusen, DME, normal, and CNV. They used transfer learning-based SqueezeNet and InceptionV3 techniques to classify retinal diseases, achieving high performance as a result of their study.
The methodologies, datasets utilized, and performance metrics of the studies discussed in the literature review, as well as the parameter values of our own study, are all presented in Table 1. A review of Table 1 elucidates that OCT images yield promising results with high accuracy rates in the detection of retinal diseases.
In several of the studies discussed [39-43], binary classification is employed. However, it's important to note that real-world problems often manifest as multiclass classification issues. In the remaining studies, four distinct retinal diseases are classified. The most successful outcomes in quadruple classifications, apart from our study, have been achieved by Shih and Patel [16], and Berrimi and Moussaoui [18].
Table 1. The detailed analysis of the models discussed
|
Study |
Method |
Data Set |
Classification |
Accuracy (%) |
|
Chan et al. [39] |
(AlexNet, VggNet, GoogleNet) + (SVM, KNN, RF) |
SERI |
DME, Normal |
93.75 |
|
Perdomo et al. [40] |
OCT-NET |
SERI |
DME, Normal |
93.75 |
|
Vahadane et al. [41] |
CNN |
Specific |
DME, Normal |
Pre: 96.43 |
|
Jin et al. [42] |
UFNet |
OCT OCTA |
Inactive CNV, Active CNV |
OCT: 97.85 OCTA: 98.93 |
|
Daghistani [43] |
CNN |
UCSD |
DME, Normal |
82.00 |
|
Kaymak and Serener [11] |
AlexNet |
UCSD |
DME, Drusen, wet AMD, Normal |
97.10 |
|
Fang et al. [12] |
LACNN |
UCSD |
Drusen, CNV, DME, Normal |
90.10 |
|
Rong et al. [13] |
CNN |
Specific, Duke |
DME, AMD, Normal |
95.09 |
|
Rastogi et al. [14] |
DenseNet |
UCSD |
Drusen, CNV, DME, Normal |
97.65 |
|
Hwang et al. [44] |
VGG16, InceptionV3, ResNet50 |
Specific |
Drusen, active wet AMD and inactive wet AMD, Normal |
VGG16: 91.40, InceptionV3: 92.67, ResNet50: 90.73 |
|
Li et al. [15] |
ResNet50 |
UCSD |
Drusen, CNV, DME, Normal |
96.30 |
|
Shih and Patel [16] |
VGG16 |
UCSD |
Drusen, CNV, DME, Normal |
99.48 |
|
Adel et al. [17] |
InceptionV3 + SVM, Xception + SVM |
UCSD |
Drusen, CNV, DME, Normal |
Model 1: 93.00, Model 2: 98.00 |
|
Berrimi and Moussaoui [18] |
First CNN, Second CNN, VGG16, InceptionV3 |
UCSD |
Drusen, CNV, DME, Normal |
First CNN: 97.70, Second CNN: 98.75, VGG16: 93.50, InceptionV3: 99.27 |
|
Gupta et al. [19] |
CNN |
UCSD |
Drusen, CNV, DME, Normal |
83.66 |
|
Yan et al. [45] |
ResNet-34 |
UCSD |
Drusen, Inactive CNV, Active CNV, Normal |
91.29 |
|
Saleh et al. [20] |
SqueezeNet, InceptionV3 |
UCSD |
Drusen, CNV, DME, Normal |
SqueezeNet: 98.00, InceptionV3: 98.40 |
|
Proposed Study |
EffXCeptNet |
OCT |
Drusen, CNV, DME, Normal |
99.90 |
In the study by Berrimi and Moussaoui [18], the InceptionV3 model demonstrated superior results compared to the VGG16 model. Similarly, in the study by Adel et al. [17], the Xception model outperformed the InceptionV3 model. These results imply that the Xception model, which was utilized in these studies and forms a part of our hybrid model, is the most successful model.
High-accuracy detection is particularly crucial in health-related studies. The literature on disease detection from images sets certain performance benchmarks for success. The objective of studies conducted in this domain is centered around introducing systems that will enhance the success rate in disease detection, a principle that our work adheres to. In this study, we propose a hybrid model that amalgamates high-performance deep learning architectures with the aim of boosting the accuracy performance in detecting retinal diseases from OCT images.
In this study, different versions of CNN architecture were applied to OCT retinal images database to detect CNV, DME and Drusen patients and the performance results of these models were obtained. The CNN models discussed in the study are RestNet50, InceptionV3, InceptionResnetV2, MobileNet, DenseNet-201, Xception, EfficentNetB4, EfficentNetB7 and EfficentNetV2S. After that, hyperparameter tuning process was performed for each of these models to increase their classification performance. Then, the proposed model, which is a hybrid version of the most successful of these hyperparameter tuned models, EfficientNetV2S and Xception CNN models, was developed.
The study can be evaluated in 4 steps:
3.1 Convolutional neural network (CNN)
CNN architecture is a deep learning model often used for classification in applications with many data, such as images.
CNN is made up of neurons with biases and weights that need to be trained in a manner similar to conventional neural networks. Multiplication of inputs and weights is applied in each neuron [46]. CNN architecture is a combination of a series of successive layers. Following the input layer, where an image with width and height is used, as shown in Figure 1, there are three main layers: fully connected, pooling, and convolution. These layers are added one after the other to form a CNN architecture [47].
3.1.1 Convolutional layer
The convolutional layer detects features of images such as lines, edges, drops of color, etc. The convolutional layer creates a feature map that applies a filter to all pixels of the image at each cycle and estimates class probabilities based on image features. The filter acts on the parts that make up the image to check whether the desired feature is available [48-50].
3.1.2 Pooling layer
The pooling or subsampling layer is used to reduce the width and height of the activation map, as shown in Figure 2. They are special pooling types where the average and maximum values are taken. In general, they reduce the number of parameters and calculations that increase due to the increase in the number of convolutional layers in the network [51-53].
3.1.3 Fully connected layer
Fully connected layers come after pooling layers. Attributes are obtained from the outputs of the pooling and convolution layers from the input images. The fully connected layer uses these properties to classify the image into a predetermined class.
3.2 The CNN models discussed
3.2.1 ResNET50 network
He et al. [54] used a network structure called residual neural network (ResNet), which took first place at the ImageNet Large Scale Visual Recognition Challenge (ILSVRC 2015). ResNet proposed residual connections between layers, which help preserve knowledge gain, reduce loss, and boost performance during the training. ResNet50 consists of 50 layers, including 48 convolution layers, 1 Average Pooling layer, and 1 Max Pooling layer. Figure 3 shows the structure of the ResNet architecture.
Figure 1. Layers of convolutional neural networks
Figure 2. Max pooling and average pooling filter
3.2.2 InceptionV3 network
The Inception network is a pre-trained CNN model introduced by Google in 2014 [55]. This network consists of 22 layers, with max pooling and filters of different sizes used to extract features at various scales. Small filters are used to save time in calculations. In 2015, Google introduced 48-layer InceptionV3 [56], where Convolution layers are factored to reduce parameters in the Inception model. Two 3×3 filters were used instead of 5×5 convolutional filters to reduce computation without affecting the performance of the networks. The structure of the InceptionV3 architecture is shown in Figure 4.
3.2.3 InceptionResnetV2 network
InceptionResNetV2 is a network consisting of residual connections [54] and a combination of the Inception architecture [56]. Improves network performance while avoiding gradient disappearance and gradient explosion [57]. The block diagram of the InceptionResnetV2 architecture is shown in Figure 5.
Figure 3. The architecture of the ResNET50 network model
Figure 4. Architecture of InceptionV3 network model
Figure 5. Architecture of InceptionResnetV2 network model
3.2.4 MobileNet network
MobileNet consists of light deep CNN using deeply separable convolutions. This architecture provides an efficient model for embedded systems and mobile applications [58]. Deeply separable convolution filters consist of point convolution filters and deep convolution filters. MobileNet's Deeply separable convolution module compresses both computational complexity and parameters. It accelerates image recognition without loss of accuracy as it enables embedded and mobile devices to take full advantage of the processing power of the GPU and CPU [59]. Figure 6 shows the structure of the MobileNet architecture.
3.2.5 DenseNet-201 network
The DenseNet model consists of transition layers, dense blocks, growth rates, and the global average pooling layer [60]. While In K-layer convolutional networks, each layer has a K connection with the next layer, the DenseNet model has a K(K+1)/2 connection. Feature maps of each layer and feature maps of all previous layers are used as inputs for all subsequent layers [61]. DenseNet-201 has three transition layers and four dense block depths. Each dense block has two convolution layers of different sizes. Each convolution layer consists of rectified linear units and batch normalization [60]. DenseNet has many advantages, such as strengthening feature propagation, promoting feature reuse, reducing the vanishing gradient problem, and reducing the number of parameters [62]. The structure of the DenseNet-201 architecture is shown in Figure 7.
3.2.6 Xception network
The Xception architecture [63] introduced by Francois Chollet is an enhanced version of InceptionV3 [56]. The Xception model is based on deeply separable convolution, which divides ordinary convolution into spatial convolution and point convolution. Spatial convolution occurs independently on each input channel. Point-to-point convolution uses 1×1 kernel to evolve from point to point. As the number of parameters decreases, the number of calculations also decreases. Xception consists of 14 modules with 36 convolution layers. Except for the first and last modules, the other modules contain linear residual connections. The structure of the Xception model architecture is shown in Figure 8.
3.2.7 EfficientNet Network
Tan and Le [64] proposed EfficientNet model, which shows higher sensitivity and is more flexible than CNNs. The authors used efficient and simple composite coefficients to uniformly scale the EfficientNet models depth, width, and resolution dimensions. This enables the network using a fixed resource budget to achieve higher performance. The EfficientNet family consists of eight CNN models, named from EfficientNetB0 to EfficientNetB7. From EfficientNetB0 to EfficientNetB7, resolution, width, depth, model size, and accuracy are increasing.
Figure 6. Architecture of MobileNet network model
Figure 7. Architecture of DenseNet-201 network model
Figure 8. Architecture of Xception network model
Figure 9. a) is an example of a basic network. b-d) are conventional scaling that only increases one network width, depth, or resolution dimension. e) is the recommended composite scaling method that evenly scales all three dimensions with a fixed ratio [64]
The EfficientNet architecture consists of excitation and squeeze optimization and Mobile Inverted Bottleneck Convolution (MBConv) [65]. MBConv expands the channel by 1×1 convolution method, then each image performs a deep convolution operation. Deep convolution becomes a feature map by performing a convolution method with d x d cores for all image channels. Each layer goes through the Swish function for the enable function. Unlike the Swish, Tanh and Sigmoid functions, it prevents the gradient value from reaching near zero saturation throughout the learning process. The extracted feature map is replicated with a feature map that bypasses the Compression and Excitation Layer to reveal key features. Finally, the channel is scaled down by a 1×1 convolution operation.
EfficientNetV2 recommended by Tan and Le [66], has higher performance and a shorter training time. It uses the Fused MBConv layer instead of some MBConv layers used in EfficientNet to increase training and efficiency and is up to 6.8x faster than current models. The EfficientNetV2 architecture is available in three versions, EfficientNetV2S, EfficientNetV2M, and EfficientNetV2L.
Figure 9 shows the EfficientNet scaling model. Figure 9 (a)–(d) shows a basic mesh and a traditional scaling technique, respectively, while Figure 9 (e) shows the composite scaling introduced by Tan and Le [64].
3.3 Proposed hybrid CNN model – EffXceptNet
To detect retinal diseases, we first applied a deep learning model with nine different hyperparameter settings in the OCT image database. Next, we developed a hybrid model combining the most successful of these models, EfficientNetV2S and Xception. Figure 10 shows the development stages of our model.
Figure 11 shows the developed hybrid deep learning model architecture. It consists of the combination of two CNN models which are EfficientNetV2S and Xception, two flatten layers, three fully connected layers, and an output layer. An image of 150×150 pixels is given to the model in the input layer. In our proposed model, two CNN models with high performance on the OCT dataset were combined. The Xception model produces 2,048 features in training, and the EfficientNetV2S model produces 1,280 features in training. A total of 3.328 features are obtained by combining the features of both models with the concatenate method. These features are given as input during the classification phase. ReLU activation function is used in fully connected layers. At the same time, Lasso Regression (L1 regularization) value was chosen as 0.001 in fully connected layers to prevent overfitting. The softmax function used in the last layer of the proposed architecture calculates the probabilistic distribution of the input image for four classes in the trained network.
Figure 10. The development stages of the proposed hybrid model
Figure 11. Structure of proposed hybrid model-EffXceptNet
The model we propose is trained with the Adam optimizer. The Adam optimization algorithm has recently been widely used in deep learning applications in computer vision. There are various studies in the literature about the efficiency of Adam Optimizer and its effective results in deep learning [67-70]. In our study, the Adam optimization algorithm was applied to improve the weight coefficients of the network.
Learning rate is one of the most important hyper parameters in model training. We have choose learning rate as 0,001 initially, after several trainings on the training and validation data sets. Learning rates were chosen as 0.1, 0.01, 0.001 and 0.0001, respectively. The best performance and ideal training speed were achieved in model training, where the learning rate was initially selected as 0.001. During the model training, we halved the learning rate in each epoch. The purpose of this is to increase the learning rate by starting the learning rate from a large value. The learning rate was reduced throughout the training to avoid the risk of not reaching the global optimum value.
The categorical cross-entropy loss function, which is a commonly used metric in multiple classification problems, was used on the validation data set. The batch size was determined as 16. With the validation dataset, the loss, accuracy, precision and recall rates of our model were observed during training. The dataset used within the scope of this study, its features and the distribution of training, validation and test datasets are specified in Section 3.4.
3.4 Dataset
Table 2. Distribution of OCT dataset
|
Image Class |
Total |
Training |
Validation |
Testing |
|
Healthy |
26,565 |
25,315 |
1,000 |
250 |
|
CNV |
37,455 |
36,205 |
1,000 |
250 |
|
DME |
11,598 |
10,348 |
1,000 |
250 |
|
DRUSEN |
8,866 |
7,616 |
1,000 |
250 |
Some examples of the dataset are shown in Figure 12.
Figure 12. Sample images from OCT dataset: a) Healthy; b) CNV; c) DME d) DRUSEN
The public OCT image dataset presented in the study of Kermany et al. [31] in 2018 was used in this study. They collected these images from five institutes from 2013 to 2017. The images in the dataset are in 2-dimensional JPEG format, and the image resolutions are different. The image data was reviewed by retinal specialists, ophthalmologists, and medical students. As shown in Table 2, the dataset contains 84,484 OCT scans. The data were split into 1,000 test images, 4,000 validation images, and 79,484 training images. Of the 79,484 training images, 25,315 were labeled Healthy, 36,205 CNV, 10,348 DME, and 7,616 Drusen. Test data consists of 250 images from each class, and validation data consists of 1,000 images from each class. Images are divided into folders in JPEG image format according to their tags.
4.1 Performance analysis metrics
Accuracy, recall, precision and F-score metrics were used as performance measures. Confusion matrix for each model was obtained to calculate these metrics. Confusion matrix represents the False Negative (FN), False Positive (FP), True Negative (TN), and True Positive (TP) values of the classifier performs. TP refers to samples that actually express a positive state and are predicted positively by the classifier. FP refers to samples that actually express a negative condition and are predicted as positive by the classifier. FN refers to samples that actually express a negative condition and are predicted positively by the classifier. TN, denotes samples that represent an actually negative condition and are predicted negatively by the classifier.
Accuracy is the ratio of the number of true and false data that the classifier correctly predicts to the total number of data.
$Accuracy =(T P+T N) /(T P+T N+F P+F N)$ (1)
Recall is the rate at which samples in the Real class are predicted correctly.
$Recall =(T P) /(T P+F N)$ (2)
Precision is the ratio of the number of data the classifier predicts correctly to the actual number of data.
$Precision =(T P) /(T P+F P)$ (3)
F-score value is the harmonic mean of precision and recall values.
$F-Score$$=2 * \frac{\text { Precision } * \text { Recall }}{\text { Precision }+ \text { Recall }}$ (4)
In addition, the Wilcoxon Test, a nonparametric test, was used to determine the significant difference between the original versions of the transfer models and the hyperparameter adjusted versions. The reason why we use a nonparametric test is that the Accuracy, Precision and Recall data are little and do not show a normal distribution.
4.2 Experimental results
Experimental results will be given under 3 stages of the study:
1. Training and validation accuracy graphs of discussed CNN models are shown in Figure 13. The confusion matrices of the models are shown in Figure 14.
In the first phase of the study, analyzes were performed using 9 trained CNN models that are RestNet50, InceptionV3, InceptionResnetV2, MobileNet, DenseNet-201, Xception, EfficentNetB4, EfficentNetB7 and EfficentNetV2S. The performance analyzes showed that the best performed models are MobileNet and Xception.
The accuracy, recall, and precision metrics values of the examined models are shown in Table 3. The Xception is the model with the best performance, with an overall accuracy rate of 99.30% compared to the other models. The second best performed model is MobileNet with an overall accuracy rate of 99.10%. The lowest performing models are EfficientNetB4 with 31.60% accuracy and EfficientNetB7 with 55.40% accuracy.
2. Hyperparameter tuning was performed to improve the performances of 9 CNN models trained on the OCT dataset. We halved the learning rate per epoch. Because when the learning rate is too large, the error value increases. At the same time, if the learning rate is too low when the model starts training, it may cause the global minimum not to be reached. The validation and training accuracy graphs obtained with hyperparameter tuned CNN models are shown in Figure 15. Confusion matrices of nine hyperparameter deep learning models used in our study are shown in Figure 16.
In the second phase of the study, analyzes were performed using 9 hyperparameter tuned CNN models. At this stage, the learning rate of RestNet50, InceptionV3, InceptionResnetV2, MobileNet, DenseNet-201, Xception, EfficentNetB4, EfficentNetB7 and EfficentNetV2S models were reduced by half in each epoch during the training process. It was seen that the hyperparameter tuned CNN models performed better than the original CNN models.
Accuracy, recall, precision and F-score metrics values of hyperparameter tuned CNN models are shown in Table 4. Among the hyperparameter tuned deep learning models used in this study, the EfficientNetV2S and Xception models are the best performing models with an overall accuracy rate of 99.80%. The hyperparameter tuned CNN model with the lowest performance is EfficientNetB4, with an overall accuracy of 92.10%.
When Table 3 and Table 4 are examined, it is seen that the performance of the 8 CNN models considered except InceptionResnetV2 has increased. This result shows the effect of hyperparameter tuning on classification success rate.
In Table 5, it is seen that there is a significant difference between the models as the p values of accuracy, precision and recall are less than 0.05 (accuracy Z=-2.075, p<0.05; precision Z=-2.192, p<0.05; recall Z=-2.194, p<0.05). When looking at the mean rank and sum of the ranks, it is seen that this difference is in favor of the hyperpameter adjusted models. Therefore, the performance of the models was significantly increased by adjusting the hyperpameter.
Table 3. Performance metrics values of transfer learning models
|
Model |
Accuracy (%) |
Precision (%) |
Recall (%) |
F-Score (%) |
|
DenseNet-201 |
95.40 |
96.00 |
95.30 |
95.65 |
|
EfficientNetB4 |
31.60 |
36.17 |
25.50 |
29.91 |
|
EfficientNetB7 |
55.40 |
78.52 |
55.40 |
64.96 |
|
EfficientNetV2S |
94.80 |
94.89 |
94.70 |
94.79 |
|
InceptionResnetV2 |
96.60 |
96.79 |
96.60 |
96.69 |
|
InceptionV3 |
98.30 |
98.30 |
98.30 |
98.30 |
|
MobileNet |
99.10 |
99.10 |
99.10 |
99.10 |
|
RestNet50 |
95.70 |
96.07 |
95.40 |
95.73 |
|
Xception |
99.30 |
99.40 |
99.30 |
99.35 |
Table 4. Performance metrics values of hyperparameter tuned deep learning models
|
Model |
Accuracy (%) |
Precision (%) |
Recall (%) |
F-Score (%) |
|
DenseNet-201 |
99.50 |
99.50 |
99.50 |
99.50 |
|
EfficientNetB4 |
92.10 |
92.18 |
92.00 |
92.09 |
|
EfficientNetB7 |
99.50 |
99.50 |
99.50 |
99.50 |
|
EfficientNetV2S |
99.80 |
99.80 |
99.80 |
99.80 |
|
InceptionResnetV2 |
95.20 |
95.20 |
95.20 |
95.20 |
|
InceptionV3 |
99.40 |
99.40 |
99.40 |
99.40 |
|
MobileNet |
99.60 |
99.60 |
99.60 |
99.60 |
|
RestNet50 |
98.90 |
98.90 |
98.90 |
98.90 |
|
Xception |
99.80 |
99.80 |
99.80 |
99.80 |
Figure 13. Performance graphs of transfer learning architectures. a)DenseNet-201, b)EfficientNetB4, c)EfficientNetB7, d)EfficientNetV2S, e)InceptionResnetV2, f)InceptionV3, g)MobileNet, h)RestNet50, and i)Xception
Figure 14. Confusion matrix graphs of transfer learning architectures. a)DenseNet-201, b)EfficientNetB4, c)EfficientNetB7, d)EfficientNetV2S, e)InceptionResnetV2, f)InceptionV3, g)MobileNet, h)RestNet50, and i)Xception
Figure 15. Performance graphs of hyperparameter tuned deep learning architectures. a)DenseNet-201, b)EfficientNetB4, c)EfficientNetB7, d)EfficientNetV2S, e)InceptionResnetV2, f)InceptionV3, g)MobileNet, h)RestNet50, and i)Xception
Figure 16. Confusion matrix graphs of hyperparameter tuned deep learning architectures. a)DenseNet-201, b)EfficientNetB4, c)EfficientNetB7, d)EfficientNetV2S, e)InceptionResnetV2, f)InceptionV3, g)MobileNet, h)RestNet50, and i)Xception
Table 5. Wilcoxon test results of the performance results of the original versions of the transfer models and the hyperpameter adjusted versions
|
|
Original Model - Hyperparameter Model |
n |
Mean Rank |
Sum of Ranks |
Z |
p |
|
Acc |
Negative Ranks |
2 |
2.50 |
5.00 |
-2.075 |
0.038 |
|
Positive Ranks |
7 |
5.71 |
40.00 |
|
|
|
|
Ties |
0 |
|
|
|
|
|
|
Pre |
Negative Ranks |
1 |
4.00 |
4.00 |
-2.192 |
0.028 |
|
Positive Ranks |
8 |
5.13 |
41.00 |
|
|
|
|
Ties |
0 |
|
|
|
|
|
|
Rec |
Negative Ranks |
1 |
4.00 |
4.00 |
-2.194 |
0.028 |
|
Positive Ranks |
8 |
5.13 |
41.00 |
|
|
|
|
Ties |
0 |
|
|
|
|
Table 6. Comparison of complexity, run time and performance of hyperparameter tuned deep learning models with original versions
|
Models |
Size (MB) |
Number of Parameters |
Model Depth |
Uptime per Epoch (GPU) (sec) |
Model Accuracy (%) |
||
|
Original Model |
Fine Tuned |
Original Model |
Fine Tuned |
||||
|
DenseNet-201 |
80 |
20.2M |
708 |
744 |
615 |
95.40 |
99.50 |
|
EfficientNetB4 |
75 |
19.5M |
475 |
1,170 |
1,100 |
31.60 |
92.10 |
|
EfficientNetB7 |
256 |
66.7M |
814 |
3,300 |
3,366 |
55.40 |
99.50 |
|
EfficientNetV2S |
88 |
21.6M |
480 |
970 |
1,300 |
94.80 |
99.80 |
|
InceptionResNetV2 |
215 |
55.9M |
781 |
590 |
890 |
96.60 |
95.20 |
|
InceptionV3 |
92 |
23.9M |
312 |
240 |
380 |
98.30 |
99.40 |
|
MobileNet |
16 |
4.3M |
87 |
190 |
222 |
99.10 |
99.60 |
|
ResNet50 |
98 |
25.6M |
176 |
360 |
490 |
95.70 |
98.90 |
|
Xception |
88 |
22.9M |
133 |
510 |
500 |
99.30 |
99.80 |
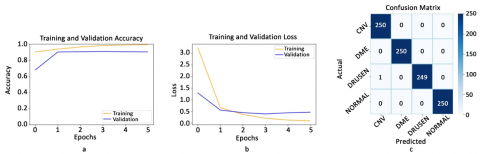
Figure 17. Graphs for hybrid model EffXceptNet. a) Performance, b) Loss, c) Confusion matrix
The complexity of the discussed deep learning models on the dataset, the run times per epoch, and their performance are given in Table 6. It is seen that the model with the least memory size and the number of parameters, the shortest run time per epoch is MobileNet. On the other hand, EfficientNetB7 deep learning model has the most memory size and the number of parameters, longest run time per epoch. The performance of all hyperparameter tuned deep learning models has improved except InceptionResNetV2 based on uptime per epoch and accuracy metrics. The DenseNet-201 and EfficientNetB4 models have shown a decrease in running times per Epoch, while the other models show a slight increase. Due to the increase in the performance of the models, the increase in the study times can be ignored, as the diseases in the retina are better predicted.
3. The proposed hybrid model EffXceptNet was trained on the same OCT dataset. The training and validation accuracy curves of our EffXceptNet model during the training phase are presented in Figure 17a, and the training and validation loss curves are presented in Figure 17b. The confusion matrix plot of the test data of the developed model is shown in Figure 17c.
Our model shows that the training and validation accuracy curves and the training and validation loss curves converge throughout the training process. Our hybrid model measured accuracy, recall, and precision at 99.90%. It is seen that the highest accuracy performance is obtained by the proposed model.
4. Table 7 shows the comparison of the accuracy metrics of the proposed hybrid method and the hyperparameter tuned versions of the discussed deep learning methods. The proposed hybrid model shows the best performance according to accuracy results.
All methods were trained on the same OCT dataset for four classes: Normal, DME, Drusen, and CNV. The proposed hybrid model shows the best performance.
Table 7. Accuracy comparison of the proposed hybrid model with other deep learning models
|
CNN Model |
Accuracy (%) |
|
|
Fine Tuned Models |
EfficientNetB4 |
92.10 |
|
InceptionResnetV2 |
95.20 |
|
|
RestNet50 |
98.90 |
|
|
InceptionV3 |
99.40 |
|
|
EfficientNetB7 |
99.50 |
|
|
DenseNet-201 |
99.50 |
|
|
MobileNet |
99.60 |
|
|
EfficientNetV2S |
99.80 |
|
|
Xception |
99.80 |
|
|
Proposed Model - EffXceptNet |
99.90 |
|
This paper proposes new results on retinal diseases detection using deep learning methods. OCT images were used to perform retinal disease classification problem. Nine different deep learning models and our model EffXceptNet were applied to OCT dataset to classify CNV, DME, and drusen patients and healthy individuals. It was observed that better performances were obtained after hyperparameter tuning performed to the discussed deep learning models. As the performance analysis results show, the proposed hybrid deep learning model outperformed the other models. The classification success of the proposed hybrid model obtained as 99.90%. This result shows the effectiveness of the proposed model in detecting retinal diseases.
This work can be turned into software system as an automatic disease diagnosis tool that can be used by experts in medical departments. In addition, mobile applications can be developed to help general practitioners make quick decisions about retinal diseases. Thus, the proposed EffXceptNet model may shorten the clinical diagnosis time and contributes to the early referral of emergency patients to specialist physicians. Early treatment prevents the progression of retinal disorders. In addition, the costs of health services are reduced by intervening in the treatable disease earlier instead of costlier interventions in the advanced stages of the disease [71, 72]. In addition, models that detect more retinal diseases can be developed besides CNV, DME and DRUSEN diseases we detected in this study. The proposed model can be expanded for to give successful results when different medical image sets are trained with this model. That means the proposed approach can be used to detect different kind of diseases. First of all, a data set containing the diseases to be addressed must be obtained. After this data set is trained on the model we recommend and the necessary optimizations are made, the system will work to diagnose the diseases on which it is trained.
|
Acc |
accuracy |
|
AI |
artificial intelligence |
|
AMD |
age-related macular degeneration |
|
CBAM |
convolutional block attention module |
|
CNN |
convolutional neural network |
|
CNV |
choroidal neovascularization |
|
DenseNet |
dense connected convolutional neural network |
|
CPU |
central processing unit |
|
DH |
diabetic hypertension |
|
DME |
diabetic macular edema |
|
DR |
diabetic retinopathy |
|
FN |
false negative |
|
FP |
false positive |
|
GPU |
graphics processing unit |
|
ICG |
indocyanine green angiography |
|
ILSVRC |
imagenet large scale visual recognition challenge |
|
KNN |
k-nearest neighbor |
|
M |
million |
|
MB |
megabyte |
|
MBConv |
mobile inverted bottleneck convolution |
|
OCT |
optical coherence tomography |
|
OCTA |
optical coherence tomography angiography |
|
Pre |
Precision |
|
Rec |
Recall |
|
ReLU |
rectified linear unit |
|
ResNet |
residual neural network |
|
RF |
random forest |
|
SD-OCT |
spectral domain optical coherence tomography |
|
sec |
second |
|
SVM |
support vector machines |
|
TN |
true negative |
|
TP |
true positive |
|
VGG |
visual geometry group |
|
3D |
3 dimension |
|
Greek symbols |
|
|
% |
percentage |
|
Subscripts |
|
|
Z |
wilcoxon test statistic value |
|
p |
statistical test significance value |
[1] Pennington, K.L., DeAngelis, M.M. (2016). Epidemiology of age-related macular degeneration (AMD): Associations with cardiovascular disease phenotypes and lipid factors. Eye and Vision (London, England), 3(1). https://doi.org/10.1186/S40662-016-0063-5
[2] Rajesh, G., Raajini, X.M., Sagayam, K.M., Dang, H. (2020). A statistical approach for high order epistasis interaction detection for prediction of diabetic macular edema. Informatics in Medicine Unlocked, 20: 100362. https://doi.org/10.1016/J.IMU.2020.100362
[3] Nguyen, Q.D., Shah, S.M., Van Anden, E., Sung, J.U., Vitale, S., Campochiaro, P.A. (2004). Supplemental oxygen improves diabetic macular edema: A pilot study. Investigative Ophthalmology & Visual Science, 45(2): 617-24. https://doi.org/10.1167/IOVS.03-0557
[4] Atteia, G., Samee, N.A., Hassan, H.Z. (2021). DFTSA-Net: Deep feature transfer-based stacked autoencoder network for DME diagnosis. Entropy, 23(10): 1251. https://doi.org/10.3390/E23101251
[5] Grossniklaus, H.E., Green, W.R. (2004). Choroidal neovascularization. American Journal of Ophthalmology, 137(3): 496-503. https://doi.org/10.1016/J.AJO.2003.09.042.
[6] Rishi, P., Gupta, A., Rishi, E., Shah, B.J. (2013). Choroidal neovascularization in 36 eyes of children and adolescents. Eye, 27(10): 1158-68. https://doi.org/10.1038/eye.2013.155
[7] Spaide, R.F. (1999). Choroidal neovascularization in younger patients. Current Opinion in Ophthalmology, 10(3).
[8] Schlanitz, F.G., Ahlers, C., Sacu, S., Schütze, C., Rodriguez, M., Schriefl, S. (2010). Performance of drusen detection by spectral-domain optical coherence tomography. Investigative Ophthalmology & Visual Science, 51(12): 6715-6721. https://doi.org/10.1167/IOVS.10-5288
[9] Raza, G., Rafique, M., Tariq, A., Akram, M.U. (2013). Hybrid classifier based drusen detection in colored fundus images. In 2013 IEEE Jordan Conference on Applied Electrical Engineering and Computing Technologies, Amman, Jordan, pp. 1-5. https://doi.org/10.1109/AEECT.2013.6716473
[10] Ren, X., Zheng, Y., Zhao, Y., Luo, C., Wang, H., Lian, J. (2017). Drusen segmentation from retinal images via supervised feature learning. IEEE Access, 6: 2952-2961. https://doi.org/10.1109/ACCESS.2017.2786271
[11] Kaymak, S., Serener, A. (2018). Automated age-related macular degeneration and diabetic macular edema detection on OCT images using deep learning. In Proceedings - 2018 IEEE 14th International Conference on Intelligent Computer Communication and Processing, ICCP, Cluj-Napoca, Romania, pp. 265-269. https://doi.org/10.1109/ICCP.2018.8516635
[12] Fang, L., Wang, C., Li, S., Rabbani, H., Chen, X., Liu, Z. (2019). Attention to lesion: Lesion-Aware convolutional neural network for retinal optical coherence tomography image classification. IEEE Transactions on Medical Imaging, 38(8): 1959-1970. https://doi.org/10.1109/TMI.2019.2898414
[13] Rong, Y., Xiang, D., Zhu, W., Yu, K., Shi, F., Fan, Z., Chen, X.J. (2019). Surrogate-assisted retinal OCT image classification based on convolutional neural networks. IEEE Journal of Biomedical and Health Informatics, 23(1): 253-263. https://doi.org/10.1109/JBHI.2018.2795545
[14] Rastogi, Di., Padhy, R.P., Sa, P.K. (2019). Detection of retinal disorders in optical coherence tomography using deep learning. In 2019 10th International Conference on Computing, Communication and Networking Technologies, Kanpur, India, pp. 1-7. https://doi.org/10.1109/ICCCNT45670.2019.8944406
[15] Li, F., Chen, H., Liu, Z., Zhang, X., Jiang, M., Jiang, M., Wu, Z.Z., Zhou, K.Q. (2019). Deep learning-based automated detection of retinal diseases using optical coherence tomography images. Biomedical Optics Express, 10(12): 6204-6226. https://doi.org/10.1364/BOE.10.006204
[16] Shih, F.Y., Patel, H. (2020). Deep learning classification on optical coherence tomography retina images. International Journal of Pattern Recognition and Artificial Intelligence, 34(8). https://doi.org/10.1142/S0218001420520023
[17] Adel, A., Soliman, M.M., Khalifa, N.E.M., Mostafa, K. (2020). Automatic classification of retinal eye diseases from optical coherence tomography using transfer learning. In 16th International Computer Engineering Conference, Cairo, Egypt, pp. 37-42. https://doi.org/10.1109/ICENCO49778.2020.9357324
[18] Berrimi, M., Moussaoui, A. (2020). Deep learning for identifying and classifying retinal diseases. In 2020 2nd International Conference on Computer and Information Sciences, Sakaka, Saudi Arabia, pp. 1-6. https://doi.org/10.1109/ICCIS49240.2020.9257674
[19] Gupta, R., Tripathi, V., Gupta, A. (2021). An efficient model for detection and classification of internal eye diseases using deep learning. In 2021 International Conference on Computational Performance Evaluation (ComPE), Shillong, India, pp. 45-53. https://doi.org/10.1109/COMPE53109.2021.9752188
[20] Saleh, N., Abdel Wahed, M., Salaheldin, A.M. (2022). Transfer learning-based platform for detecting multi-classification retinal disorders using optical coherence tomography images. International Journal of Imaging Systems and Technology, 32(3): 740-752. https://doi.org/10.1002/IMA.22673
[21] Loukovaara, S., Gucciardo, E., Repo, P., Vihinen, H., Lohi, J., Jokitalo, E., Salven, P., Lehti, K. (2015). Indications of lymphatic endothelial differentiation and endothelial progenitor cell activation in the pathology of proliferative diabetic retinopathy. Acta ophthalmologica, 93(6): 512-523. https://doi.org/10.1111/AOS.12741
[22] Roy, N.D., Biswas, A. (2019). Early detection of proliferative diabetic retinopathy in neovascularization at the disc by observing retinal vascular structure. Lecture Notes in Computational Vision and Biomechanics, 30: 1441-1450. https://doi.org/10.1007/978-3-030-00665-5_134
[23] Wong, W.L., Su, X., Li, X., Cheung, C.M.G., Klein, R., Cheng, C.Y.,Wong, T.Y. (2014). Global prevalence of age-related macular degeneration and disease burden projection for 2020 and 2040: A systematic review and meta-analysis. The Lancet. Global Health, 2(2). https://doi.org/10.1016/S2214-109X(13)70145-1
[24] Ciulla, T.A., Amador, A.G., Zinman, B. (2003). Diabetic Retinopathy and Diabetic Macular EdemaPathophysiology, screening, and novel therapies. Diabetes Care, 26(9): 2653-64. https://doi.org/10.2337/DIACARE.26.9.2653
[25] Crabb, J.W., Miyagi, M., Gu, X., et al. (2002). Drusen proteome analysis: An approach to the etiology of age-related macular degeneration. Proceedings of the National Academy of Sciences of the United States of America, 99(23): 14682. https://doi.org/10.1073/PNAS.222551899
[26] Farsiu, S., Chiu, S.J., O’Connell, R. V., Folgar, F.A., Yuan, E., Izatt, J.A., Toth, C.A. (2014). Quantitative classification of eyes with and without intermediate age-related macular degeneration using optical coherence tomography. Ophthalmology, 121(1): 162. https://doi.org/10.1016/J.OPHTHA.2013.07.013
[27] Yavuz, Z., İkibaş, C., Şevik, U., Köse, C. (2009). Retinal Görüntülerde Optik Diskin Otomatik Olarak Çıkartılması için Bir yöntem. 5. Uluslararası İleri Teknolojiler Sempozyumu, IATS’09.
[28] Peng, Y., Dharssi, S., Chen, Q., Keenan, T.D., Agrón, E., Wong, W.T., Lu, Z. (2019). DeepSeeNet: A deep learning model for automated classification of patient-based age-related macular degeneration severity from color fundus photographs. Ophthalmology, 126(4): 565. https://doi.org/10.1016/J.OPHTHA.2018.11.015
[29] Huang, D., Swanson, E.A., Lin, C.P., et al. (1991). Optical coherence tomography. Science (New York, N.Y.), 254(5035): 1178. https://doi.org/10.1126/SCIENCE.1957169
[30] Gabriele, M.L., Wollstein, G., Ishikawa, H., Kagemann, L., Xu, J., Folio, L.S., Schuman, J.S. (2011). Optical coherence tomography: History, current status, and laboratory work. Investigative Ophthalmology & Visual Science, 52(5): 2425. https://doi.org/10.1167/IOVS.10-6312
[31] Kermany, D.S., Goldbaum, M., et al. (2018). Identifying medical diagnoses and treatable diseases by image-based deep learning. Cell, 172(5): 1122-1131.e9. https://doi.org/10.1016/J.CELL.2018.02.010
[32] Yılmaz, Y., Koytak, A., Kurnaz, E., Erol, K., Çınar, Y., Özertürk, Y. (2006). Fundus fluorescein angiography in primary open-angle glaucoma. Southern Clinics of Istanbul Eurasia, 17(1): 1-5.
[33] Lu, W., Tong, Y., Yu, Y., Xing, Y., Chen, C., Shen, Y. (2018). Deep learning-based automated classification of multi-categorical abnormalities from optical coherence tomography images. Translational Vision Science & Technology, 7(6): 41-41. https://doi.org/10.1167/TVST.7.6.41
[34] De Fauw, J., Ledsam, J.R., Romera-Paredes, B., et al. (2018). Clinically applicable deep learning for diagnosis and referral in retinal disease. Nature Medicine, 24(9): 1342-1350. https://doi.org/10.1038/s41591-018-0107-6
[35] Saha, S., Nassisi, M., Wang, M., Lindenberg, S., kanagasingam, Y., Sadda, S., Hu, Z.J. (2019). Automated detection and classification of early AMD biomarkers using deep learning. Scientific Reports, 9(1): 1-9. https://doi.org/10.1038/s41598-019-47390-3
[36] Wang, J., Hormel, T.T., Gao, L., Zang, P., Guo, Y., Wang, X., Bailey, S.T., Jia, Y. (2020). Automated diagnosis and segmentation of choroidal neovascularization in OCT angiography using deep learning. Biomedical Optics Express, 11(2): 927-944. https://doi.org/10.1364/BOE.379977
[37] Sunija, A.P., Gopi, V.P., Palanisamy, P. (2022). Redundancy reduced depthwise separable convolution for glaucoma classification using OCT images. Biomedical Signal Processing and Control, 71: 103192. https://doi.org/10.1016/J.BSPC.2021.103192
[38] Elsharkawy, M., Sharafeldeen, A., Soliman, A., Khalifa, F., Ghazal, M., El-Daydamony, E., Atwan, A., Sandhu, H.S., El-Baz, A. (2022). A novel computer-aided diagnostic system for early detection of diabetic retinopathy using 3D-OCT higher-order spatial appearance model. Diagnostics, 12(2): 461. https://doi.org/10.3390/DIAGNOSTICS12020461
[39] Chan, G.C.Y., Kamble, R., Muller, H., Shah, S.A.A., Tang, T.B., Meriaudeau, F. (2018). Fusing results of several deep learning architectures for automatic classification of normal and diabetic macular edema in optical coherence tomography. In Proceedings of the Annual International Conference of the IEEE Engineering in Medicine and Biology Society, EMBS, Honolulu, HI, USA, 670-673. https://doi.org/10.1109/EMBC.2018.8512371
[40] Perdomo, O., Otalora, S., Gonzalez, F.A., Meriaudeau, F., Muller, H. (2018). OCT-NET: A convolutional network for automatic classification of normal and diabetic macular edema using SD-OCT volumes. International Symposium on Biomedical Imaging, Washington, DC, USA, pp. 1423-1426. https://doi.org/10.1109/ISBI.2018.8363839
[41] Vahadane, A., Joshi, A., Madan, K., Dastidar, T.R. (2018). Detection of diabetic macular edema in optical coherence tomography scans using patch based deep learning. International Symposium on Biomedical Imaging, Washington, DC, USA, pp. 1427-1430. https://doi.org/10.1109/ISBI.2018.8363840
[42] Jin, K., Yan, Y., Chen, M., Wang, J., Pan, X., Liu, X., Liu, M.S., Lou, L.X., Wang, Y., Ye, J. (2022). Multimodal deep learning with feature level fusion for identification of choroidal neovascularization activity in age-related macular degeneration. Acta Ophthalmologica, 100(2): e512-e520. https://doi.org/10.1111/AOS.14928
[43] Daghistani, T. (2022). Using artificial intelligence for analyzing retinal images (OCT) in people with diabetes: Detecting diabetic macular edema using deep learning approach. Transactions on Machine Learning and Artificial Intelligence, 10(1): 41-49. https://doi.org/10.14738/TMLAI.101.11805
[44] Hwang, D.K., Hsu, C.C., Chang, K.J., et al. (2019). Artificial intelligence-based decision-making for age-related macular degeneration. Theranostics, 9(1): 232. https://doi.org/10.7150/THNO.28447
[45] Yan, Y., Jin, K., Gao, Z., Huang, X., Wang, F., Wang, Y., Ye, J. (2021). Attention-based deep learning system for automated diagnoses of age-related macular degeneration in optical coherence tomography images. Medical Physics, 48(9): 4926-4934. https://doi.org/10.1002/MP.15002
[46] Chen, Y.H., Krishna, T., Emer, J.S., Sze, V. (2017). Eyeriss: An energy-efficient reconfigurable accelerator for deep convolutional neural networks. IEEE Journal of Solid-State Circuits, 52(1): 127-138. https://doi.org/10.1109/JSSC.2016.2616357
[47] Salamon, J., Bello, J.P. (2017). Deep convolutional neural networks and data augmentation for environmental sound classification. IEEE Signal Processing Letters, 24(3): 279-283. https://doi.org/10.1109/LSP.2017.2657381
[48] Bakr, M.A.H.A., Al-Attar, H.M., Mahra, N.K., Abu-Naser, S.S. (2020). Breast cancer prediction using JNN. International Journal of Academic Information Systems Research, 4: 1-8.
[49] Barhoom, A.M., Khalil, A.J., Abu-Nasser, B.S., Musleh, M.M., Abu-Naser, S.S. (2019). Predicting titanic survivors using artificial neural network. International Journal of Academic Engineering Research, 3(9): 8-12.
[50] Belbeisi, H.Z., Al-Awadi, Y.S., Abbas, M.M., Abu-Naser, S.S. (2020). Effect of oxygen consumption of thylakoid membranes (chloroplasts) from spinach after inhibition using JNN. International Journal of Academic Health and Medical Research, 4(11): 1-7.
[51] Dalffa, M.A., Abu-Nasser, B.S., Abu-Naser, S.S. (2019). Tic-Tac-Toe learning using artificial neural networks. International Journal of Engineering and Information Systems (IJEAIS), 3(2): 9-19.
[52] Dheir, I.M., Mettleq, A.S.A., Elsharif, A.A., Abu-Naser, S.S. (2019). Classifying nuts types using convolutional neural network. International Journal of Academic Information Systems Research, 3(12): 12-18.
[53] Jamal Dawood, K., Hussam Zaqout, M., Mohammed Salem, R., Abu-Naser, S.S. (2020). Artificial neural network for mushroom prediction. International Journal of Academic Information Systems Research, 4: 9-17.
[54] He, K., Zhang, X., Ren, S., Sun, J. (2016). Deep residual learning for image recognition. In IEEE Conference on Computer Vision and Pattern Recognition (CVPR), Las Vegas, NV, USA, pp. 770-778. https://doi.org/10.1109/CVPR.2016.90
[55] Szegedy, C., Liu, W., Jia, Y., Sermanet, P., Reed, S., Anguelov, D., Erhan, D., Vanhoucke, V., Rabinovich, A. (2015). Going deeper with convolutions; Going deeper with convolutions. https://doi.org/10.48550/arXiv.1409.4842
[56] Szegedy, C., Vanhoucke, V., Ioffe, S., Shlens, J. (2016). Rethinking the inception architecture for computer vision; rethinking the inception architecture for computer vision. In 2016 IEEE Conference on Computer Vision and Pattern Recognition, Las Vegas, NV, USA, pp. 2818-26. https://doi.org/10.1109/CVPR.2016.308
[57] Peng, C., Liu, Y., Yuan, X., Chen, Q. (2022). Research of image recognition method based on enhanced inception-ResNet-V2. Deep Pattern Discovery for Big Multimedia Data, 81: 34345-34365. https://doi.org/10.1007/s11042-022-12387-0
[58] Howard, A.G., Zhu, M., Chen, B., Kalenichenko, D., Wang, W., Weyand, T., Andreetto, M., Adam, H. (2017). MobileNets: Efficient convolutional neural networks for mobile vision applications. https://doi.org/10.48550/arXiv.1704.04861
[59] Liu, X., Jia, Z., Hou, X., Fu, M., Ma, L. (2019). Real-time marine animal images classification by embedded system based on mobilenet and transfer learning. OCEANS 2019 - Marseille, Marseille, France, pp. 1-5. https://doi.org/10.1109/OCEANSE.2019.8867190
[60] Chen, W.C., Liu, P.Y., Lai, C.C., Lin, Y.H. (2022). Identification of environmental microorganism using optimally fine-tuned convolutional neural network. Environmental Research, 206. https://doi.org/10.1016/J.ENVRES.2021.112610
[61] Huang, G., Liu, Z., Van Der Maaten, L., Weinberger, K.Q. (2017). Densely connected convolutional networks. In Conference on Computer Vision and Pattern Recognition (CVPR), pp. 4700-1708.
[62] Lu, T., Han, B., Chen, L., Yu, F., Xue, C. (2021). A generic intelligent tomato classification system for practical applications using DenseNet-201 with transfer learning. Scientific Reports, 11(1): 1-8. https://doi.org/10.1038/s41598-021-95218-w
[63] Chollet, F. (2017). Xception: deep learning with depthwise separable convolutions. In 2017 IEEE Conference on Computer Vision and Pattern Recognition (CVPR), Honolulu, HI, USA, pp. 1800-1807. https://doi.org/10.1109/CVPR.2017.195
[64] Tan, M., Le, Q.V. (2019). EfficientNet: Rethinking model scaling for convolutional neural networks. In 36th International Conference on Machine Learning, ICML 2019, pp. 10691-700. https://doi.org/10.48550/arxiv.1905.11946
[65] Sandler, M., Howard, A., Zhu, M., Zhmoginov, A., Chen, L.C. (2018). MobileNetV2: Inverted residuals and linear bottlenecks. arXiv:1801.04381. https://doi.org/10.48550/arxiv.1801.04381
[66] Tan, M., Le, Q.V. (2021). EfficientNetV2: Smaller models and faster training. https://doi.org/10.48550/arxiv.2104.00298
[67] Zaheer, R., Shaziya, H. (2019). A study of the optimization algorithms in deep learning. In Proceedings of the 3rd International Conference on Inventive Systems and Control, ICISC 2019, Coimbatore, India, pp. 536-539. https://doi.org/10.1109/ICISC44355.2019.9036442
[68] Yi, D., Ahn, J., Ji, S. (2020). An effective optimization method for machine learning based on ADAM. Applied Sciences, 10(3): 1073. https://doi.org/10.3390/APP10031073
[69] Truong, T.X., Nhu, V.H., Phuong, D.T.N., Nghi, L.T., Hung, N.N., Hoa, P.V., Bui, D.T. (2023). A new approach based on tensorflow deep neural networks with ADAM optimizer and GIS for spatial prediction of forest fire danger in tropical areas. Remote Sensing, 15(14): 3458. https://doi.org/10.3390/RS15143458
[70] Lakshmi, L., Reddy, M.P., Santhaiah, C., Reddy, U.J. (2021). Smart phishing detection in web pages using supervised deep learning classification and optimization technique ADAM. Wireless Personal Communications, 118(4): 3549-64. https://doi.org/10.1007/S11277-021-08196-7/FIGURES/8
[71] Saranya, P., Pranati, R., Patro, S.S. (2023). Detection and classification of red lesions from retinal images for diabetic retinopathy detection using deep learning models. Multimedia Tools and Applications, 1-21. https://doi.org/10.1007/S11042-023-15045-1/FIGURES/11
[72] Vij, R., Arora, S. (2023). A novel deep transfer learning based computerized diagnostic systems for multi-class imbalanced diabetic retinopathy severity classification. Multimedia Tools and Applications, 82(22): 34847-84. https://doi.org/10.1007/S11042-023-14963-4/TABLES/10