Jian-Da Wu*![]() | Yu-Hung Huang
| Yu-Hung Huang![]()
© 2023 IIETA. This article is published by IIETA and is licensed under the CC BY 4.0 license (http://creativecommons.org/licenses/by/4.0/).
OPEN ACCESS
In the rapidly evolving automobile industry, the safety and quality of individual vehicle components have gained paramount importance. Among these, aluminum wheels are particularly critical, given their susceptibility to internal casting defects. This study presents a novel approach to identify these defects non-destructively, employing X-ray inspection and harnessing the power of YOLO (You Only Look Once) object detection. Images of vehicle aluminum wheels were obtained via X-ray inspection, revealing the presence of internal defects. Subsequently, a periodic noise elimination algorithm, underpinned by morphological filtering and adaptive image processing weights, was utilized to enhance the image clarity. The application of a composite cascade filter further improved the image resolution. The enhanced images were then processed using YOLO object detection, a cutting-edge technology renowned for its precision in object detection tasks. This study explores the efficacy of different YOLO model architectures in detecting and identifying internal casting defects in aluminum wheels. Our research contributes to the development of a highly accurate system for the detection of internal casting defects in vehicle wheels, offering potential improvements in vehicle safety. This methodology, pairing X-ray inspection with advanced object detection algorithms, provides a robust approach for defect identification in the production process, laying the groundwork for future advancements in vehicle component quality control.
vehicle, aluminum wheel, X-ray defect detection, deep learning, YOLO object detection
The primary method of vehicle aluminum wheel production is casting, favored for its simplicity, cost-effectiveness, and suitability for mass production [1]. Aluminum wheels, aside from meeting aesthetic requirements, offer significant benefits such as lightweight and weight reduction, contributing to reduced carbon emissions and material savings. This has led to their widespread adoption over traditional steel wheels. However, the casting process is prone to internal defects during the filling and solidification stages, including casting holes, cracks, and sponge casting holes, which compromise the quality and functionality of the wheels.
Non-Destructive Testing (NDT) systems have become critically important in the casting production process, enhancing manufacturing capability while improving inspection accuracy [2-6]. Among various NDT methods, X-ray inspection, particularly digital radiography (DR), is prevalently used in the inspection of vehicle cast aluminum wheels due to its cost-effectiveness and efficiency [7-9].
Historically, X-ray inspection for defect identification in vehicle cast aluminum wheels has been widely researched and developed. Numerous computer X-ray inspection defect segmentation methodologies have been proposed, such as video-tracking-based wheel defect detection [8], wavelet technology applications for casting defect automatic detection [10], and adaptive threshold and morphological reconstruction for aluminum alloy wheel radiographic image defect measurement [11]. While these methods have achieved satisfactory recognition rates for defects, they are complex and time-consuming compared to the YOLO (You Only Look Once) object detection methodology used in this study.
Drawing parallels from the medical field, convolutional neural networks and directed gradient Histograms have been used to detect and classify diseases from X-ray images [12]. Similarly, RYOLO v4-tiny deep learning has been applied for detecting and classifying pneumonia in CT scans and X-ray images [13]. These methods underscore the applicability of YOLO deep learning object detection in X-ray image detection across various industrial domains.
The advent of enhanced hardware computing power has significantly accelerated computational speed, rendering the feature extraction and data computation of large image samples manageable. Artificial neural networks (ANN) [14] and convolutional neural networks (CNN) [15-17] are both have achieved good results in the computer vision field. This has led to the development of artificial intelligence and deep learning for identification and practical application in various related industries. The common object detection methods are the R-CNN series [18, 19], the SSD series [20-22], and the YOLO series [23-26]. The YOLO algorithm was proposed by Redmon et al. [23] in 2016. It is a neural network-like algorithm for object detection. The YOLO algorithm is optimized by continuous model improvement.
In this study, X-ray inspection equipment was employed to inspect vehicle aluminum wheels, capturing images of the casting defects. These images were then processed using a periodic noise elimination algorithm based on weighted adaptive morphology and a composite cascade filter, followed by the application of different YOLO target detection architectures. The best recognition effect and weight block output were obtained and subsequently tested using a Raspberry Pi 4 to achieve the desired identification results.
This study aims to develop a simple, fast, and high-precision automatic identification system for internal defects, thereby assisting inspectors on the production line and mitigating potential customer safety risks and product variations. The results indicate that this system, combined with the optimized YOLO weight output and the casting defect identification on Raspberry Pi 4, can successfully identify and distinguish various types of internal defects, providing an audible alert and visual signal to prompt quality attention and improvement.
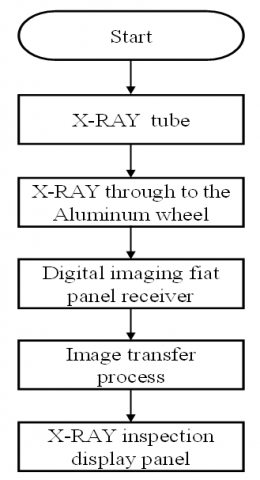
To achieve lighter vehicle weight, reduce energy cost and fuel consumption, aluminum alloy wheels have become the mainstream choice. Automotive aluminum wheel manufacturing technology can be divided into two technologies: “casting” and “forging”. Casting technology can be divided into gravity casting, low-pressure casting, high-pressure casting, etc. according to the production pressure. The vehicle aluminum wheels used in this study were made using the low-pressure casting method [27]. The vehicle aluminum wheel production process is shown in Figure 1 [28]. Before the qualified wheels are sold, they are subjected to relevant safety tests in accordance with regulations. Structural strength tests and external environmental tests are conducted to ensure the wheel does not have structural strength problems and appearance corrosion problems. To ensure that there are no internal organizational problems and to guarantee the wheel structural strength integrity, it is necessary to use X-ray NDT for vehicle aluminum wheel quality inspection.
X-ray non-destructive testing (DR) equipment was used in this study to collect casting defect samples. As shown in Figures 2 and 3, the X-ray inspection process is as follows: X-ray NDT is performed by X-ray tubes with high voltage electricity and a controller to emit X-rays. Then the X-rays penetrate and irradiate the aluminum wheel casting. Different aluminum wheel casting thicknesses were X-rayed and sent to a digital image plate receiver, and image processing was performed real time on an industrial monitor. The image was then converted into a pixel image on the inspection screen. This pixel image shows the quality organization of each part inside the aluminum wheel casting. Finally, the image can be clearly seen by a professional X-ray inspector to directly detect and determine the casting defects. This study also captured three types and samples of casting defects that appear most frequently in the production line for follow-up training and verification. These routine defects are casting holes (ch), cracks (cr), and sponge casting holes (sch). The X-ray inspection technology provides accurate test results without causing any damage to the inspection object.
Figure 1. Vehicle aluminum wheel production flow chart
Figure 2. X-ray inspection process and equipment diagram
Figure 3. X-ray inspection flow chart
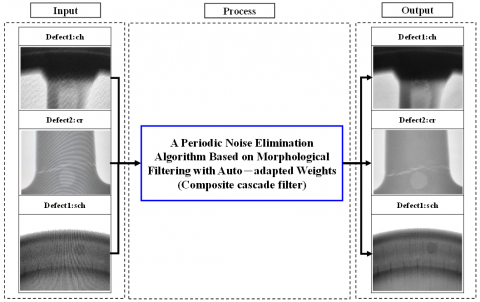
The aluminum wheel undergoes X-ray non-destructive inspection. During the image capture process, due to the mutual computer and camera frequency interference, interference ripples will be generated. The shapes include horizontal lines, straight lines and amplitude shapes. These interference ripples are called “Moore fringes” “(Moiré Pattern)”. There are interference removal methods used in the past [29], but this study used adaptive weight morphological filtering. The periodic noise removal algorithm based on the “Composite Cascade Filter” is used for image denoising and optimization [30]. The defect sample image with moiré fringes was selected first, imported into the image sample, and denoised using a composite cascade filter. The results show that after denoising the defect sample image, the moiré fringe can be removed to optimize the image. The YOLO v4 training and testing results show that the defective sample denoised image can significantly help and improve its recognition rate. The defective sample images collected in the future will use this “composite-level series-parallel filter” method for denoising and optimization to achieve the optimized YOLO training and recognition rate. The relevant principles are as follows. The input image is (x) and the cascade filtering result through the structural elements of a certain shape is fi(x), i=1, 2, ...., n. The output image is F(x). Among them, the structural elements determine the weights through the adaptive algorithm shown in the formula α1, α2, ...... αn, shown as Eq. (1):
$F(x)=\sum_{\mathrm{i}=0}^{\mathrm{n}} \alpha_i f_i(x)$ (1)
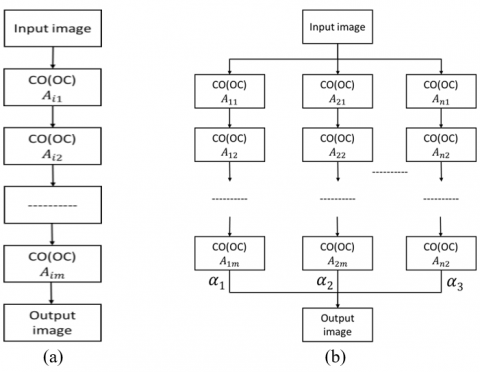
When the digital image is denoised using mathematical type filtering, it is possible to use structural elements with dimensions from small to large for processing. Therefore, selecting a series filter for image filtering shape-filters the image by structuring elements of the same shape in ascending order of dimension. This is similar to the series circuit design process, as shown in Figure 4 (a). In addition, the series filters formed by the above structural elements from different shapes can also be connected in parallel and combined with an adaptive weight algorithm to construct a series-parallel composite filter, as shown in Figure 4 (b). The image optimization and denoised process and results are shown in Figure 5.
The neural network is a neural network formed by simulating biological nerve conduction and interconnected by multiple layers of neurons. In the artificial neural network, the neurons in each layer have input and output, and the activation function [31] is when the data is input from the neuron and the output is sent through a linear activation function transmitted to the next neuron up to the final output layer. The activation function allows the neural network to have sufficient ability to capture complex features, thereby improving the model efficiency and the artificial neural network composition. When we input a picture of size 512*512, the input layer of the first layer has 262,144 neurons. The input passes through multiple hidden layers, according to the number of categories to be identified and how many are output in the output layer. Neurons, where the depth of the model is determined by the number of hidden layers. It can be seen from the above that the artificial neural network has two main shortcomings. The first is that it requires a lot of memory. The second is that it is difficult to obtain the characteristics of each part of the object in the image because the input is judged by a single pixel. In the image interpretation, the artificial neural network accuracy is not outstanding.
Figure 4. Series filter (a) and composite cascade filter (b) flow chart
The convolutional neural network (CNN) is one of the feedforward neural networks, which is often used in the image recognition field. The biggest rolling machine neural network feature is that it can use color, texture, light source, and image size as the neural network input features [32, 33]. In recent years, it has been practically applied to safety detection and epidemic prevention reminders in daily life [34]. When an image is input, the data contains three-dimensional information such as color, horizontal and vertical position. The traditional deep learning network input image is one-dimensional data, in which the traditional artificial neural network easily ignores the image shape during training. The recognition effect is therefore reduced and the convolutional neural network is not like the traditional artificial neural network, which simply extracts data for operation. The convolutional neural network has two more convolutional layers and pooling layers than the traditional artificial neural network. The convolutional neural network includes the first layer-the convolutional layer and the second layer-the pooling layer and a third layer-the fully connected layer (traditional artificial neural network), through feature extraction and system operation output classification results.
Figure 5. Image denoising optimization process
The convolutional layer function extracts the features in the image. The image features are extracted through a matrix of size N*N. The matrix of size N*N is used to read the input image from top to bottom and produce the inner product. The matrix then calculates and obtains each local feature in the image as the input for the next layer. A 3*3 matrix reads input image sequentially from top to bottom. If the step size is set to 1, the input image features will be obtained. The convolutional layer is characterized by preserving the structure of the photo and extracting features from it.
The pooling layer function reduces the input image size to reduce the feature map of each image and retain the important features. There are three pooling layer advantages. First, it reduces the parameters required for the subsequent layers and speeds up the system efficiency. Second, when some pixels in the image have small offsets or differences in neighboring regions, it has little effect on the pooling layer output. Third, the pooling layer can reduce overfitting occurrence. Like the convolutional layer, the pooling layer also inputs a matrix of size N*N into the image and reads the input image sequentially from top to bottom to extract the values of each area and perform operations. There are three methods used by the pooling layer to reduce the image size, namely maximize, average and random. Taking maximization as an example, a 2*2 matrix is used to set the step size to 2, and read the image from top to bottom and take out the maximum value for each area. In the end, in addition to getting a reduced size image, all of the important feature information is retained.
Object Detection technology is composed of three different algorithms: Object Localization, Feature Extraction, and Image Classification. In the YOLO object detection algorithm series, with the improved version update, the network architecture is also optimized. YOLOv1 was first proposed by Redom et al. in the United States in 2015 [23]. The disadvantage of YOLOv1 is that the recall rate is very low and many small targets are easily missed. In 2016 YOLOv2 was launched. After strengthening, YOLOv2 was able to detect more than 9000 categories, so YOLOv2 can also be called YOLO 9000 [24]. In 2018 YOLOv3 was launched [25]. YOLOv3 features a pyramid network that improves small object detection ability, and the output uses NMS to select the most suitable one among multiple bounding box results as the output. YOLOv4 was jointly developed in 2020 by Liao Hongyuan Distinguished Researcher, Postdoctoral Researcher Wang Jianyao and Russian developer A. Bochkovskiy of the Institute of Information Science, Taiwan Academia Sinica [35]. The YOLOv4 network architecture has a skeleton divided into four parts: CSP Darknet-53, SPP, PANet, and Detection Head. CSPDarknet-53 consists of two architectures, Darknet-53 and Cross-Stage Partial Network (CSPNet), which are used as the base network architecture. This study uses YOLOv5. The network architecture diagram is shown in Figure 6. YOLOv5 is the latest YOLO detection method, proposed by Nepal et al. [36, 37]. The YOLOv5 uses CSPdarknet53 as the backbone and the Focus structure, which consists of modules such as Conv, C3, and Spatial Pyramid Pooling (SPP). The difference between YOLOv5 and previous versions is that it uses PyTorch instead of the YOLOv4 and YOLOv3 Darknet. The neck network also uses Feature Pyramid Network (FPN) and Pixel Aggregation Network (PAN) [36, 37]. In the YOLOv5 model architecture there are four different parameter structures, namely s, m, l, and x, which represent the sizes Small, Medium, Large, and Extra-large. Each of its model architectures has different parameters applied to control the depth and width of the network [38]. As shown in Figure 7, the Focus layer was first introduced in YOLOv5, and the Focus layer replaced the first three layers in the YOLOv3 algorithm. The advantage of using the Focus layer is that it reduces the required CUDA memory, reduces the number of layers and increases forward propagation and backpropagation. The focus module divides the input data into four parts, each of which is equivalent to two down samplings [39]. Furthermore, the head in YOLOv5 is the same as in YOLOv4 and YOLOv3, generating three different feature map outputs for multi-scale prediction. It also helps to effectively enhance predictions for small to large objects in the model.
Figure 6. Network architecture diagram of YOLOv5
Figure 7. Focus slice operation diagram
YOLOv4 and YOLOv5 used four output coordinates in the grid unit which are tx, ty, tw, and th of the frame. Eqs. (2) to (5) calculate the offset value of the corresponding grid from the upper left corner of the bounding box relative to the center point, Cx and Cy are relative to the upper left corner. When tx and ty are calculated, the offset between 0 and 1 will be output. After adding the output offset to Cx and Cy, the center point border position will be obtained. The pw and ph of the dashed box are called the width and height of the preset box. After calculating with tw, th, pw, and ph, the predicted width and height will be called bw and bh.
$b_x=\sigma\left(t_x\right)+c_x$ (2)
$b_x=\sigma\left(t_x\right)+c_x$ (3)
$b_w=p_w e^{t_w}$ (4)
$b_h=p_h e^{t_h}$ (5)
Intersection over union (IoU) is a criterion for detection accuracy. Many object detections use this standard as a reference for accuracy. In order for IoU to detect objects of any size and shape, a ground-truth bounding box and a predicted bounding box are required. In the IoU calculation method the solid line is the real bounding box and the dashed line is the predicted bounding box. The real bounding box and predicted bounding box intersection are divided by the real bounding box and predicted bounding box union, called IoU. When the IoU value is close to 1, it means that the predicted situation conforms more to a real situation.
The confusion matrix method is used as an important quality benchmark for evaluating model training and flaw identification. This method is called a binary confusion matrix, which contains four elements: TP (True Positive), TN (True Negative), FP (False Positive), FN (False Negative). First, TP is the system correctly predicting a successful positive sample. For example, in an image classifier that predicts whether it is a casting defect ch, the image label that successfully classifies the casting defect ch as ch is called TP. Second, TN is the negative sample for which the system correctly predicts success. In the example above, a picture of casting flaw ch is successfully marked as not ch, called TN. Third, FP is when the system misjudges that it is a positive sample, but it is actually a negative sample. For example, a picture with a casting defect ch is incorrectly labeled and classified as a casting defect cr. Ultimately, FN is a negative sample in which the system misjudges (or a positive sample that the system cannot predict), e.g., the system incorrectly marks a picture with a casting defect ch as not a casting defect ch. According to the above explanation, the system model training and defect identification results are better if the TP and TN values are large. The Confusion matrix is shown in Table 1. If you want to look at these values directly, it is difficult to see at a glance whether a defect classification model is good or bad. This study also used recall (RR), precision (PR), F1-score and mAP to evaluate the model quality. After the program calculation, TP, TN, FP, FN can get a variety of different indicators. PR(Precision) represents the ratio of the number of correct recognizers detected by the system to the number of all recognizers detected by the system. RR(Recall) is the ratio of the number of correct recognizers detected by the system to the actual number of recognizers. The F1-score is the Average of weighted and reconciled PR and RR, mAP is calculated by taking the average precision (AP) of all classes. The formulas for PR, RR, F1-score and mAP calculation methods are shown in Eqs. (6)-(9).
$P R(Precision)=\frac{T P}{T P+F P}$ (6)
$R R(Recall)=\frac{T P}{T P+F N}$ (7)
$F 1 score =\frac{2 \cdot P R \cdot R R}{P R+R R}$ (8)
$m A P=\sum_{q=1}^Q \frac{A v e P(q)}{Q}$ (9)
Table 1. Illustration of confusion matrix
|
|
True Condition |
||
|
Positive |
Negative |
||
|
Predicted Condition |
Positive |
TP |
FP |
|
Negative |
FN |
TN |
|
The development environment used in this study, as shown in Table 2, is the X-ray non-destructive inspection equipment used to capture the image samples for aluminum wheel internal casting defects. As shown in Table 3, during YOLO training, GTX 1060 is used as the training system operation cire, which improves the system operation speed during training, trains and calculates six YOLO models with different architectures, and creates the final training database at the same time. However, in the external system test, since this research is expected to be applied to the actual casting production process, the small and light Raspberry pi 4 microprocessor will be the first choice for this experimental research system and will be used the Raspberry pi NoIR Camera v2. The original Raspberry pi factory night vision camera was also used to capture X-ray inspection images for internal casting defects.
Table 2. The environment of the X-ray inspection equipment
|
Inspection Cabinet |
Lead Made Inspection Cabinet (Avoid Radiation Leakage) |
|
High frequency high voltage generator |
BOSELLO XRG 160 |
|
X-ray controller |
BOSELLO XRC 600 |
|
Maximum power |
640W |
|
Maximum voltage |
160kV |
|
Maximum current |
10mA |
|
Focal spot |
2×0.4×0.4mm |
|
X-ray video chain |
image intensifier+ccd camera+coax cable+b/w monitor |
|
Control console |
industrial personal computer (Microsoft Windows® 2000) |
Table 3. The environment of the training computer and Raspberry pi 4
|
Training computer |
OS |
Windows 10 |
|
CPU |
AMD R5 2600 Six-Core 3.4GHz |
|
|
GPU |
GeForce GTX1060 6G |
|
|
Raspberry pi 4 |
OS |
Ubuntu 20.04 LTS |
|
CPU |
Quard-Core Cortex-A72 processor |
|
|
memory |
4GB 128-bit LPDDR4 |
|
|
Camera |
Raspberry pi NoIR Camera V2 |
|
|
LED |
IR LED 900nm |
|
|
Buzzer |
HMB 1206-05 |
|
This study identifies vehicle aluminum wheel internal casting defects. The experimental structure is shown in Figure 8, to use the X-ray non-destructive inspection equipment to inspect aluminum wheel internal casting defects. The photo images are shown on an X-ray inspection screen. When the X-ray ray irradiates the vehicle's aluminum wheel-casting blank, the casting defect hole will be transparent and white. A non-casting defect hole will not be transparent and white. As shown by the blue arrow in Figure 8, the night vision lens Raspberry pi NoIR Camera v2 can take pictures of the aluminum wheel internal casting defects, and was used to obtain casting defects inside three different casting blanks, as shown by the pink arrow in Figure 8. Finally, the YOLO weight file that has been trained is combined with in Raspberry pi 4 to identify and distinguish the aluminum wheel internal casting defects.
The system architecture in this study is divided into three steps. As shown in Figure 9, the first step is to collect internal casting defect samples: use the X-ray non-destructive inspection equipment to capture a sample photo of the aluminum wheel internal casting defects. The second step is casting defect training: The X-ray inspection screen uses photographic tools to capture the aluminum wheel internal casting defects for self-adaptive image denoising and image processing. After image processing, the database content includes the position coordinates and the name of the casting defect bounding box category inside the aluminum wheel casting blank in the picture. After YOLO training the casting flaw bounding box position data inside the casting blank can be obtained. The object category confidence level is shown in the rectangular box. The position data for the casting defect bounding box inside the aluminum wheel-casting blank and the type of objects in the rectangular frame has confidence. This information will become the YOLO weight file needed for testing. As shown in Figure 10, the third part is the test part: when the system is turned on, the pre-trained weight file will be imported. When the aluminum wheel-casting blank is inspected by X-ray. The casting blank inspection image is displayed in the designated inspection screen photography area. The system will turn on the camera to take pictures of the aluminum wheel-casting blank. The picture will then enter the identification stage. If the photo has no casting defects the result identified by the identification system will not be included in the database. The system will turn the red LED light off and the buzzer will not produce a defect warning sound. This means that the system does not recognize a casting defect and it is an OK product with good quality that can be transferred to the next step. If the photo has casting defects the result identified by the identification system will be entered into the database. The system will light up the red LED light and make the buzzer defect warning sound to remind the X-ray inspector, which means that the system has identified casting defects. If the photo has casting defects, the results identified by the identification system are not in the database. If there are internal casting defects in the aluminum wheel-casting blank, the casting blank photos to be identified have been wrong more than three times, the system will judge that the casting defect is not in the database, and it will display “Error” and enter the next step. A discriminative phase is the last part in the system. As shown in the pink box in Figure 10, this casting defect sample is a new casting defect type or a new casting defect image, in which case the retraining process must be entered.
Figure 8. System architecture diagram
Figure 9. System architecture of training part
Figure 10. System architecture of test part
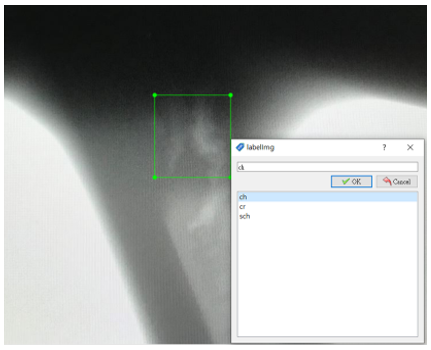
Through the X-RAY non-destructive inspection equipment that to inspect the internal casting defects of the vehicle's aluminum wheel is carried out, and the image is imaged on the X-RAY inspection display screen. Three kinds of aluminum wheel internal casting defects are captured, as shown in Figure 11. After optimization through adaptive image de-noise image processing, the open-source frame selection program labelimage is used to draw a rectangular or square frame around the internal casting defects in the image for bad defects. At the same time the casting defects are framed, the labelimage program will output it as a text file (TXT.), which contains the casting defect type name, the center coordinates of the object frame selection, and the length and width of the object frame selection, as shown in Figure 12. A total of 5,700 photo samples were used in this study to create a database of aluminum wheel internal casting defects. Each type has 1,900 internal casting defect photo samples for YOLO training. After the training an additional 100 photo samples of each type will be used, for a total of 300 casting defect photo samples externally tested.
Figure 11. Internal defect images of three castings
Figure12. Frame the casting defect with labelimage
The casting defect samples were tested in two different ways. The first is the most original image was taken by X-RAY and inspected. The second was a periodic noise removal image processing method based on weighted adaptive morphology combined with a composite cascade filter. Comparing the two methods, the aperiodic noise removal image processing method based on weighted adaptive morphology produces a composite cascade filter relatively clear to the human eye. The YOLO deep learning network is different from the visual eye. Therefore, the above two methods were used to identify the internal casting defects from three different vehicle aluminum wheels. The results are shown in Table 4. The PR and mAP testing result values for the casting defect identification rates were determined. The image processing method combined with a periodic noise removal image processing method based on weighted adaptive morphology and a composite cascade filter used in this research was better than the original image.
Table 4. Accuracy PR mAP of different filter on YOLOv4 model
|
|
PR (%) |
mAP(%) |
||
|
Defect Filter |
ch |
cr |
sch |
|
|
Original |
73.3 |
76.1 |
65.1 |
71.4 |
|
Composite Cascade Filter |
96.7 |
93.4 |
100 |
96.8 |
Table 5. Accuracy(ch) of different sample sizes on different YOLO models
|
|
Yolo v3 |
Yolov3-tiny |
Yolo v4 |
Yolov4-tiny |
Yolo v5s |
Yolo v5m |
|
Samples |
PR (%)_ch-Test sample:100p |
|||||
|
150 |
84.2 |
64.3 |
96.1 |
83.5 |
92.4 |
96.8 |
|
400 |
89.9 |
82.1 |
97.7 |
88.6 |
94.8 |
97.4 |
|
650 |
98.2 |
87.7 |
97.3 |
89.3 |
96.7 |
96.1 |
|
900 |
92.5 |
75.0 |
97.7 |
88.6 |
91.5 |
92.5 |
|
1150 |
93.8 |
88.5 |
94.9 |
91.5 |
98.0 |
96.3 |
|
1400 |
95.4 |
71.5 |
97.6 |
89.2 |
97.0 |
98.0 |
|
1650 |
97.8 |
84.0 |
94.7 |
83.3 |
96.3 |
94.9 |
|
1900 |
94.0 |
88.0 |
96.7 |
88.6 |
97.5 |
92.2 |
Table 6. Accuracy(cr) of different sample sizes on different YOLO models
|
|
Yolo v3 |
Yolov3-tiny |
Yolo v4 |
Yolov4-tiny |
Yolo v5s |
Yolo v5m |
|
Samples |
PR (%)_cr-Test sample:100p |
|||||
|
150 |
63.8 |
40.7 |
81.0 |
40.8 |
87.1 |
84.9 |
|
400 |
84.9 |
63.3 |
92.3 |
64.8 |
85.8 |
86.6 |
|
650 |
78.9 |
62.6 |
90.8 |
55.2 |
89.7 |
89.1 |
|
900 |
87.2 |
65.6 |
92.3 |
68.5 |
90.7 |
91.9 |
|
1150 |
85.0 |
61.4 |
95.8 |
57.5 |
93.6 |
94.8 |
|
1400 |
58.0 |
59.1 |
95.3 |
57.7 |
90.0 |
90.0 |
|
1650 |
65.4 |
33.5 |
93.9 |
81.8 |
92.6 |
90.3 |
|
1900 |
86.5 |
51.4 |
93.4 |
87.4 |
91.3 |
92.5 |
Table 7. Accuracy(sch) of different sample sizes on different YOLO models
|
|
Yolo v3 |
Yolov3-tiny |
Yolo v4 |
Yolov4-tiny |
Yolo v5s |
Yolo v5m |
|
Samples |
PR (%)_sch-Test sample:100p |
|||||
|
150 |
100 |
87.7 |
100 |
92.5 |
99.9 |
99.9 |
|
400 |
100 |
95.1 |
100 |
89.7 |
99.5 |
99.7 |
|
650 |
98.9 |
65.1 |
100 |
91.3 |
99.8 |
100 |
|
900 |
100 |
64.1 |
100 |
92.7 |
99.5 |
99.5 |
|
1150 |
98.2 |
82.9 |
100 |
85.3 |
99.7 |
99.7 |
|
1400 |
100 |
40.2 |
100 |
94.4 |
99.8 |
99.8 |
|
1650 |
85.6 |
22.1 |
100 |
95.8 |
99.8 |
99.6 |
|
1900 |
90.2 |
60.8 |
100 |
93.2 |
99.9 |
99.5 |
The number of iterations was set to classes*2,000 as suggested by the original author of YOLO v4.0. This was the optimal number of iterations. In order to obtain the optimized parameter conditions and the most appropriate training time for YOLO training, this study used two training parameter conditions. The first parameter is that the number of iterations is from 1,000 to 30,000 times. The second is the training angle from 0° to 330°. The YOLOv4 tiny model compares the test result value for PR, the average mAP, and IoU. Considering the final training time and identification results, the overall result is better when the training parameters are overlapped 6000 times and the rotation angle is 0°. The training time is also shorter. In this analysis the optimized parameter conditions and the most appropriate training time for YOLO training were obtained as a follow-up study.
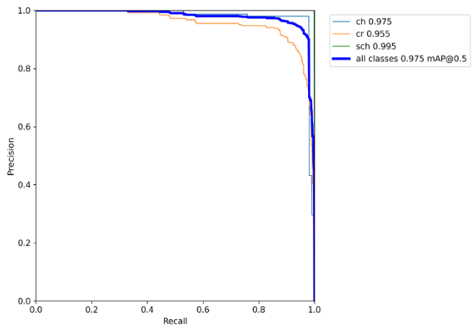
In order to find the correlation between the number of samples and the accuracy rate, this study conducted a test analysis of each number of samples. The number of photo samples was from 150 photo samples to 1900 photo samples, and the number of samples was incremented using 250 photo samples each time. Six different model architectures were used for training and identification, respectively the YOLOv3, YOLOv3-tiny, YOLOv4, YOLOv4-tiny, YOLOv5s and YOLOv5m model architectures. As shown in Tables 5 to 8, according to the final results, when adding the samples and the PR and mAP accuracy rates for related defect types will also crease accordingly for each YOLO module. The recognition performance comparison for each YOLO module can be seen in the mAP values for the final samples for 1900p, as shown in Table 9. The YOLOv3 and YOLOv4 are modules with more convolution layers. The recognition rate performance is good with the mAP value respectively 90.2% and 96.8%, but the disadvantage is that it takes a lot of time to perform research training. YOLOv3-tiny and YOLOv4-tiny are lightweight modules of YOLOv3 and YOLOv4, which use fewer convolutional layers for training. The purpose is to reduce the research and training time, and the relative recognition rate can be maintained. However, due to the use of fewer convolutional layers, the YOLO system can intercept fewer features, it can be seen from the results that the recognition rate is relatively low, with the mAP value respectively 66.7% and 89.7%. The YOLOv5s and YOLOv5m modules combine the advantages of YOLOv4-tiny and YOLOv4. They can not only shorten the system training time like YOLOv4-tiny but also maintain a good recognition rate like YOLOv4. Therefore, the mAP values for YOLOv5s and YOLOv5m respectively were 97.5% and 97.6%, as shown in Figures 13 to 14. Finally, in this study, after the results were compared, the YOLOv5 module has a very good recognition rate and better than the others.
In addition, in order to find the correlation between the number of training and the accuracy rate, test and analyze each training number, the YOLO module selected this time was the latest YOLOv5s and YOLOv5m. The number of training (Epoch) is from 1 to 40, depending on the training times incremented every 5 times. A total of 9 training parameters were used for training and identification. As shown in Tables 10 and 11, according to the final results, when the number of training times is added, the accuracy rates PR and mAP of related defect types will also crease accordingly. According to the final average mAP value, the result from one training session is the worst, the PR range of casting defect recognition rate is 14.9% to 44.9%, and the average mAP value range is 31.3% to 58.8%. Taking 40 training times as the best result, the PR range of each casting defect recognition rate is 93.1% to 99.8%, and the average mAP value range is 97.9% to 98.1%. At the same time, it was also found that when the number of training times was more than 5 times, whether it is YOLOv5s or YOLOv5m module, the PR of casting defect precision rate can reach 88.0% to 99.7%, and the average mAP value can reach 95.2% to 95.4%. The research data results show that the YOLOv5 system can achieve a good precision rate even when the number of training times for casting defects is small, which can be a reference for shortening the research training time.
External casting defect identification system, combined with optimized YOLO weight and Raspberry Pi 4 to run the execute identification, and the identification test results can successfully identify and classify each casting defect type, then according to the inspection result can inform the production line to improve the casting defects and to achieve stable production, as shown in Figure 15. The stability and precision of the identification system are extremely important, which will be one of the indicators of whether it can be imported into production. This study is based on the five core tools of IATF 16949, among which are the Reproducibility and Repeatability of MSA (Measurement Systems Analysis)-confirming the stability and accuracy of the identification system.
Table 8. Accuracy(mAP) of different sample sizes on different YOLO models
|
|
Yolo v3 |
Yolov3-tiny |
Yolo v4 |
Yolov4-tiny |
Yolo v5s |
Yolo v5m |
|
Samples |
mAP (%)_Test sample:100p |
|||||
|
150 |
82.7 |
64.2 |
92.3 |
72.3 |
95.5 |
95.1 |
|
400 |
91.6 |
77.5 |
96.7 |
81.1 |
96.8 |
97.1 |
|
650 |
92.0 |
71.8 |
96.0 |
78.6 |
97.0 |
97.0 |
|
900 |
93.2 |
68.2 |
96.7 |
83.3 |
96.4 |
97.1 |
|
1150 |
92.3 |
77.6 |
96.9 |
78.1 |
97.8 |
97.8 |
|
1400 |
84.5 |
56.9 |
97.6 |
80.5 |
97.0 |
97.5 |
|
1650 |
82.9 |
46.5 |
96.2 |
87.0 |
97.6 |
97.7 |
|
1900 |
90.2 |
66.7 |
96.8 |
89.7 |
97.5 |
97.6 |
Table 9. Accuracy PR and mAP on different YOLO models Total samples: 2000p per each defects (Training:1900p/Test: 100p)
|
Defects YOLO Models |
PR (%) |
mAP (%) |
||
|
ch |
cr |
sch |
|
|
|
Yolov3 |
94.0 |
86.5 |
90.2 |
90.2 |
|
Yolov3-tiny |
88.0 |
51.4 |
60.8 |
66.7 |
|
Yolov4 |
96.7 |
93.4 |
100.0 |
96.8 |
|
Yolov4-tiny |
88.6 |
87.4 |
93.2 |
89.7 |
|
Yolov5s |
97.5 |
91.3 |
99.9 |
97.5 |
|
Yolov5m |
92.2 |
92.5 |
99.5 |
97.6 |
Table 10. Accuracy PR and mAP of different epoch times on YOLOv5s model
|
Defects Epoch Times |
PR (%) |
mAP (%) |
||
|
ch |
cr |
sch |
|
|
|
1 |
22.4 |
29.1 |
40.5 |
31.3 |
|
5 |
91.0 |
88.2 |
99.7 |
95.2 |
|
10 |
92.1 |
91.3 |
99.6 |
95.7 |
|
15 |
97.8 |
91.6 |
99.8 |
97.3 |
|
20 |
99.0 |
90.3 |
99.7 |
97.9 |
|
25 |
96.0 |
92.8 |
100.0 |
97.4 |
|
30 |
97.5 |
91.3 |
99.9 |
97.5 |
|
35 |
98.0 |
91.7 |
100.0 |
97.7 |
|
40 |
98.1 |
93.1 |
99.8 |
97.9 |
Figure 13. The mAP@0.5 chart of three casting defects for YOLOv5s
Figure 14. The mAP@0.5 chart of three casting defects for YOLOv5m
Table 11. Accuracy PR and mAP of different epoch times on YOLOv5m model
|
Defects Epoch Times |
PR (%) |
mAP (%) |
||
|
ch |
cr |
sch |
|
|
|
1 |
14.9 |
25.1 |
44.9 |
58.8 |
|
5 |
88.0 |
89.1 |
99.6 |
95.4 |
|
10 |
92.0 |
92.0 |
100.0 |
96.7 |
|
15 |
92.5 |
92.9 |
100.0 |
96.9 |
|
20 |
94.1 |
90.0 |
99.5 |
97.2 |
|
25 |
97.2 |
90.0 |
99.6 |
97.8 |
|
30 |
92.2 |
92.5 |
99.5 |
97.6 |
|
35 |
95.4 |
90.0 |
99.6 |
97.9 |
|
40 |
94.6 |
93.5 |
99.7 |
98.1 |
Reproducibility: Under different conditions, such as different inspectors, the same program settings, photos of inspected flaws, and environmental conditions, repeat the measurement of the same object under test to ensure the accuracy of the system. In the external experimental test, this study selected casting defect photos, 10 samples of different types of defective products (with defects), 5 photos of different good samples (without defects), and photos of each casting defect A total of 15 samples, 45 samples in total, and was tested by 3 different inspectors for the precision of the system. The judgment is based on whether the system can correctly distinguish defective products from good products, and clearly distinguish and identify them. The test results show that the system can successfully identify and inspect various types of NG and OK products 100%. The system can successfully complete the identification when testing is performed by three different testers, which means that in addition to the identification system accuracy, the reliability degree is OK and the system program will not produce abnormal recognition due to different variations, which will indirectly affect the identification result.
Repeatability: Under the same conditions, such as the same inspector, in the same program setting, defect photos and environmental conditions, repeatable measurement of the same object was conducted to ensure system stability. In the external experimental test, this study selected casting defect photos, 10 photo samples of the same defect, and a total of 30 samples to conduct a systematic stability test. The judgment basis is based on whether the system can clearly and correctly identify and detect the same defective product location, and will not produce identification variation. The test results show that the system can successfully identify and detect defective products and defective positions 100%, and there was no abnormal position identification, which indicates the stability and reliability of the identification system. In the beginning of this research, we focused on the source quality of the training samples, and after multiple tests and verifications, defined the correct parameters of the training samples that managed and implemented them accordingly. Rigorous research and training process can finally achieve optimal and credible research identification results.
Figure 15. The results of the three casting defects detection
An identification system for automotive aluminum rim internal casting defects was established. The target is to find a method that can improve the training speed, and actually help the casting manufacturing process. We trained six different models that are YOLOv3, YOLOv3-tiny, YOLOv4, YOLOv4-tiny, YOLOv5s, and YOLOv5m. The final experimental test results show that of these six different model architectures, the YOLOv4 and YOLOv5 model architectures performed better in all aspects. In terms of the recognition rate for each casting defect type, the YOLOv4 model architecture was the best, with more than 90%, and its range was 93.4%~100%; The average mAP was also above 96.8%. In terms of the average mAP recognition rate, the YOLOv5s and YOLOv5m model architectures were the best, with 97.5% and 97.6%, both of which were above 97.0%. If the main goal of this research is to maintain a high defect recognition rate and a good training time, the YOLOv5s model architecture is the best. The recognition rate for each casting defect type was over 91.0%, and its range was 91.3%~99.9%. The average mAP was 97.5% and the average mAP was better than the YOLOv4 model architecture. The training time is a quarter for YOLOv4, showing that the YOLOv5s model architecture is very suitable for vehicle aluminum wheel technological developments in the detection of internal casting defects. Finally, previous studies on the identification of internal defects in cast aluminum alloys only focused on the differences in the recognition rate of each deep learning module and found the optimal module. In this study, followed the previous model and retained Yolov3 and Yolov4. In addition to the module, the newly developed Yolov5 module is added to compare the identification results, and after obtaining the optimized weight, it is output to the external Raspberry pi 4 for simulating the actual casting production to detect internal casting defects, and finally obtains satisfactory application identification, and that created an internal casting defect identification system for aluminum wheels follow the result, combined with the optimized YOLO weight output and the casting defect identification on Raspberry Pi 4. This system has the reproducibility method in the MSA measurement analysis verification. The results show that the identification system created by it can have good stability and accuracy. It can accurately identify and distinguish numerous types of defects with high reliability. This system will eliminate human variability leading to affecting the final product identification results. The system devised in this study achieved satisfactory results in the detection of internal aluminum wheel casting defects. The quality inspection and evaluation technology for internal casting defects are expected to develop further, increasing practical use in automotive aluminum wheel and related casting production industries in the future.
The study was supported by the Ministry of Science and Technology of Taiwan, Republic of China, under project number MOST-111-2221-E-018-008.
[1] Beeley, P. (2001). 5-Defects in castings. Foundry Technology (Second Edition), 239-318.
[2] D’orazio, T., Leo, M., Distante, A., Guaragnella, C., Pianese, V., Cavaccini, G. (2008). Automatic ultrasonic inspection for internal defect detection in composite materials. NDT & E International, 41(2): 145-154. https://doi.org/10.1016/j.ndteint.2007.08.001
[3] Kamalakannan, A., Rajamanickam, G. (2017). Spatial smoothing based segmentation method for internal defect detection in X-ray images of casting components. In 2017 Trends in Industrial Measurement and Automation (TIMA), IEEE, pp. 1-6. https://doi.org/10.1109/TIMA.2017.8064796
[4] Manikandan, K.R., Sivagurunathan, P.A., Ananthan, S.S., Moshi, A.A.M., Bharathi, S.R.S. (2021). Study on the influence of temperature and vibration on indications of liquid penetrant testing of A516 low carbon steel. Materials Today: Proceedings, 39(4): 1559-1564. https://doi.org/10.1016/j.matpr.2020.05.572
[5] Bato, M.R., Hor, A., Rautureau, A., Bes, C. (2020). Experimental and numerical methodology to obtain the probability of detection in eddy current NDT method. NDT & E International, 114: 102300. https://doi.org/10.1016/j.ndteint.2020.102300
[6] Borecki, M., Rychlik, A., Vrublevskyi, O., Olejnik, A., Korwin-Pawlowski, M.L. (2021). Method of non-invasive determination of wheel rim technical condition using vibration measurement and artificial neural network. Measurement, 185: 110050. https://doi.org/10.1016/j.measurement.2021.110050
[7] Mery, D., Arteta, C. (2017). Automatic defect recognition in X-ray testing using computer vision. In 2017 IEEE Winter Conference on Applications of Computer Vision (WACV), IEEE, pp. 1026-1035. https://doi.org/10.1109/WACV.2017.119
[8] Mery, D., Filbert, D. (2002). Automated flaw detection in aluminum castings based on the tracking of potential defects in a radioscopic image sequence. IEEE Transactions on Robotics and Automation, 18(6): 890-901. https://doi.org/10.1109/TRA.2002.805646
[9] Ponnusamy, V., Marur, D.R., Dhanaskodi, D., Palaniappan, T. (2021). Deep learning-based X-ray baggage hazardous object detection-an FPGA implementation. Revue d'Intelligence Artificielle, 35(5): 431-435. https://doi.org/10.18280/ria.350510
[10] Li, X.L., Tso, S.K., Guan, X.P., Huang, Q. (2006). Improving automatic detection of defects in castings by applying wavelet technique. IEEE Transactions on Industrial Electronics, 53(6): 1927-1934. https://doi.org/10.1109/TIE.2006.885448
[11] Zhang, J.S., Guo, Z.J., Jiao, T.Y., Wang, M.Q. (2018). Defect detection of aluminum alloy wheels in radiography images using adaptive threshold and morphological reconstruction. Applied Sciences, 8(12): 2365. https://doi.org/10.3390/app8122365
[12] Ayalew, A.M., Salau, A.O., Abeje, B.T., Enyew, B. (2022). Detection and classification of COVID-19 disease from X-ray images using convolutional neural networks and histogram of oriented gradients. Biomedical Signal Processing and Control, 74: 103530. https://doi.org/10.1016/j.bspc.2022.103530
[13] Kumar, A. (2022). RYOLO v4-tiny: A deep learning based detector for detection of COVID and Non-COVID pneumonia in CT scans and X-RAY images. Optik, 268: 169786. https://doi.org/10.1016/j.ijleo.2022.169786
[14] Shafyei, A., Anijdan, S.H.M., Bahrami, A. (2006). Prediction of porosity percent in Al-Si casting alloys using ANN. Materials Science and Engineering: A, 431(1-2): 206-210. https://doi.org/10.1016/j.msea.2006.05.150
[15] LeCun, Y., Bottou, L., Bengio, Y., Haffner, P. (1998). Gradient-based learning applied to document recognition. Proceedings of the IEEE, 86(11): 2278-2324. https://doi.org/10.1109/5.726791
[16] Salluri, D.K., Bade, K., Madala, G. (2020). Object detection using convolutional neural networks for natural disaster recovery. International Journal of Safety and Security Engineering, 10(2): 285-291. https://doi.org/10.18280/ijsse.100217
[17] Wang, J., Xu, L. (2022). PYNQ framework based object recognition implementation using Convolution Neural Network (CNN). Review of Computer Engineering Studies, 9(4): 136-140. https://doi.org/10.18280/rces.090402
[18] Girshick, R., Donahue, J., Darrell, T., Malik, J. (2014). Rich feature hierarchies for accurate object detection and semantic segmentation. In 2014 IEEE Conference on Computer Vision and Pattern Recognition, pp. 580-587. https://doi.org/10.1109/CVPR.2014.81
[19] He, K.M., Gkioxari, G., Dollár, P., Girshick, R. (2017). Mask R-CNN. In 2017 IEEE International Conference on Computer Vision (ICCV), pp. 2961-2969. https://doi.org/10.1109/ICCV.2017.322
[20] Liu, W., Anguelov, D., Erhan, D., Szegedy, C., Reed, S., Fu, C.Y., Berg, A.C. (2016). SSD: Single shot multibox detector. In Computer Vision-ECCV 2016: 14th European Conference, Springer International Publishing, pp. 21-37. https://doi.org/10.1007/978-3-319-46448-0_2
[21] Fu, C.Y., Liu, W., Ranga, A., Tyagi, A., Berg, A.C. (2017). DSSD: Deconvolutional single shot detector. arXiv Preprint arXiv: 1701.06659. https://doi.org/10.48550/arxiv.1701.06659
[22] Subramani, M., Rajaduari, K., Choudhury, S.D., Topkar, A., Ponnusamy, V. (2020). Evaluating one stage detector architecture of convolutional neural network for threat object detection using X-ray baggage security imaging. Revue d'Intelligence Artificielle, 34(4): 495-500. https://doi.org/10.18280/ria.340415
[23] Redmon, J., Divvala, S., Girshick, R., Farhadi, A. (2016). You only look once: Unified, real-time object detection. In 2016 IEEE Conference on Computer Vision and Pattern Recognition (CVPR), pp. 779-788. https://doi.org/10.1109/CVPR.2016.91
[24] Redmon, J., Farhadi, A. (2017). YOLO9000: Better, faster, stronger. In 2017 IEEE Conference on Computer Vision and Pattern Recognition (CVPR), pp. 7263-7271. https://doi.org/10.1109/CVPR.2017.690
[25] Redmon, J., Farhadi, A. (2018). YOLOv3: An incremental improvement. arXiv Preprint arXiv: 1804.02767. https://doi.org/10.48550/arXiv.1804.02767
[26] More, B., Bhosale, S. (2023). A comprehensive survey on object detection using deep learning. Revue d'Intelligence Artificielle, 37(2): 407-414. https://doi.org/10.18280/ria.370217
[27] Campbell, J. (2015). Complete Casting Handbook: Metal Casting Processes, Metallurgy, Techniques and Design. Butterworth-Heinemann, 821-882.
[28] Leister, G. (2018) Passenger car tires and wheels: Development - Manufacturing - Application. Springer. https://doi.org/10.1007/978-3-319-50118-5
[29] Fang, F.M., Wang, T.T., Wu, S.Y., Zhang, G.X. (2020). Removing moiré patterns from single images. Information Sciences, 514: 56-70. https://doi.org/10.1016/j.ins.2019.12.001
[30] Dai, D., Zhang, X.G. (2018). A periodic noise elimination algorithm based on morphological filtering with auto-adapted weights. 28(5): 9-12. https://doi.org/10.3969/j.issn.1673-629X.2018.05.003
[31] Chen, X.S., Zhang, X., Yang, Y.T., Sun, P. (2008). Research for adaptive audio information hiding approach based on DWT. In 2008 Chinese Control and Decision Conference, IEEE, pp. 3029-3033. https://doi.org/10.1109/CCDC.2008.4597882
[32] Haripriya, R.P., Mathew, L.R., Gopakumar, K. (2017). Performance evaluation of dwt based speech enhancement. In 2017 International Conference on Networks & Advances in Computational Technologies (NetACT), IEEE, pp. 442-446. https://doi.org/10.1109/NETACT.2017.8076812
[33] Wang, X., Han, Z.Y., Wang, J., Ma, Y.J. (2008). Speech recognition based on wavelet packet transform and K-L expansion. In 2008 Chinese Control and Decision Conference, IEEE, pp. 2490-2493. https://doi.org/10.1109/CCDC.2008.4597773
[34] Revathy, G., Raj, K.B., Kumar, A., Adibatti, S., Dahiya, P., Latha, T.M. (2022). Investigation of E-voting system using face recognition using convolutional neural network (CNN). Theoretical Computer Science, 925: 61-67. https://doi.org/10.1016/j.tcs.2022.05.005
[35] Bochkovskiy, A., Wang, C.Y., Liao, H.Y.M. (2020). Yolov4: Optimal speed and accuracy of object detection. arXiv Preprint arXiv: 2004.10934. https://doi.org/10.48550/arXiv.2004.10934
[36] Nepal, U., Eslamiat, H. (2022). Comparing YOLOv3, YOLOv4 and YOLOv5 for autonomous landing spot detection in faulty UAVs. Sensors, 22(2): 464. https://doi.org/10.3390/s22020464
[37] Thao, L.Q., Cuong, D.D., Anh, N.T., Anh, P.M., Duc, H.M., Minh, N. (2022). Automatic traffic red-light violation detection using AI. Ingénierie des Systèmes d’Information, 27(1): 75-80. https://doi.org/10.18280/isi.270109
[38] Benjumea, A., Teeti, I., Cuzzolin, F., Bradley, A. (2021). YOLO-Z: Improving small object detection in YOLOv5 for autonomous vehicles. arXiv Preprint arXiv: 2112.11798. https://doi.org/10.48550/arXiv.2112.11798
[39] Dong, X.D., Yan, S., Duan, C.Q. (2022). A lightweight vehicles detection network model based on YOLOv5. Engineering Applications of Artificial Intelligence, 113: 104914. https://doi.org/10.1016/j.engappai.2022.104914