Umut Tatli![]() | Cafer Budak*
| Cafer Budak*![]()
© 2023 IIETA. This article is published by IIETA and is licensed under the CC BY 4.0 license (http://creativecommons.org/licenses/by/4.0/).
OPEN ACCESS
Image segmentation is an important field in image processing and computer vision, particularly in the development of methods to assist experts in the biomedical and medical fields. It plays a vital role in saving time and costs. One of the most successful and significant methods in image segmentation using deep learning is the U-Net model. In this paper, we propose U-Net11, a novel variant of U-Net that uses 11 convolutional layers and introduces some modifications to improve the segmentation performance. The classical U-Net model was developed and tested on three different datasets, outperforming the traditional U-Net approach. The U-Net11 model was evaluated for breast cancer segmentation, lung segmentation from CT images, and the nuclei segmentation dataset from the Data Science Bowl 2018 competition. These datasets are valuable due to their varying image quantities and the varying difficulty levels in segmentation tasks. The modified U-Net model has achieved Dice Similarity Coefficient scores of 69.09% on the breast cancer dataset, 95.02% on the lung segmentation dataset and 81.10% on the nuclei segmentation dataset, exceeding the performance of the classical U-Net model by 5%, 2% and 4% respectively. This difference in success rates is particularly significant for critical segmentation datasets.
image segmentation, deep learning, biomedical image, U-Net
In recent years, image segmentation has become a widely researched topic. It serves as an essential element in numerous visual applications. Image Segmentation is the process of classifying each pixel in an image as belonging to a certain class; therefore, it is considered a pixel classification method. The main goal of image segmentation is to divide an image into several meaningful and analyzable segments with similar or exactly the same features. Two types of segmentation methods exist: Semantic segmentation and Instance segmentation methods. Instance Segmentation aims to estimate class labels and pixel-level sample masks to accommodate the varying number of samples that appear in each image [1]. In other words, it classifies the sought-after objects individually.
On the other hand, semantic segmentation aims to assign a categorical label to each pixel in an image, but this label is not different from the others [2]. In other words, if there are five different color cars in an image, instance segmentation determines five different color labels, while semantic segmentation determines one label. Semantic segmentation is used in areas related to health and medicine, while instance segmentation is mainly used in areas related to daily life. Today, semantic segmentation is frequently used in the biomedical field. In the biomedical field, cell segmentation is used for nucleus segmentation, cancer segmentation, tumor segmentation, or organ segmentation. Image segmentation has been used to detect cancerous tissue or the cells in this tissue in recent years.
There exist various methods for image segmentation in the deep learning area. Mask R-CNN was proposed by He et al. in 2020 [3], InstanceCut with the Model was introduced by Kirillov et al. in 2017 [4], FCN was developed by Long et al. in 2015 [5], R-CNN was presented by Girshick et al. in 2014 [6], U-Net was designed by Ronneberger et al. in 2015 [7], Deeplab was implemented by Chen et al. in 2018 [8], INet was created by Weng and Zhu in 2021 [9], Superpixels and Clustering Methods were applied by Mendi and Budak in histopathological images in 2021 [10] and GCN was used by Peng et al. in 2017 [11] to provide semantic segmentations by using different deep learning algorithms in image segmentation.
The U-Net Model is one of the most commonly used image segmentation methods with deep learning. Some of the studies that used this model are: separating concrete cracks from concrete [12], tumor detection from 3D brain images [13], cell segmentation for 2D and 3D images [14], glaucoma detection [15], vessel detection for Cerebrovascular disease [16], human placenta image detection [17], uterine region estimation from MR images [18], and lung lobe segmentation from 3D chest tomography [19].
In addition, the U-Net model has inspired many models. Zhou et al. proposed U-Net++ in 2018 [20], Diakogiannis et al. introduced ResUNet-a in 2020 [21], Zhang et al. developed ResUnet in 2018 [22], Alom et al. presented R2U-Net in 2018 [23], Oktay et al. designed Attention U-Net in 2018 [24], Ibtehaz et al. implemented MultiResUNet in 2020 [25], Zhuang created LadderNet in 2018 [26], Iglovikov et al. applied Ternausnet in 2018 [27], Stoller et al. used Wave-U-Net in 2018 [28], Meseguer-Brocal and Peeters exploited CU-Net in 2019 [29], Ma et al. leveraged Docunet in 2018 [30], Isensee et al. built nnU-Net in 2021 [31], Olimov et al. constructed FU-Net in 2021 [32], Wang et al. employed Non-Local U-Nets in 2020 [33], Qin et al. utilized Match Feature U-Net: Dynamic Receptive Field Networks for Biomedical Image Segmentation [34] in 2020. They have developed models by being inspired by the U-Net architecture which are close to U-Net but have more successful results.
The aim of this study is to measure the success rate between the models by testing the difference between the layers of the U-Net model on the nucleus segmentation, breast cancer cell segmentation and organ segmentation in the lung segmentation dataset. In the research, by adding two more layers to the classic U-Net Model, the U-Net11 Model was created with 11 layers, the U-Net13 Model was created with 13 layers which has two more layers than the U-Net11 Model, and the U-Net7 model was created by removing two layers from the classic U-Net Model. Then the differences between the created models was compared. The models were tested in three different data set types and success rates were observed.
2.1 Datasets
In the study: three different data sets were used, including the nucleus segmentation data set of the 2018 Data Science Bowl competition, which is frequently used in breast cancer, lung segmentation, and cell segmentation methods. The images aim to find the malignant tumor against the benign tumor. The formats of the three datasets were fixed at the specified values. Increasing the single-channel data to 3 channels was of course expected to negatively affect the learning process, but this did not apply to the benchmarked models. Because we changed the number of channels only in the lung segmentation data. But it was important for us to standardize the data so that the models would experience the same negative learning processes.
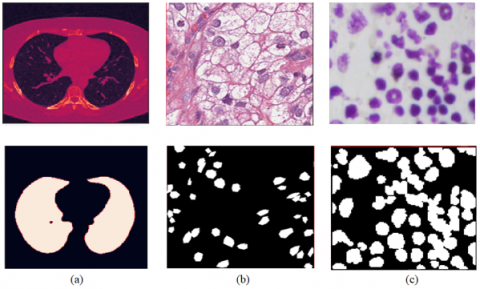
The images in the dataset are as in Figure 1. The breast cancer data set was taken from Harvard University’s Beck Lab. The dataset contains high-resolution histopathological images of renal carcinoma selected from TCGA (The Cancer Genome Atlas) data. It constitutes the primary source for projects in computational pathology by examining the morphological and clinical features of the cancer disease of TCGA together. While the texture images are in RGB format, the mask images consist of only black and white images.
Figure 1. (a) Chest CT Image and image of the segment where the lung is located (b) tissue and cancerous cells with breast cancer (c) tissue and segmented nucleus
The dataset containing nuclei segmentation is taken from the Data Science Bowl 2018 competition. The data set consists of 841 2D images and 37,333 manually segmented nuclei images from more than 30 experiments [35]. Since the data set is collected from different parts of the world, it is not uniform data. Some images are in color-RGB format, while some images are in black and white. In addition, since they are taken from different microscopes, their angle of view also varies.
Lung segmentation dataset was retrieved from a Kaggle (https://www.kaggle.com/datasets/kmader/finding-lungs-in-ct-data). The data set includes segmented lung images obtained manually from 267 CT chest tomographs. The dataset includes 2D and 3D images, but 2D images were used in the research to provide an accurate comparison. There are 64 images in the Breast Cancer dataset and 267 in the Lung dataset, of which 70% were used for training and 30% for testing. The datasets have three channels, while the masks are black and white. All images are in .tiff format. In the nucleus Segmentation dataset, no separation was performed because the training and test data of the images were previously separated. Out of 735 images, 670 were used for training and 65 were used for testing. Although some of the data were black and white and some were in color, all the data were read in color. All images are in png format. It is important to standardize the data so that if the models were to undergo a negative process in the training process, they would experience the same negative learning processes.
2.2 U-Net architecture
U-Net is one of the most popular and successful methods used in biomedical segmentation. U-Net is a special type of Fully Convolutional Networks. Fully Convolutional Neural Networks consist of only locally connected layers without using dense layers [36]. In this way, the number of calculated parameters decreases, and the Model learns more information in a shorter time.
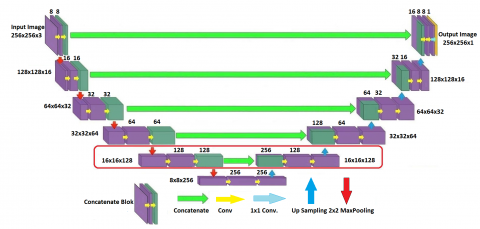
As shown in Figure 2, The U-Net architecture consists of two parts: The Encoder and Decoder parts. On the Encoder side of the architecture (this part is similar to the classic VGG network), 3x3 convolutions of the image are taken, and the image is compressed by 2x2 Max pooling on each layer. The image passes through a double 3x3 convolution on each layer. The purpose of these convolutions is to extract and map the features of the images. If the input image is colored, it is divided into three channels RGB, creating a feature map that determines which region is more important by taking a stride on the image with 3x3 filters. The filter coefficients are multiplied with the values in each color channel, and their sum is taken. After this operation is performed on all three channels, the three results from the feature map [37]. The convolution process is used together with Padding. Padding is used to find boundary pixels but results in pixel loss. Rectified Linear Units Layer (ReLu) process is applied after the convolution layers. This layer is also called the activation layer. The effect it has on the input data is to set negative values to zero. After convolution operations, the image takes on a linear structure, and this process trains the network faster, putting the network back into a nonlinear structure [38]. In the next step, a 2x2 size filter is applied, and the maximum value from the four pixels obtained as a result of the filter is selected. This process is called max pooling. Thus, essential points within the image are determined. The Model tries to learn what the image is here. On the decoder side, 2x2 convolutions of the image are taken, and the image is expanded with the up-sampling process. In the Up-sampling method, the image is expanded by multiplying a sample image $l(x, y)$ image continuously and at a higher rate with the value of $L * f_s$. Where L is a variable up-sampling factor and $f_s$ is the sampled image [38]. The convolution method was used for this task in the research. The operation is exemplified by the logic on the Encoder side of the architecture. After the image is doubled in each layer with Up Sampling, it is concatenated with the layer on the corresponding encoder side. Thence, even if the Model cannot learn the information in the decoder layer, it continues its training with the old information from the encoder layer. The merge process is done over the depth. The final layer maps all components of the final feature map into two classes which need to be estimated by a softmax activation function. In the U-Net models used, Batch Normalization [39] and Dropout [40] were used together to prevent overfitting at each layer. Dropout is based on the principle of ignoring some randomly selected neurons during training. In this way, the Model will not perform overfitting and will perform its training more accurately. Figure 2 illustrates the U-Net Architecture, with the red line highlighting the additional component introduced in the proposed method.
Figure 2. U-Net Architecture-the area indicated by the red line is the part added to the proposed method
2.3 Mathematical formulas for U-Net
To simplify operations, let us define a one-dimensional vector X in N-dimensional space and show it over the Hankel Matrix $H_m(x)$.
$X=[x(1), \quad x(2), \quad x(3), \quad \ldots \quad, x(n)]^T$ (1)
$H_m(X)=\left[\begin{array}{ccccc}X_1(1) & X_2(2) & X_3(3) & \ldots & X(m) \\ X_1(1) & X_2(2) & X_3(3) & \ldots & X(m+1) \\ X_1(1) & X_2(2) & X_3(3) & \ldots & X(m+2) \\ \vdots & \vdots & \vdots & \ddots & \vdots \\ X(n) & X(1) & X(2) & \ldots & X(m-1)\end{array}\right] \in R^{(n x m)}$ (2)
When the input vector is entered through k channels, the Hankel Matrix:
$X_k=\left[\begin{array}{lll}X_1 & \ldots & X_k\end{array}\right]=\left[\begin{array}{ccccc}X_1(1) & X_2(2) & X_3(3) & \ldots & X(m) \\ X_1(1) & X_2(2) & X_3(3) & \ldots & X(m+1) \\ X_1(1) & X_2(2) & X_3(3) & \ldots & X(m+2) \\ \vdots & \vdots & \vdots & \ddots & \vdots \\ X(n) & X(1) & X(2) & \ldots & X(m-1)\end{array}\right] \in R^{(n x m)}$ (3)
In Eq. (3), the vectors $\left[x_i(1), x_i(2), \cdots, x_i(n)\right]$ represent increase in the number of dimensions. The image is decoded in this part. Then when filter $\bar{A}=[A(m) \ldots A(1)]^T$ strides on the input vector:
$Y=X \otimes \bar{A}=H_m(X) \bar{A} \in R^{n x 1}$ (4)
Eq. (4) is obtained. The Hankel Matrix has a low-level structure that allows the preservation of the input vector’s principal elements and extracts properties from the input vector [41].
$y_i=C^T(Y)=C^T H_m(x) A$ (5)
$C_e^T Y=\left[\begin{array}{l}D \\ E\end{array}\right]$ (6)
$y_i$ value is the system output, and D value represents concatenation operations in layers. E value is the attribute extraction process. In Eq. (3), the convolution result is first subtracted from the attribute and then reduced in size by the max-pooling process. The same process is applied to the opposite layer that is equivalent to that layer, and the concatenation is performed. If we generalize these equations after editing:
$H_m(X)=\bar{C} C^T H_m(X) A(\bar{A})^T$ (7)
$X=\overline{(C} D) \otimes V(\bar{A})$ (8)
$D=C^T(Y)$ (9)
Eq. (8) and Eq. (9) are obtained. The values of A and $V(\bar{A})$ represent convolution and inverse convolution; respectively, C represents the max-pooling process, $\bar{C}$ represents the upsampling process.
2.4 Loss function
In our study, we used the Dice Similarity Coefficient (DSC), also known as the F1 Score, as a loss function. The DSC is a method of calculating loss that measures the similarity of two sets. It is frequently used in medical images and gives better results than other metrics in image segmentation. In our case, the A value is the cancerous cell predicted by the model due to segmentation in the cell, and the B value is the ground truth value.
$\operatorname{Dice}_{\text {Loss }}=1-\frac{2 * \sum(A * B)}{\sum(A)+\sum(B)}$ (10)
Eq. (10) is obtained.
As another loss function, intersection over union (IoU) is used. The IoU is also known as the Jaccard Index. The IoU is a standard measure used to find the similarity between the predicted region and the precise reference regions.
$I o U=\frac{T P}{F P+T P+F N}=\frac{A \cap B}{A \cup B}$ (11)
Eq. (11) is obtained.
The reason why we use DSC and IoU structures in our study is that DSC and IoU are more advantageous than other loss functions. While this situation differs in 3D images, it has been observed that DSC and IoU achieve more successful results in 2D and asymmetrical images [42].
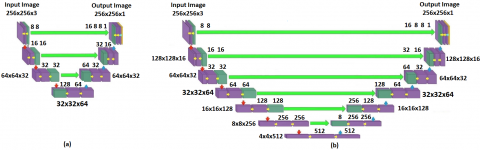
Results are obtained in Python language and Google Colaboratory environment. U-Net and the proposed Model were trained using TensorFlow 2.4.1 and Keras 2.4.3 libraries. All three data sets were converted to 256×256×3 format to make no difference in model comparison. For the Model to detect cancer cells in images of cancerous tissue better, the success rate has been increased by applying the zooming process to the images. Since the cell images in the Data-Science Bowl 2018 data set consist of more than one mask image, these mask images were first superimposed with the NumPy library, resulting in a mask image for each cell image. For the data set training, 25 epochs values and 200 steps per epoch were determined. With these values, it takes 44 ms per step and 38 s per epoch. Architectures of U-Net 7 and U-Net 13 are given in Figure 3.
Figure 4. (a) Prediction of models on the breast cancer dataset (b) Training and test success results on the breast cancer dataset of the U-Net13 model
The results of breast cancer data, U-Net7, U-Net, U-Net11 and U-Net13 models after training are shown in Figure 4.
It seems that the U-Net11 model has a more successful result than the classic U-Net, U-Net7 and U-Net13 models. In Figure 4, it is seen that the U-Net7 model could not provide sufficient success, but it obtained better results than the U-Net13 model after the 15th epoch value. The U-Net13 model produces a better result in initial epoch values than the classic U-Net, while the success rate decreases as the epoch value increases.
When the train and test graph of the model is examined in Figure 4, it is seen that it has very good success in the train data, while it cannot be trained after the 4th epoch value in the test data and does overfitting.
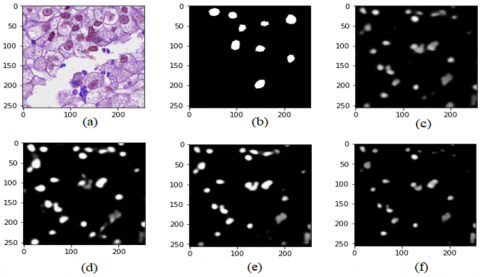
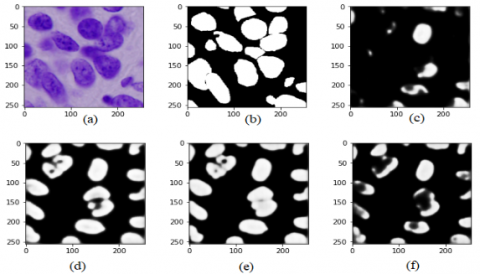
Figure 5. (a) Tissue with breast cancer (b) Segment image of cells (c) Prediction of model U-Net7 (d) Prediction of model U-Net (e) Prediction of model U-Net11 (f) Prediction of model U-Net13
The overfitting problem occurring in large networks also occurred in the U-Net13 model. Further increasing the number of layers of networks in the U-Net structure causes overfitting rather than increasing the model’s performance. As seen in Figure 5, the U-Net11 model is the model that produces the most successful results among the compared U-Net models.
In order to see its performance in different data sets, the models were tested on lung segmentation data. The reason for choosing the lung data set is to compare the success of the models in selecting the small bumps in a large image. Performance results are given in Figure 6.
As seen in Figure 6, the U-Net11 Model learned the data set starting from the 2nd epoch value and got ahead of other models. In Figure 7, the Model’s predictions can be seen on the CT image.
Figure 6. Prediction of the models on the lung segmentation data set
Figure 7. (a) CT image (b) Lung segmentation of image (c) Prediction of U-Net7 model (d) Prediction of U-Net model (e) Prediction of U-Net11 model (e) Prediction of U-Net13 model
Figure 8. Predictions of models on the Nucleus Segmentation dataset
Figure 9. (a) Cell tissue (b) Segmented nuclei (c) Prediction of U-Net7 Model (d) Prediction of U-Net model (e) Prediction of U-Net11 model (e) Prediction of U-Net13 model
While models other than the U-Net13 successfully segment the image of the lung, the U-Net7 model appears to be unable to separate the inner region of the lung. The U-Net11 model, on the other hand, seems to be more successful in distinguishing the inner part of the segment on the right side of the image. The models were tested on the 3rd data set, the nucleus segmentation. Since the mask images consist of more than one image in this data set, the stepper epoch value was determined as 100 to reduce the processing load and use the memory more economically. The results are shown in Figure 8. Owing to the fact that models start learning late, higher epoch values should be selected to achieve success. Since the study aimed to compare four models rather than high success, a fixed value of 20 epochs was selected.
The best performance was obtained with the U-Net11 model as with other data sets. Nuclei Segmentation predictions of the models are given in Figure 9. According to Figure 9, the best result is achieved with the U-Net11 Model. As in the Lung Segmentation dataset, the difference in success is small, but even this difference is very important in Biomedical Image segmentation. How significant this difference is can be seen in Figure 9. Although the difference between the U-Net13 models, which is the closest model to the U-Net11 model, is approximately 2%, the U-Net11 model can make clearer predictions than both the U-Net13 and the U-Net model, which has a 4% success difference between them. Numerical success results on the data sets of the models are given in Table 1.
Table 1. Training and test results on data sets of U-Net models
|
Breast Cancer |
Lungs Segmentation |
Nuclei Segmentation |
||||
|
Dice Coff. |
Val. Dice coff |
Dice Coff. |
Val. Dice coff |
Dice Coff |
Val. Dice coff |
|
|
U-Net7 |
0.5161 |
0.4686 |
0.9286 |
0.9539 |
0.7471 |
0.7081 |
|
Classic U-Net |
0.5520 |
0.5121 |
0.9394 |
0.9579 |
0.7655 |
0.7286 |
|
U-Net11 |
0.6909 |
0.5305 |
0.9508 |
0.9598 |
0.7943 |
0.7770 |
|
U-Net13 |
0.7225 |
0.4472 |
0.9474 |
0.9425 |
0.7499 |
0.7568 |
According to Table 1, the U-Net11 Model achieved the best result in three data sets. Although the result of the U-Net13 Model in the training data is the highest in the tree data sets, the reason it has the lowest value in the test data shows that the model overfitting after a while. As the number of layers increases, the Dice coefficient increases, but overfitting occurs, so it is unnecessary to further increase the number of layers. Again, the 7-layer U-Net7 Model, like the U-Net13 as the main reason for the decrease in the success rate of the model, it was concluded that reducing the number of layers also reduces the performance. When the proposed U-Net11 Model and the classical U-Net Model are compared; the proposed model showed a better performance of 5% in the breast cancer dataset, 2% in the lung segmentation dataset, and 4% in the nuclei segmentation dataset.
Table 2. Result of comparison models on data sets
|
Data Sets |
Methods |
DSC |
IoU |
|
Lung Segmentation |
Classic U-Net |
0.9473 |
0.9034 |
|
U-Net11(Proposed) |
0.9502 |
0.9154 |
|
|
ResBCDU-Net [43] |
0.9715 |
||
|
RU-Net [22] |
0.9493 |
||
|
Nuclei Segmentation |
Classic U-Net |
0.7830 |
0.7084 |
|
U-Net11(Proposed) |
0.8110 |
0.7190 |
|
|
ResNet50+Mask SSD [44] |
0.4763 |
||
|
U-Net+Deep Watershed Transform [44] |
0.5016 |
||
|
D-ResNet+Mask RCNN+PA [44] |
0.5440 |
||
|
Breast Cancer Segmentation |
Classic U-Net |
0.5520 |
0.3424 |
|
U-Net11(Proposed) |
0.6909 |
0.3610 |
U-Net11 is a novel method for image segmentation that we propose as an alternative to classical methods. As Table 2 shows, our method achieves higher DSC value and IoU score than classical methods on different data sets. Moreover, our method performs very well in IoU score according to the Data Science Bowl 2018 competition results, which demonstrates its effectiveness among other methods in the literature.
In this study, the performances of four different models (U-Net7, Classic U-Net, U-Net11, and U-Net13) were compared on various datasets. Through evaluations using metrics such as Dice Similarity Coefficient and Jaccard Index, it was observed that the U-Net11 model achieved the best results.
The proposed U-Net11 model achieved high DSC scores on three datasets: 69.09% for cancer segmentation in the breast cancer dataset, 95.02% for organ segmentation in the lung segmentation dataset, and 81.10% for cell tissue class in the nuclei segmentation dataset.
The datasets are carefully selected and contain different types of segmentation, while the data size varies from small to large. As the number of layers increases, the probability of memorization in the model increases, while the number of layers is decreased, the success rate decreases significantly.
The U-Net11 model had higher Dice Coefficient and Jaccard Index values than other models, both in the training and test datasets. This indicates that the proposed model is effective in biomedical image segmentation. Furthermore, when compared to other methods in the literature, the U-Net11 model demonstrated superior performance. As a result of these studies, it is recommended to increase the number of layers from 9 in the classical U-Net model to 11 and this method can be used as an alternative to the classical U-Net model.
[1] Liu, S., Qi, L., Qin, H., Shi, J., Jia, J. (2018). Path aggregation network for instance segmentation. In Proceedings of the IEEE Conference on Computer Vision and Pattern Recognition, pp. 8759-8768. https://doi.org/10.1109/CVPR.2018.00913
[2] Wang, P., Chen, P., Yuan, Y., Liu, D., Huang, Z., Hou, X., Cottrell, G. (2018). Understanding convolution for semantic segmentation. In 2018 IEEE Winter Conference on Applications of Computer Vision (WACV), pp. 1451-1460. https://doi.org/10.1109/WACV.2018.00163
[3] He, K., Gkioxari, G., Dollár, P., Girshick, R. (2020). Mask r-cnn. In IEEE Transactions on Pattern Analysis and Machine Intelligence, 42(2): 386-397. https://doi.org/10.1109/TPAMI.2018.2844175
[4] Kirillov, A., Levinkov, E., Andres, B., Savchynskyy, B., Rother, C. (2017). Instancecut: From edges to instances with multicut. In Proceedings of the IEEE Conference on Computer Vision and Pattern Recognition, pp. 5008-5017. https://doi.org/10.1109/CVPR.2017.774
[5] Long, J., Shelhamer, E., Darrell, T. (2015). Fully convolutional networks for semantic segmentation. In Proceedings of the IEEE Conference on Computer Vision and Pattern Recognition, pp. 3431-3440. https://doi.org/10.1109/CVPR.2015.7298965
[6] Girshick, R., Donahue, J., Darrell, T., Malik, J. (2014). Rich feature hierarchies for accurate object detection and semantic segmentation. In Proceedings of the IEEE Conference on Computer Vision and Pattern Recognition, pp. 580-587. https://doi.org/10.1109/CVPR.2014.81
[7] Ronneberger, O., Fischer, P., Brox, T. (2015). U-net: Convolutional networks for biomedical image segmentation. In Medical Image Computing and Computer-Assisted Intervention–MICCAI 2015: 18th International Conference, Munich, Germany, October 5-9, 2015, Proceedings, Part III 18, Springer International Publishing, pp. 234-241. https://doi.org/10.1007/978-3-319-24574-4_28
[8] Chen, L.C., Papandreou, G., Kokkinos, I., Murphy, K., Yuille, A.L. (2017). Deeplab: Semantic image segmentation with deep convolutional nets, atrous convolution, and fully connected crfs. IEEE Transactions on Pattern Analysis and Machine Intelligence, 40(4): 834-848. https://doi.org/10.1109/TPAMI.2017.2699184
[9] Weng, W., Zhu, X. (2021). INet: Convolutional networks for biomedical image segmentation. IEEE Access, 9: 16591-16603. https://doi.org/10.1109/ACCESS.2021.3053408
[10] Mendi, G., Budak, C. (2021). Automatic Cell Nucleus Segmentation Using Superpixels and Clustering Methods in Histopathological Images. Balkan Journal of Electrical and Computer Engineering, 9(3): 304-309. https://doi.org/10.17694/bajece.864266
[11] Peng, C., Zhang, X., Yu, G., Luo, G., Sun, J. (2017). Large kernel matters-improve semantic segmentation by global convolutional network. In Proceedings of the IEEE Conference on Computer Vision and Pattern Recognition, pp. 4353-4361 https://doi.org/10.1109/CVPR.2017.189
[12] Liu, Z., Cao, Y., Wang, Y., Wang, W. (2019). Computer vision-based concrete crack detection using U-net fully convolutional networks. Automation in Construction, 104: 129-139. https://doi.org/10.1016/j.autcon.2019.04.005
[13] Dong, H., Yang, G., Liu, F., Mo, Y., Guo, Y. (2017). Automatic brain tumor detection and segmentation using U-Net based fully convolutional networks. In Medical Image Understanding and Analysis: 21st Annual Conference, MIUA 2017, Edinburgh, UK, July 11-13, 2017, Proceedings, Springer International Publishing, 21: 506-517. https://doi.org/10.1007/978-3-319-60964-5_44
[14] Falk, T., Mai, D., Bensch, R., Çiçek, Ö., Abdulkadir, A., Marrakchi, Y., Böhm, A., Deubner, J., Jäckel, Z., Seiwald, K., Dovzhenko, A., Tietz, O., Bosco, C.D., Walsh, S., Saltukoglu, D., Tay, T.L., Prinz, M., Palme, K., Simons, M., Simons, M., Diester, I., Brox, T., Ronneberger, O. (2019). U-Net: Deep learning for cell counting, detection, and morphometry. Nature Methods, 16(1): 67-70. https://doi.org/10.1038/s41592-018-0261-2
[15] Sevastopolsky, A. (2017). Optic disc and cup segmentation methods for glaucoma detection with modification of U-Net convolutional neural network. Pattern Recognition and Image Analysis, 27: 618-624. https://doi.org/10.1134/S1054661817030269
[16] Livne, M., Rieger, J., Aydin, O.U., Taha, A.A., Akay, E. M., Kossen, T., Sobesky, J., Kelleher, J.D., Hildebrand, K., Frey, D., Madai, V.I. (2019). A U-Net deep learning framework for high performance vessel segmentation in patients with cerebrovascular disease. Frontiers in Neuroscience, 13: 97. https://doi.org/10.3389/fnins.2019.00097
[17] Han, M., Bao, Y., Sun, Z., Wen, S., Xia, L., Zhao, J., Du, J., Yan, Z. (2019). Automatic segmentation of human placenta images with U-Net. IEEE Access, 7: 180083-180092. https://doi.org/10.1109/ACCESS.2019.2958133
[18] Kurata, Y., Nishio, M., Kido, A., Fujimoto, K., Yakami, M., Isoda, H., Togashi, K. (2019). Automatic segmentation of the uterus on MRI using a convolutional neural network. Computers in Biology and Medicine, 114: 103438. https://doi.org/10.1016/j.compbiomed.2019.103438
[19] Park, J., Yun, J., Kim, N., Park, B., Cho, Y., Park, H.J., Song, M., Lee, M., Seo, J.B. (2020). Fully automated lung lobe segmentation in volumetric chest CT with 3D U-Net: validation with intra-and extra-datasets. Journal of Digital Imaging, 33: 221-230. https://doi.org/10.1007/s10278-019-00223-1
[20] Zhou, Z., Siddiquee, M.M.R., Tajbakhsh, N., Liang, J.U. A nested U-Net architecture for medical image segmentation (2018). Deep Learning in Medical Image Analysis and Multimodal Learning for Clinical Decision Support. arXiv preprint arXiv:1807.10165. https://doi.org/10.1007/978-3-030-00889-5
[21] Diakogiannis, F.I., Waldner, F., Caccetta, P., Wu, C. (2020). ResUNet-a: A deep learning framework for semantic segmentation of remotely sensed data. ISPRS Journal of Photogrammetry and Remote Sensing, 162: 94-114. https://doi.org/10.1016/j.isprsjprs.2020.01.013
[22] Zhang, Z., Liu, Q., Wang, Y. (2018). Road extraction by deep residual u-net. IEEE Geoscience and Remote Sensing Letters, 15(5): 749-753. https://doi.org/10.1109/LGRS.2018.2802944
[23] Alom, M.Z., Hasan, M., Yakopcic, C., Taha, T.M., Asari, V.K. (2018). Recurrent residual convolutional neural network based on u-net (r2u-net) for medical image segmentation. Computer Vision and Pattern Recognition arXiv preprint arXiv:1802.06955. https://doi.org/10.48550/arXiv.1802.06955
[24] Oktay, O., Schlemper, J., Folgoc, L.L., Lee, M., Heinrich, M., Misawa, K., Mori, K., McDonagh, S., Hammerla, N. Y., Kainz, B., Glocker, B., Rueckert, D. (2018). Attention u-net: Learning where to look for the pancreas. arXiv preprint arXiv:1804.03999. https://doi.org/10.48550/arXiv.1804.03999
[25] Ibtehaz, N., Rahman, M.S. (2020). MultiResUNet: Rethinking the U-Net architecture for multimodal biomedical image segmentation. Neural networks, 121: 74-87. https://doi.org/10.1016/j.neunet.2019.08.025
[26] Zhuang, J. (2018). LadderNet: Multi-path networks based on U-Net for medical image segmentation. arXiv preprint arXiv:1810.07810. https://doi.org/10.48550/arXiv.1810.07810
[27] Iglovikov, V., Shvets, A. (2018). Ternausnet: U-net with vgg11 encoder pre-trained on imagenet for image segmentation. arXiv preprint arXiv:1801.05746. Computer Vision and Pattern Recognition. https://doi.org/10.48550/arXiv.1801.05746
[28] Stoller, D., Ewert, S., Dixon, S. (2018). Wave-u-net: A multi-scale neural network for end-to-end audio source separation. arXiv preprint arXiv:1806.03185. In the proceedings of the 19th International Society for Music Information Retrieval Conference (ISMIR 2018). https://doi.org/10.48550/arXiv.1806.03185
[29] Meseguer-Brocal, G., Peeters, G. (2019). Conditioned-U-Net: Introducing a control mechanism in the U-Net for multiple source separations. arXiv preprint arXiv:1907.01277. Proceedings of the 20th International Society for Music Information Retrieval Conference, ISMIR, Delft, Netherlands. https://doi.org/10.48550/arXiv.1907.01277
[30] Ma, K., Shu, Z., Bai, X., Wang, J., Samaras, D. (2018). Docunet: Document image unwarping via a stacked u-net. In Proceedings of the 2018 IEEE Conference on Computer Vision and Pattern Recognition, pp. 4700-4709. https://doi.org/10.1109/CVPR.2018.00494
[31] Isensee, F., Jaeger, P.F., Kohl, S.A., Petersen, J., Maier-Hein, K.H. (2021). nnU-Net: a self-configuring method for deep learning-based biomedical image segmentation. Nature Methods, 18(2): 203-211. https://doi.org/10.1038/s41592-020-01008-z
[32] Olimov, B., Sanjar, K., Din, S., Ahmad, A., Paul, A., Kim, J. (2021). FU-Net: fast biomedical image segmentation model based on bottleneck convolution layers. Multimedia Systems, 1-14. https://doi.org/10.1007/s00530-020-00726-w
[33] Wang, Z., Zou, N., Shen, D., Ji, S. (2020). Non-local u-nets for biomedical image segmentation. In Proceedings of the AAAI Conference on Artificial Intelligence, 34(04): 6315-6322. https://doi.org/10.1609/aaai.v34i04.6100
[34] Qin, X., Wu, C., Chang, H., Lu, H., Zhang, X. (2020). Match Feature U-Net: Dynamic receptive field networks for biomedical image segmentation. Symmetry, 12(8): 1230. https://doi.org/10.3390/sym12081230
[35] Caicedo, J.C., Goodman, A., Karhohs, K.W., Cimini, B. A., Ackerman, J., Haghighi, M., Heng, C., Becker, T., Doan, M., McQuin, C., Rohban, M., Singh, S., Carpenter, A.E. (2019). Nucleus segmentation across imaging experiments: The 2018 Data Science Bowl. Nature Methods, 16(12): 1247-1253. https://doi.org/10.1038/s41592-019-0612-7
[36] Xu, Z., Wang, S., Stanislawski, L.V., Jiang, Z., Jaroenchai, N., Sainju, A.M., Shavers, E., Usery, E.L., Chen, L., Li, Z., Su, B. (2021). An attention U-Net model for detection of fine-scale hydrologic streamlines. Environmental Modelling & Software, 140: 104992. https://doi.org/10.1016/j.envsoft.2021.104992
[37] Özkan, İ.N.İ.K., Ülker, E. (2017). Derin öğrenme ve görüntü analizinde kullanılan derin öğrenme modelleri. Gaziosmanpaşa Bilimsel Araştırma Dergisi, 6(3): 85-104.
[38] Budak, C., Mençik, V. (2022). Detection of ring cell cancer in histopathological images with region of interest determined by SLIC superpixels method. Neural Computing and Applications, 34(16): 13499-13512. https://doi.org/10.1007/s00521-022-07183-8
[39] Ioffe, S., Szegedy, C. (2015). Batch normalization: Accelerating deep network training by reducing internal covariate shift. In International Conference on Machine Learning, PMLR, pp. 448-456.
[40] Budak, C., Mençik, V., ASKER, M.E. (2021). Effect on model performance of regularization methods. Dicle Üniversitesi Mühendislik Fakültesi Mühendislik Dergisi, 12(5): 757-765. https://doi.org/10.24012/dumf.1051352
[41] Qin, Q., Wang, K., Xu, H., Cao, B., Zheng, W., Jin, Q., Cui, D. (2020). Deep learning on chromatographic data for segmentation and sensitive analysis. Journal of Chromatography A, 1634: 461680. https://doi.org/10.1016/j.chroma.2020.461680
[42] Yeung, M., Sala, E., Schönlieb, C.B., Rundo, L. (2022). Unified focal loss: Generalising dice and cross entropy-based losses to handle class imbalanced medical image segmentation. Computerized Medical Imaging and Graphics, 95, 102026. https://doi.org/10.1016/j.compmedimag.2021.102026
[43] Jalali, Y., Fateh, M., Rezvani, M., Abolghasemi, V., Anisi, M.H. (2021). ResBCDU-Net: A deep learning framework for lung CT image segmentation. Sensors, 21(1): 268. https://doi.org/10.3390/s21010268
[44] Wang, E.K., Zhang, X., Pan, L., Cheng, C., Dimitrakopoulou-Strauss, A., Li, Y., Zhe, N. (2019). Multi-path dilated residual network for nuclei segmentation and detection. Cells, 8(5): 499. https://doi.org/10.3390/cells805049