Fatima Guendouzi*![]() | Mokhtar Attari
| Mokhtar Attari![]()
© 2023 IIETA. This article is published by IIETA and is licensed under the CC BY 4.0 license (http://creativecommons.org/licenses/by/4.0/).
OPEN ACCESS
Premature ventricular contraction (PVC) is among the most prevalent forms of arrhythmia diagnosed in clinical settings. Arrhythmias can be recognised by analysing the ECG signal. However, it takes a lot of time for cardiologists to analyse these long-term ECG signals. The fast and accurate identification of PVCs is crucial in the treatment of cardiac diseases Here; we propose a simple and promising method for detecting PVCs in long-term ECG signals. The method is based on Chebyshev polynomial coefficients and the k-nearest neighbour (KNN) Classifier. The proposed approach has been experienced on the MIT-BIH Arrhythmia Database and the results of the experiments indicate high levels of accuracy, sensitivity, and specificity, with a 99.35% accuracy rate, 99.86% sensitivity rate, and 85.11% specificity rate. The results are highly pleasing, taking into account the straightforwardness of the classification system. It is possible that the suggested approach to classification could serve as an effective means of diagnosing arrhythmias.
Chebyshev polynomials, classification, electrocardiogram (ECG), K-nearest neighbour (KNN), premature ventricular contraction (PVC)
Ventricular ectopic beats, also known as premature ventricular contractions (PVCs), happen prior to the normal sinus rhythm (NSR) [1]. An early beat featuring an abnormal QRS complex, and lacking a preceding P wave, is a distinguishing feature of PVCs [2]. This pattern can be random or occur at definite intervals. This topic is very interesting since PVCs are early indicators of cardiac depolarisation issues, and can sometimes predict harmful arrhythmias.
Researchers in analysing and classifying ECG signals often use algorithms and techniques to simulate the thinking of a cardiology expert. ECG modelling has a wide range of applications, including signal compression, noise filtering, and feature extraction for arrhythmia classification.
Many studies have focused on ECG signal modelling, including those using sequential Bayesian methods [3], extended Kalman filter [4], and segment dictionary and Bezier curve approximation [5]. In the same context, Baali et al. [6] proposed a new technique for electrocardiogram (ECG) signal analysis. The authors propose a parametric modelling approach that maps ECG heartbeats into the singular value domain using a linear predictive coding (LPC) filter. ECG signals have also been modelled as a sum of Hermite or Gaussian functions due to their similarities with the QRS complex. Various techniques have been put forth, such as, Laguna et al.’s Adaptive Hermite Model Estimation System (AHMES) [7], Lagerholm et al.’s method of decomposing the QRS complex into Hermite basis functions [8]. Clifford and Villarroel use of Gaussian functions to model ECG signals [9], and Nunes and Nait-Ali approach of approximating QRS complex waves through the Hilbert transform and low-order polynomial approximation [10]. While Chebyshev polynomials are commonly used in spectral methods and mathematical interpolation, but their application to ECG modelling is rarely found in the literature [11, 12].
ECG classification is a difficult task due to the significant variations in ECG signals for different patients. In recent years, several algorithms for ECG classification, heartbeat detection, and diagnosis have been proposed [13-16]. The PhysioNet/CINC 2020 and 2021 Challenges [17, 18] provide an opportunity to discuss the complexities of ECG classification from several perspectives and the impact of analysing large numbers of leads. Algorithms for ECG classification can be divided into two groups: morphology-based methods [1, 13-15, 19-23] and deep learning-based methods [16, 24-30].
Morphology-based methods use the shape of the ECG waveform to classify heartbeats, including neural networks with selected features [13], fuzzy expert systems [14, 15]. These methods achieve high accuracy in recognising PVC arrhythmias and different heart rhythms. Rizal et al. employed a technique based on multilevel wavelet entropy to differentiate premature ventricular contraction (PVC) beats [19]. Jenny et al. [1] utilised Independent Component Analysis (ICA) to extract features, which is one of the most reliable techniques in this domain and is based on the assumption that most measured signals must be mixtures of independent signals. Dong et al. [20] proposed a wavelet transform and a support vector machine (SVM) algorithm for classifying PVCs. De Oliveira et al. [21] suggested a PVC detection method that involves extracting a simplified set of features based on geometric shapes of QRS complexes in ECG signals. Talbi and Ravier [22] used fractional linear prediction for PVC recognition. Xie et al. [23] suggested a PVC detection method that combines features and a random forest algorithm.
While morphological-based techniques have produced favorable outcomes, they possess certain drawbacks like dependency on ECG technical expertise and inconsistency in feature extraction.
Conversely, the use of deep learning has been prevalent in identifying PVCs in ECG signals and several investigations have demonstrated various deep learning approaches. An example of this is the use of one-dimensional convolutional neural networks (CNNs) for feature extraction and the identification of PVCs via supervised learning [16]. Yu et al. [24] used deep metric learning and a k-nearest neighbours (KNN) classifier to detect PVCs in long-term ECG signals, while Zhou et al. [25] employed a recurrent neural network featuring long short-term memory to identify PVCs in ECG signals. In another study, Zhao et al. [26] integrated the modified frequency slice wavelet transform (MFSWT) with CNN for the detection of PVCs. Li et al. [27] created a method for detecting ventricular ectopic beats (VEBs) using a combination of three types of ECG wavelet transforms and CNN. Hoang et al. [28] combined wavelet fusion and Tucker-decomposition with a CNN classifier to detect PVCs using multiple ECG combinations from 12-lead ECGs applied to wearable devices. Liu et al. [29] created a deep learning program to identify PVCs in children’s ECG. The model incorporates both the tuned inception V3 model with 2D waveform data and the 1D CNN model with time-series data, resulting in effective detection of PVCs and the ability to automatically extract and identify ECG features. Gordon and Williams [30] used autoencoder architecture based on convolutional layers to extract and select features, and a random forest classifier to discriminate PVC beats automatically. Al Rahhal et al. [31] employed stacked denoising autoencoder (SDA) and DNN classifiers to identify PVCs from multilead ECG signals.
However, the deep learning approach has some limitations compared to manual feature engineering. The computational complexity of deep learning methods is higher, and the features extracted by the system lack clear and unambiguous physical or medical meaning. Furthermore, there is no guarantee that training on different ECG data will produce homogeneous features, meaning retraining the convolutional autoencoder would also require retraining the final classifier [30]. The effectiveness of PVC detection methods based on deep learning is slightly lower compared to those using manual feature engineering [28, 29].
According to the literature, a majority of the approaches have a restricted rate of success, and certain methods are overly complicated for practical use. Additionally, some use high-dimensional features that are challenging to visualise and understand, and may not provide enough discrimination for detecting PVC heartbeats.
The purpose of this research is to assess the efficacy of Chebyshev polynomials in ECG signal modelling and demonstrate the usefulness of the derived coefficients in classifying PVC arrhythmias.
Specifically, the proposed method introduced the Chebyshev polynomial transform into PVC detection for the first time, although the interpretation of the polynomial coefficients could potentially correlate with specific medical conditions, thus creating a fresh challenge for automatic diagnosis and PVC detection. This is the reason why this article put forth a fresh strategy that employs Chebyshev polynomial transforms and the k-nearest neighbour (KNN) classifier to differentiate premature ventricular contraction (PVC) arrhythmias. To address this, tests are performed using electrocardiogram signals obtained from the MIT-BIH Arrhythmia Database.
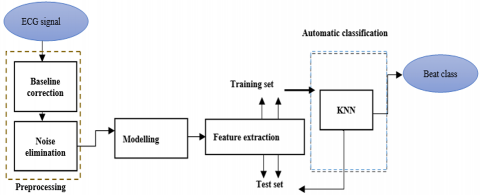
The paper introduces an innovative approach to improve the ECG heartbeat classification results. The focus of this method is to distinguish between premature ventricular contractions (PVC) and normal heartbeats, using Chebyshev polynomial coefficients as features and a k-nearest neighbour (KNN) classifier. The technique is comprised of four stages: pre-processing, modelling, feature extraction, and automatic classification. All of these steps are depicted in Figure 1.
Figure 1. Block diagram of the suggested ECG heartbeat classification system
2.1. ECG signals pre-processing
The ECG records are susceptible to interference and noise caused by skin electrodes. To address this, pre-processing is done to eliminate noise with a low and high frequency. This is achieved through a band pass filter that includes: (1) a moving average to remove power-line interference, (2) a low-pass filter to suppress electromyography noise, and (3) a high-pass recursive filter for drift elimination.
2.2 Modelling and feature extraction
In this work, we use the first type of Chebyshev polynomials, which are characterised by the subsequent recurrence relation in the interval [-1, 1]:
$T_{n+1}(x)=2 x T_n(x)-T_{n-1}(x)$ for $n \geq 1$ (1)
where, $T_0(x)=1$ and $T_1(x)=x$.
In the interval [-1, 1], they constitute a complete orthogonal set with respect to the weighting function $w(x)=1 / \sqrt{\left(1-x^2\right)}$. Additionally, they also satisfy a discrete orthogonal relation, which states that if $\mathrm{x}_{\mathrm{k}}(\mathrm{k}=1,2, \ldots, \mathrm{m})$ are the m zeros of $\mathrm{T}_{\mathrm{m}}(\mathrm{x})$, and if $\mathrm{i}, \mathrm{j}<m$, then:
$\sum_{\mathrm{k}=1}^{\mathrm{m}} \mathrm{T}_{\mathrm{i}}\left(x_k\right) \mathrm{T}_j\left(x_k\right)= \begin{cases}0 & \text { if } \mathrm{i} \neq \mathrm{j} \\ \mathrm{m} / 2 & \text { if } \mathrm{i}=\mathrm{j} \neq 0 \\ \mathrm{~m} & \text { if } \mathrm{i}=\mathrm{j}=0\end{cases}$ (2)
The definition of the Chebyshev polynomials in trigonometric form is expressed as:
$T_n(x)=\cos \left(n \cos ^{-1}(x)\right)$ (3)
The roots of the Chebyshev polynomials of the first type, which are commonly known as the Chebyshev nodes, are obtained from Eq. (3) as $\mathrm{T}_{\mathrm{n}}\left(\mathrm{x}_{\mathrm{j}}\right)=\cos \left(\arccos \left(\mathrm{x}_{\mathrm{j}}\right)\right)=0$, indicating that:
$x_j=\cos \left(\pi \frac{2 j-1}{2 n}\right), 1 \leq j \leq n$ (4)
In [-1, 1], $\mathrm{T}_{\mathrm{n}}(\mathrm{x})$ has exactly n unique zeros. These nodes are particularly useful in numerical analysis, as they are used to construct the Chebyshev-Gauss-Lobatto quadrature rule. The extreme of $\mathrm{T}_{\mathrm{n}}(\mathrm{x})$ are also resulting from Eq. (3) as $\mathrm{T}_{\mathrm{n}}\left(y_j\right)=\cos \left(\arccos \left(y_j\right)\right)= \pm 1$, where $\mathrm{y}_{\mathrm{j}}$ are the roots of $\mathrm{T}_{\mathrm{n}}(\mathrm{x})$, thus:
$y_j=\cos \left(\pi \frac{j}{n}\right), 1 \leq j \leq n$ (5)
As a result, it is feasible to represent the signal s(t) in the form of a Chebyshev polynomial series as follows:
$s(t)=\sum_{\mathrm{k}=0}^{\mathrm{n}} \mathrm{c}_{\mathrm{k}} \mathrm{T}_{\mathrm{k}}(\mathrm{t})$ (6)
The coefficients $c_k$ are calculated as follows:
$\mathrm{c}_{\mathrm{k}}=\frac{\left\langle\mathrm{s}, \mathrm{T}_{\mathrm{k}}\right\rangle}{\left\langle\mathrm{T}_{\mathrm{k}}, \mathrm{T}_{\mathrm{k}}\right\rangle}=\frac{1}{\mathrm{~d}_{\mathrm{k}}^2} \int_{-1}^1 \frac{\mathrm{s}(\mathrm{t}) \mathrm{T}_{\mathrm{k}}(\mathrm{t})}{\sqrt{1-\mathrm{t}^2}} \mathrm{dt}$ (7)
where, $\mathrm{d}_{\mathrm{k}}^2=\left\{\begin{array}{ccc}\pi & \text { if } & \mathrm{k}=0 \\ \pi / 2 & \text { if } & \mathrm{k} \geq 1\end{array}\right.$
Applying the Gauss-Lobatto integration method [32] on Chebyshev polynomials:
$\int_{-1}^1 \frac{s(t) T_k(t)}{\sqrt{1-t^2}} d t=\frac{\pi}{n} \sum_{j=1}^n s\left(x_j\right) T_k\left(x_j\right)$ (8)
where, $\mathrm{x}_{\mathrm{j}}$ are the roots of $\mathrm{T}_{\mathrm{n}}(\mathrm{t})$. All Christoffel numbers are equal to $\pi / 2$.
To calculate $\mathrm{c}_{\mathrm{k}}$ in Eq. (7), we use the zeros of $\mathrm{T}_{\mathrm{n}+1}:$
$c_k=\frac{2}{n+1} \sum_{j=1}^{n+1} s\left(x_j\right) \cos \left(\frac{k(2 j-1) \pi}{2(n+1)}\right)$
$=\frac{2}{n+1} \sum_{j=1}^{n+1} s\left(\cos \left(\frac{k(2 j-1)}{2(n+1)}\right)\right) \cos \left(\frac{k(2 j-1) \pi}{2(n+1)}\right)$ (9)
for 1≤k≤n and
$c_0=\frac{1}{n+1} \sum_{j=1}^{n+1} s\left(x_j\right)=\frac{1}{n+1} \sum_{j=1}^{n+1} s\left(\cos \left(\frac{\pi(2 j-1)}{2(n+1)}\right)\right)$ (10)
During the initial stage of decomposition, the ECG signal is initially split into blocks, and each block is then transposed into the Chebyshev polynomial domain [-1, 1] as follows:
$x=-1+\frac{2}{t_B}$ (11)
where, $t_B$ is the duration of the signal segment.
The trigonometric form of the Chebyshev polynomials simplifies coefficient computation. A detailed description of the signal decomposition through Chebyshev polynomials series can be found in the study [11].
The next stage is the modelling mechanism that encompasses the determination of polynomial coefficients corresponding to every signal segment. The last stage is signal reconstruction, which includes signal synthesis and block assembly.
We use the percentage of the root mean square difference (PRD) to assess the model’s quality as follows:
$\operatorname{PRD}=100 \sqrt{\frac{\sum_{\mathrm{n}}\left(\mathrm{s}_{\mathrm{n}}-\hat{\mathrm{s}}_{\mathrm{n}}\right)^2}{\sum_{\mathrm{n}} \mathrm{s}_{\mathrm{n}}^2}}$ (12)
where, s(n) represents the initial signal and $\hat{\mathrm{s}}(\mathrm{n})$ represents the reconstructed signal.
PRD is a statistic that assesses a model’s overall quality across all data points, with the objective of measuring the quantity of diagnostic information maintained in the model’s features after modelling ECG raw.
In the context of the current study, the input to the KNN algorithm is the Chebyshev polynomial coefficients $\mathrm{c}_{\mathrm{k}}$, which are calculated for each heartbeat. The algorithm uses these coefficients as features to classify each heartbeat as normal or PVC.
2.3 Classification using KNN
The k-nearest neighbours (KNN) algorithm is a simple type of supervised machine learning technique that is capable of resolving both classification and regression problems. This approach locates the k-nearest neighbours in the feature space to the input data point and using the consensus of these neighbours to classify the input point. Therefore, selecting the k parameter in the KNN algorithm is critical and should be done carefully. In this study, the k nearest neighbours value was varied between 1 to 10, and the best accuracy was achieved with k=1.
The KNN algorithm provides the benefit of filtering out irrelevant data, which can enhance the precision of detecting PVC.
The KNN classifier’s effectiveness was measured by employing multiple performance measures like sensitivity (SE), specificity (SP), and accuracy (ACC) to appraise the classification outcomes’ excellence:
Accuracy $=\mathrm{ACC}=\frac{\mathrm{TP}+\mathrm{TN}}{\mathrm{TP}+\mathrm{FN}+\mathrm{TN}+\mathrm{FP}} \times 100$ (13)
Specificity $=\mathrm{SP}=\frac{\mathrm{TN}}{\mathrm{TN}+\mathrm{FP}} \times 100$ (14)
Sensitivity $=\mathrm{Se}=\frac{\mathrm{TP}}{\mathrm{TP}+\mathrm{FN}} \times 100$ (15)
here, the abbreviations TP refer to true positives, TN refer to true negatives, FP refer to false positives, and FN refer to false negatives.
2.4 Data information and visualization
The MIT-BIH Arrhythmia Database [33] is a well-respected benchmark for evaluating arrhythmia detection. It comprises 48 Holter recordings from 25 male and 22 female subjects, each slightly over 30 minutes long and recorded with two leads (upper and lower signals). Every record in the MIT-BIH Arrhythmia Database contains a pair of signal channels sampled at 360Hz with a precision of (11 bits)/sample. We exclusively utilised the MLII electrode signal from the database. Note that records 201 and 202 come from a single male participant, while the remaining entries are from distinct individuals. This database is highly valued by researchers for its comprehensive annotations, made by multiple cardiologists, and the large number of records it offers.
According to AAMI (Association for the Advancement of Medical Instrumentation) standards, ECG beats are divided into five super classes depending on the ECG signal origin: N (normal or bundle branch block), S (supraventricular abnormal beats), V (ventricular abnormal beats), F (fusion beats), and Q (unclassified beats).
In this work, during the classification phase, the fusion beat (F) and the Q (unclassified beats) are excluded. Table 1 assigns the eleven classes to the normal and PVC groups. We propose four schemes for dividing the remaining ECG records to assess the efficiency of the proposed techniques. Table 2 displays the data divided into test and training groups. The majority scholars adopted scheme 1, which was recommended by AAMI and can ensure an equitable comparison between our suggested method and other related studies. In scenarios where the training set has more samples than the test set, it is feasible to utilise Schemes 2, 3, and 4 to evaluate the efficacy of the proposed method. Where N and V denote the numbers of normal and PVC beats in each dataset, respectively.
To ensure that the suggested approach is appropriate for the variances in ECG rhythm and its morphological alterations, twelve classes (4 super classes) recommended by the AAMI are included in the modelling evaluation, while the Q (unclassified beats) are excluded. The simulation results of modelling using the MATLAB® environment are reported in Table 3.
Table 1. Displays the annotations for the MIT/BIH database and the distribution of the annotated beats among different groups
|
MIT/BIH annotation |
Description |
Class |
|
V |
Premature ventricular contraction |
Class PVC |
|
E |
Ventricular escape beat |
Class PVC |
|
N |
Normal beat |
Class normal |
|
L |
Left bundle branch block beat |
Class normal |
|
R |
Right bundle branch block beat |
Class normal |
|
e |
Atrial escape beat |
Class normal |
|
j |
Nodal (junctional) escape beat |
Class normal |
|
A |
Atrial premature beat |
Class normal |
|
a |
Aberrated atrial premature beat |
Class normal |
|
J |
Nodal (junctional) premature beat |
Class normal |
|
S |
Supraventricular premature or ectopic beat |
Class normal |
Table 2. The method of detailed division of datasets into test and training groups
|
Scheme |
Dataset |
Records |
N |
V |
|
Scheme 1 |
Training set (DS1) |
101, 106, 108, 109, 112, 114, 115, 116, 118, 119, 122, 124, 201, 203, 205, 207, 208, 209, 215, 220, 223, 230 |
35,640 |
2,851 |
|
Test set (DS2) |
100, 103, 105, 111, 113, 117, 121, 123, 200, 202, 210, 212, 213, 214, 219, 221, 222, 228, 231, 232, 233, 234 |
46,096 |
3,221 |
|
|
Scheme 2 |
Training set (DS1) |
100, 103, 105, 106, 108, 109, 111, 113, 114, 116, 118, 119, 121, 123, 124, 200, 201, 202, 203, 205, 207, 208, 209, 210, 212, 213, 214, 215, 219, 222, 223, 228, 230, 231, 232, 234 |
53,279 |
4,277 |
|
Test set (DS2) |
101, 112, 115, 117, 122, 220, 221, 233 |
16,682 |
1,227 |
|
|
Scheme 3 |
Training set (DS1) |
100, 101, 103, 105, 106, 108, 109, 111, 112, 113, 114, 115, 117, 118, 119, 121, 122, 123, 124, 200, 201, 202, 203, 207, 208, 209, 210, 212, 213, 214, 215, 219, 220,222, 223, 228, 230, 231, 232, 233, 234 |
62,706 |
4,862 |
|
Test set (DS2) |
116, 205, 221 |
6,908 |
576 |
|
|
Scheme 4 |
Training set (DS1) |
103, 105, 106, 108, 109, 111, 112, 114, 115, 117,118, 119, 121, 122, 123, 124, 200, 201, 202,208,210,214, 231,234 |
47,567 |
3,662 |
|
Test set (DS2) |
100,101,102,104,113,116,122,205,209,212,215,220,221,222,228, 230,232 |
34,783 |
1,111 |
The effectiveness of the technique depends on the capability of the polynomial to accurately approximate the signal. In order to evaluate this, Chebyshev polynomials were tested using signals from the MIT-BIH Arrhythmia Database [33].
The evaluation results are presented below. A total of 518 beats were taken into account, with fifty beats from each class except for the SP and AE classes, where the overall number is only 16 and 2, respectively.
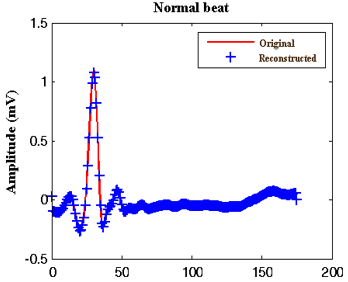
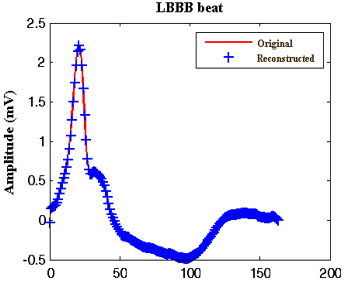
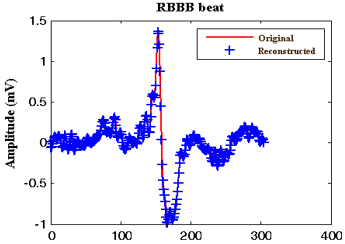
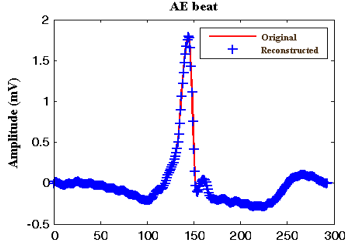
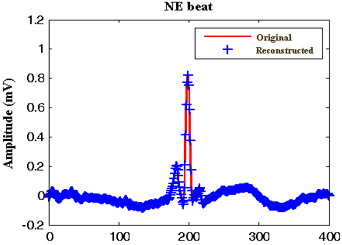
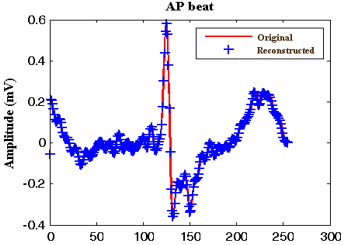
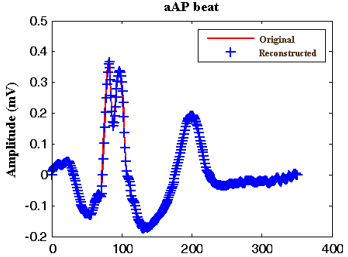
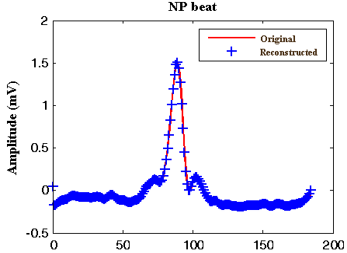
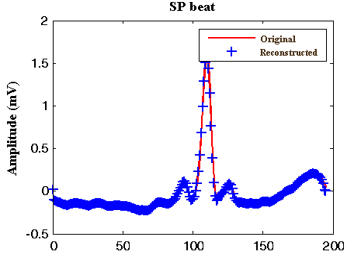
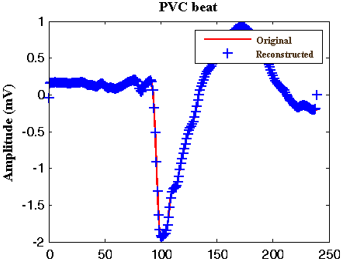
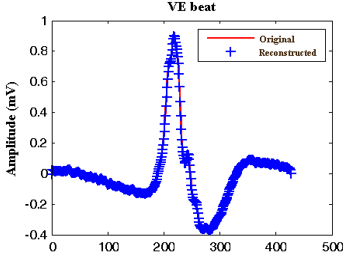
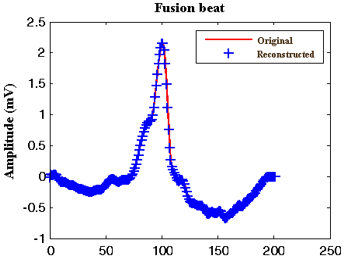
Overall results are summarised in Table 3, and Figure 2 displays examples of original signals (solid line) and their reconstructed versions (star line) for the twelve classes recommended by the AAMI.
Table 4 shows a comparison of modelling results between the raised algorithm and other approaches used in previous studies.
The current research study includes all types of arrhythmias recommended by AAMI. This is a continuation of our earlier research [12].
Notably, it is particularly challenging to provide a fair and objective comparison due to the diversity in the approaches used in previous studies. However, based on the statistical values presented in Table 4, the proposed method outperformed [6, 11] in terms of PRD, indicating that a significant improvement has been achieved. Talbi and Ravier [22] evaluated the modelling quality using the signal-to-error ratio (SER) and compared FLP coefficients to LP coefficients by calculating the SER values between predicted and original waves to assess the efficiency of FLP coefficients in modelling QRS complex waves.
Table 3 shows that the mean PRDs for all tested ECG heartbeats were relatively low, ranging from 2.01% for the LBBB class to 7.53% for the AAP class. The standard deviation (STD) was used to measure the dispersion of results around the mean values, and a low value of this measure indicates satisfactory results. The STD varies between 0.10 and 0.57 for different classes. In addition, the variations in PRD values between the N and SVEB categories are found to be higher than those between the VERBs and F categories.
Table 3. PRD of different classes of ECG signal
|
ECG Class |
ECG type |
MIT-BIH Label |
No. of beats |
Mean PRD (%) |
Max |
Min |
Std |
|
Beats originated in sinoatrial (SA) node (N) |
Nor |
1 |
50 |
6.81 |
7.51 |
2.58 |
0.20 |
|
LBBB |
2 |
50 |
2.01 |
2.22 |
1.44 |
0.43 |
|
|
RBBB |
3 |
50 |
3.73 |
4.11 |
2.61 |
0.32 |
|
|
AE |
34 |
16 |
4.90 |
8.82 |
2.63 |
0.37 |
|
|
NE |
11 |
50 |
5.82 |
7.63 |
3.40 |
0.10 |
|
|
Supraventricular ectopic beats (SVEBs) |
AP |
8 |
50 |
4.43 |
4.58 |
3.96 |
0.13 |
|
aAP |
4 |
50 |
7.53 |
9.36 |
2.43 |
0.16 |
|
|
NP |
7 |
50 |
6.65 |
13.38 |
1.96 |
0.32 |
|
|
SP |
9 |
2 |
5.50 |
6.02 |
4.99 |
0.28 |
|
|
Ventricular ectopic beats (VEBs) |
PVC |
5 |
50 |
3.22 |
3.57 |
2.45 |
0.57 |
|
VE |
10 |
50 |
3.06 |
3.52 |
2.29 |
0.23 |
|
|
Fusion beats (F) |
Fusion beats |
6 |
50 |
2.57 |
3.14 |
1.37 |
0.53 |
Table 4. Comparative study of modelling results using the suggested algorithm and previous works
|
Author |
Method |
Modelling application |
PRD (%) |
Mean (SER)±std (%) |
|
Talbi and Ravier [22] |
Fractional linear prediction |
Detection of PVC in ECG |
|
PVC 58.19±3.64 |
|
Other 56.70±2.21 |
||||
|
Baali et al. [6] |
Signal dependent orthogonal transform |
- |
Min 3.1545 PVC Max 10.8152 NE |
- |
|
Tchiotsop et al. [11] |
Orthogonal polynomials |
Compression of ECG signal CR=4.44 |
4.94 |
- |
|
This paper |
Chebyshev Polynomial |
PVC classification |
Min 2.01 LBBB Max 7.53 aAP |
- |
Table 5. Results of the arrhythmic beat classification using the k nearest neighbour classifier
|
|
Sensitivity (%) |
Specificity (%) |
Accuracy (%) |
|
Scheme 1 |
98.59 |
62.67 |
95.58 |
|
Scheme 2 |
98.69 |
54.86 |
94.15 |
|
Scheme 3 |
99.07 |
98.65 |
99.04 |
|
Scheme 4 |
99.86 |
85.11 |
99.35 |
|
(a) Normal |
(b) LBBB |
|
(c) RBBB |
(d) Ae |
|
(e) NE |
(f) AP |
|
(g) AAP |
(h) NP |
|
(i) SP |
(j) PVC |
|
(k) VE |
(l) Fusion |
|
Figure 2. Reconstructed ECG beats for all categories |
|
Table 6. Comparative analysis of modelling results using the suggested algorithm and previous works
|
Author |
Dataset |
Feature |
Classifier |
Results |
|
Mitra and Samanta [13] |
UCI database |
correlation-based, rough set theory feature subset selection (CFSS), Association Rules (AR), and principal component analysis (PCA) |
Incremental back propagation neural network (IBPLN) |
Accuracy: 87.71% |
|
Kaya and Pehlivan [34] |
Physionet 3500 normal 3500 PVC |
PCA, ICA, SOM |
KNN |
Accuracy: 99.63% Sensitivity: 99.29% Specificity: 99.89% |
|
Jenny et al. [1] |
Physionet 1000 normal 1000 PVC |
ICA, DWT |
C-Means (FCM) k-means and Fuzzy |
Accuracy: 80.94% Sensitivity: 81.10% Specificity: 80.1% |
|
Dong et al. [20] |
Physionet 8191 normal 1941 PVC |
Variance & entropy of wavelet coefficient, Continuous ECG beat R-R ratio, |
SVM |
Accuracy: 93.17% |
|
Rizal et al. [19] |
Physionet 6726 normal 2258 PVC |
Multilevel wavelet packet entropy |
SVM |
Accuracy: 94.9% |
|
Talbi and Ravier [22] |
Physionet 88,596 normal 7147 PVC |
Fractional linear prediction |
Neural network trained by levenberg–Marquardt rule |
Accuracy: 95.0% Sensitivity: 85.0% Specificity: 95.0% |
|
Xie et al. [23] |
Physionet 46539 normal 94112 PVC |
R amplitude PR interval QRS interval QT interval QRS area pre_RR interval post_RR interval |
Random forest (RF) |
Accuracy: 96.38% Sensitivity: 97.56% Specificity: 97.88% |
|
De Oliveira et al. [21] |
Physionet 150,534 normal 7224 PVC |
A set of geometrical features |
SVM |
Accuracy: 99% Sensitivity: 98.5% Specificity: 99.5% |
|
Yu et al. [16] |
Physionet Scheme 1 33,868 normal 2548 PVC Scheme 2 16,229 normal 1122 PVC Scheme 3 6802 normal 537 PVC |
Extract features with deep learning |
1D CNN |
Accuracy: 99.64% Sensitivity: 96.98% Specificity: 99.84% Accuracy: 100% Sensitivity: 100% Specificity: 100% Accuracy: 99.99% Sensitivity:99.81% Specificity:100% |
|
Yu et al. [24] |
Physionet 33,868 normal 2548 PVC |
Extract features with deep metric learning |
KNN |
Accuracy: 99.69% Sensitivity: 97.40% Specificity: 99.87% |
|
Zhou et al. [25] |
Physionet 75 normal 425 PVC |
Learned features automatically |
RNN |
Accuracy: 99% Sensitivity:99% Specificity: 96% |
|
Zhao et al. [26] |
Physionet 742 normal 775 PVC |
Learned features automatically from time-frequency images |
2D CNN |
Accuracy: 97.89% Sensitivity:98.58% Specificity: 97.17% |
|
Li et al. [27] |
Physionet 51043 normal 3633 PVC |
Learned features automatically from wavelet power spectrums |
2D CNN |
Accuracy: 97.96% Sensitivity:82.60% Specificity: 99.11% |
|
Gordon and Williams [30] |
Physionet 51042 normal 3633 PVC |
Learned features automatically by convolutional autoencoder |
RF |
Accuracy: 98.55% Sensitivity:91.41% Specificity: 99.06% |
|
Al Rahhal et al. [31] |
INCART database |
Learned features automatically by the stacked denoising autoencoders networks |
DNN |
Accuracy: 98.6% Sensitivity:91.4% Specificity: 93.9% |
|
Hoang et al. [28] |
St. Petersburg Institute of Cardiological Technics 569 normal 481 PVC |
Learned features automatically by the Wavelet fusion method, Tucker-decomposition |
2D CNN |
Accuracy: 90.84% Sensitivity:78.6% Specificity: 99.86% |
|
Liu et al. [29] |
Children’s Hospital of Shanghai. 1000 normal 1000 PVC |
Learned features automatically from waveform images |
2D CNN |
Accuracy: 88.5% |
|
This paper |
Physionet: Scheme 1 46096 normal 3221 PVC Scheme 2 16682 normal 1227 PVC Scheme 3 6908 normal 576 PVC Scheme 4 34783 normal 1111 PVC |
Chebyshev polynomial coefficients |
KNN |
Accuracy: 95.58% Sensitivity: 98.59% Specificity: 62.67% Accuracy: 94.15% Sensitivity: 98.69% Specificity: 54.86% Accuracy: 99.04% Sensitivity: 99.07% Specificity: 98.65% Accuracy: 99.35% Sensitivity: 99.86% Specificity: 85.11% |
In the second section, we evaluate the effectiveness of Chebyshev polynomial coefficients in distinguishing PVC arrhythmias, using a K-nearest neighbour classifier and the results are presented in Table 5. Table 6 compares the accuracy of the raised method with other approaches used in previous studies.
Table 5 illustrates that the suggested method exhibits superior performance in scheme 4 when compared to schemes 1, 2, and 3. However, schemes 2 and 3 can be used to assess the effectiveness of the suggested method when the number of training samples exceeds the number of test samples.
Considering Table 6, it is evident that the accuracy, sensitivity, and specificity of the suggested classification approach surpass those of Mitra and Samanta [13], Jenny et al. [1], Dong et al. [20], Rizal et al. [19], and Liu et al. [29].
Moreover, compared to Talbi et al. [22], Xie et al. [23], De Oliveira et al. [21], Zhou et al. [25], Zhao et al. [26], Li et al. [27], Gordon and Williams [30], Al Rahhal et al. [31], and Hoang et al. [28], the proposed classifier exhibits higher accuracy and sensitivity. This suggests that the proposed classification approach is better at distinguishing PVC beats compared to previous studies, even though those studies evaluated less record than the proposed method did [1, 25, 26, 28, 29].
In addition, the Zhou et al. [25] and Zhao et al. [26] classification methods present a higher specificity than the suggested approach. However, they considered a very small dataset; the authors of [25] used only 75 normal and 425 PVC heartbeats for the experiment. Similarly, the authors of [26] validated their system using only 742 normal and 775 PVC heartbeats.
On the other hand, the proposed approach was not superior to the references [16, 24, 34] in terms of specificity and accuracy. Second, the accuracy of the suggested approach is found to be good, with only 0.34% less than the reference [24].
Yu et al. [16] suggested a technique that employs a one-dimensional convolutional neural network (CNN) to identify PVC beats, which results in a high accuracy rate of 99.64%. Nevertheless, the technique requires the adjustment of numerous parameters, including kernel size and number, batch size, and activation functions (e. g. Sigmoid, Tanh). In addition, the number of layers frequently impacts the model’s complexity, which can affect the training process and make it time-consuming if the model’s complexity is either too high or too low.
In our study, a relatively large number of normal beats were incorrectly identified as PVC beats (a high number of false positives). This outcome may be attributed to the diverse morphologies in the normal beat class (such as LBBB, RBBB, etc.), as we classified PVC beats from all other beat types.
The proposed classification method yielded an accuracy of 99.35%, a sensitivity of 99.86%, and a specificity of 85.11%. These outcomes are highly pleasing given the straightforwardness of the classification scheme. Our results demonstrate that the suggested PVC classification technique offers comparable performance to other approaches while using a large amount of data from the MIT-BIH Arrhythmia Database. Furthermore, this approach can be extended to analyse other physiological signals, presenting new opportunities for research in this area.
A method for efficient ECG signal modelling of all twelve classes from the MIT-BIH database is suggested, with good results demonstrated in terms of PRDs and STDs. Additionally, a proposed method for clustering heartbeats into normal and premature ventricular contraction classes using Chebyshev polynomial coefficients and the KNN classifier was evaluated using the same database. The overall accuracy of the classification experiment using around 35894 beats was 99.35%, while the specificity and sensitivity were 85.11% and 99.86% respectively. These findings are considered very satisfactory due to the simplicity of the classification scheme, which holds great importance in its application in clinical settings.
The comparative results indicate that our suggested classification approach provides very competitive performance. Finally, this study leads to a future direction where the classification of many arrhythmic beats, such as LBBB, RBBB, etc. can be tested. To summarise, a natural progression of this work would be to first understand the features derived and how they help in identifying PVCs from normal beats, and then introduce a novel approach for classifying several arrhythmic beats.
[1] Jenny, N.Z.N., Faust, O., Yu, W. (2014). Automated classification of normal and premature ventricular contractions in electrocardiogram signals. Journal of Medical Imaging and Health Informatics, 4(6): 886-892. https://doi.org/10.1166/jmihi.2014.1336
[2] El Khansa, L., Naït-Ali, A. (2007). Parametrical modelling of a premature ventricular contraction ECG beat: Comparison with the normal case. Computers in Biology and Medicine, 37(1): 1-7. https://doi.org/10.1016/j.compbiomed.2005.07.006
[3] Edla, S., Kovvali, N., Papandreou-Suppappola, A. (2014). Electrocardiogram signal modeling with adaptive parameter estimation using sequential Bayesian methods. IEEE Transactions on Signal Processing, 62(10): 2667-2680. https://doi.org/10.1109/TSP.2014.2312316
[4] Sayadi, O., Shamsollahi, M.B. (2009). A model-based Bayesian framework for ECG beat segmentation. Physiological Measurement, 30(3): 335. https://doi.org/10.1088/0967-3334/30/3/008
[5] Brito, M., Henriques, J., Carvalho, P., Ribeiro, B.,Antunes, M. (2007). An ECG compression approach based on a segment dictionary and bezier approximations. In 2007 15th European Signal Processing Conference, IEEE, pp. 2504-2508.
[6] Baali, H., Akmeliawati, R., Salami, M.J.E., Khorshidtalab, A., Lim, E. (2014). ECG parametric modeling based on signal dependent orthogonal transform. IEEE Signal Processing Letters, 21(10): 1293-1297. https://doi.org/10.1109/LSP.2014.2332425
[7] Laguna, P., Jané, R., Olmos, S., Thakor, N.V., Rix, H., Caminal, P. (1996). Adaptive estimation of QRS complex wave features of ECG signal by the Hermite model. Medical and Biological Engineering and Computing, 34: 58-68. https://doi.org/10.1007/BF02637023
[8] Lagerholm, M., Peterson, C., Braccini, G., Edenbrandt, L., Sornmo, L. (2000). Clustering ECG complexes using hermite functions and self-organizing maps. IEEE Transactions on Biomedical Engineering, 47(7): 838-848. https://doi.org/10.1109/10.846677
[9] Clifford, G.D., Villarroel, M.C. (2006). Model-based determination of QT intervals. In 2006 Computers in Cardiology, IEEE, pp. 357-360.
[10] Nunes, J. C., Nait-Ali, A. (2005). Hilbert transform-based ECG modeling. Biomedical Engineering, 39(3): 133-137. https://doi.org/10.1007/s10527-005-0065-4
[11] Tchiotsop, D., Ionita, S. (2010). ECG data communication using chebyshev polynomial compression methods. Telecommunicatii Numere Publicate, AN XVI, 2: 22-32.
[12] Guendouzi, F., Attari, M. (2013). Polynomial modeling of the ECG signals. In 2013 International Conference on Computer Medical Applications (ICCMA), IEEE, pp. 1-5. https://doi.org/10.1109/ICCMA.2013.6506177
[13] Mitra, M., Samanta, R.K. (2013). Cardiac arrhythmia classification using neural networks with selected features. Procedia Technology, 10: 76-84. https://doi.org/10.1016/j.protcy.2013.12.339
[14] Exarchos, T.P., Tsipouras, M.G., Exarchos, C.P., Papaloukas, C., Fotiadis, D.I., Michalis, L.K. (2007). A methodology for the automated creation of fuzzy expert systems for ischaemic and arrhythmic beat classification based on a set of rules obtained by a decision tree. Artificial Intelligence in Medicine, 40(3): 187-200. https://doi.org/10.1016/j.artmed.2007.04.001
[15] Tsipouras, M.G., Voglis, C., Fotiadis, D.I. (2007). A framework for fuzzy expert system creation-application to cardiovascular diseases. IEEE Transactions on Biomedical Engineering, 54(11): 2089-2105. https://doi.org/10.1109/TBME.2007.893500
[16] Yu, J., Wang, X., Chen, X., Guo, J. (2020). Searching for Premature Ventricular Contraction from Electrocardiogram by using one-dimensional convolutional neural network. Electronics, 9(11): 1790. https://doi.org/10.3390/electronics9111790
[17] Alday, E.A.P., Gu, A., Shah, A.J., Robichaux, C., Wong, A.K.I., Liu, C., Liu, F., Rad, A.B., Elola, A., Seyedi, S., Li, Q., Sharma, A., Clifford, G. D., Reyna, M.A. (2020). Classification of 12-lead ecgs: The physionet/computing in cardiology challenge 2020. Physiological Measurement, 41(12): 124003. https://doi.org/10.1088/1361-6579/abc960
[18] Reyna, M.A., Sadr, N., Alday, E.A.P., Gu, A., Shah, A. J., Robichaux, C., Rad, A. B., Elola, A., Seyedi, S., Ansari, S., Ghanbari, H., Li, Q., Sharma, A., Clifford, G.D. (2021). Will two do? Varying dimensions in electrocardiography: the physionet/computing in cardiology challenge 2021. In 2021 Computing in Cardiology (CinC), IEEE, 48: 1-4. https://doi.org/10.23919/CinC53138.2021.9662687
[19] Rizal, A., Riandini, R., Tresnawati, T. (2018). Premature ventricular contraction classification based on ecg signal using multilevel wavelet entropy. International Journal of Engineering & Technology, 7(4.44): 161. http://dx.doi.org/10.14419/ijet.v7i4.44.26975
[20] Dong, H., Zhengquan, L., Changbin, L., Dan, L., Wendong, H. (2015). ECG PVC classification algorithm based on fusion SVM and wavelet transform. International Journal of Signal Processing, Image Processing and Pattern Recognition, 8(1): 193-202. https://doi.org/10.14257/ijsip.2015.8.1.17
[21] De Oliveira, B.R., de Abreu, C.C.E., Duarte, M.A.Q.,Vieira Filho, J. (2019). Geometrical features for premature ventricular contraction recognition with analytic hierarchy process based machine learning algorithms selection. Computer Methods and Programs in Biomedicine, 169: 59-69. https://doi.org/10.1016/j.cmpb.2018.12.028
[22] Talbi, M.L., Ravier, P. (2016). Detection of PVC in ECG signals using fractional linear prediction. Biomedical Signal Processing and Control, 23: 42-51. https://doi.org/10.1016/j.bspc.2015.07.005
[23] Xie, T., Li, R., Shen, S., Zhang, X., Zhou, B., Wang, Z. (2019). Intelligent analysis of premature ventricular contraction based on features and random forest. Journal of Healthcare Engineering, 2019. https://doi.org/10.1155/2019/5787582
[24] Yu, J., Wang, X., Chen, X., Guo, J. (2021). Automatic premature ventricular contraction detection using deep metric learning and KNN. Biosensors, 11(3): 69. https://doi.org/10.3390/bios11030069
[25] Zhou, X., Zhu, X., Nakamura, K., Mahito, N. (2018). Premature ventricular contraction detection from ambulatory ECG using recurrent neural networks. In 2018 40th Annual International Conference of the IEEE Engineering in Medicine and Biology Society (EMBC), IEEE, pp. 2551-2554. https://doi.org/10.1109/EMBC.2018.8512858
[26] Zhao, Z., Wang, X., Cai, Z., Li, J., Liu, C. (2019). PVC recognition for wearable ECGs using modified frequency slice wavelet transform and convolutional neural network. In 2019 Computing in Cardiology (CinC), IEEE, pp. 1-4. https://doi.org/10.22489/CinC.2019.138
[27] Li, Q., Liu, C., Li, Q., Shashikumar, S.P., Nemati, S., Shen, Z., Clifford, G.D. (2019). Ventricular ectopic beat detection using a wavelet transform and a convolutional neural network. Physiological Measurement, 40(5): 055002. https://doi.org/10.1088/1361-6579/ab17f0
[28] Hoang, T., Fahier, N., Fang, W.C. (2019). Multi-leads ECG premature ventricular contraction detection using tensor decomposition and convolutional neural network. In 2019 IEEE Biomedical Circuits and Systems Conference (BioCAS), pp. 1-4. https://doi.org/10.1109/BIOCAS.2019.8919049
[29] Liu, Y., Huang, Y., Wang, J., Liu, L., Luo, J. (2018). Detecting premature ventricular contraction in children with deep learning. Journal of Shanghai Jiaotong University (Science), 23: 66-73. https://doi.org/10.1007/s12204-018-1911-3
[30] Gordon, M., Williams, C. (2018). PVC detection using a convolutional autoencoder and random forest classifier. In Biocomputing 2019: Proceedings of the Pacific Symposium, pp. 42-53. https://doi.org/10.1142/9789813279827_0005
[31] Al Rahhal, M.M., Al Ajlan, N., Bazi, Y., Al Hichri, H., Rabczuk, T. (2018). Automatic premature ventricular contractions detection for multi-lead electrocardiogram signal. In 2018 IEEE International Conference on Electro/Information Technology (EIT), pp. 0169-0173. https://doi.org/10.1109/EIT.2018.8500197
[32] Philips, W., De Jonghe, G. (1992). Data compression of ECG's by high-degree polynomial approximation. IEEE Transactions on Biomedical Engineering, 39(4): 330-337. https://doi.org/10.1109/10.126605
[33] MIT/BIH database distributor. Beth Israel Hospital, Biomedical Engineering, Division available in the address: http://ecg.mit.edu/, USA, 1979.
[34] Kaya, Y., Pehlivan, H. (2015). Classification of premature ventricular contraction in ECG. International Journal of Advanced Computer Science and Applications, 6(7). http://doi.org/10.14569/ijacsa.2015.060706