Amin Jarrah* | Abedalmuhdi Almomany | Ali Alkhafaji
© 2022 IIETA. This article is published by IIETA and is licensed under the CC BY 4.0 license (http://creativecommons.org/licenses/by/4.0/).
OPEN ACCESS
This research aims to propose a new approach by combining the Optical Mapping Algorithm (OMA) with the Adaptive Kalman Filter (AKF) to improve the early detection of cardiac arrest. To improve the overall performance of the proposed approach and reduce the execution time significantly, a parallel implementation is suggested using the open-source computer vision (OpenCV) library tool and optimized for heterogeneous multi-core systems. The OpenCV library incorporates many image processing functions that are used to extract the distinctive features of the digital image to indicate the presence or absence of cardiac arrest in order to save the largest possible number of human lives. Experimental results confirm the efficiency of the proposed implementation; as for a loop with a sequence of operations repeated 64 times, the achieved speedup is 5X with an accuracy improvement of 96%. This is due to the exploitation of several optimization techniques, such as pipelining and loop unrolling. The accuracy of dark spot detection of blood vessels by combining the AKF with OMA was improved from 50% to 83.3% compared with the AKF approach alone. Thus, the proposed approach and its parallel implementation are very useful in early cardiac arrest detection to preserve human lives.
multi-core CPU, parallelization, optimization techniques, multi-threading, optical mapping algorithm, Adaptive Kalman Filter, cardiac arrest
Cardiovascular diseases are among the leading diseases that threaten human lives worldwide [1]. Cardiovascular diseases are the number one cause of death in the United States [1]. The recorded number of deaths due to these diseases has increased, which makes the process of earlystage disease detection a vital process to identify whether a person has a risk of acquiring a cardiovascular disease or not. Approximately, 17.9 million people died of cardiovascular diseases in 2019. This represented 32% of the total deaths that took place in the world in that year. Among these deaths, 85% were due to heart attack and stroke [1]. This prompted us to research for updated and improved methods for the earlier detection of cardiac arrest.
The analysis of the heart electricity using optical maps is one of the methods used for early detection of cardiac arrest which is based on a devolved algorithm such as an optical mapping algorithm (OMA) [2]. Optical mapping (OM) technology can also help in recording the movement of the heart without affecting it because it does not require physical contact. Moreover, OM technology can provide electro-spatial activity maps that incorporate information from the whole heart surface, thus providing more information for medical investigation than traditional electrode technology [2].
The selection of the appropriate filter to be applied with OMA is a very critical issue since it has a high effect on the result classification. Therefore, several kinds of filters were studied and analyzed [3-5] carefully where the Adaptive Kalman Filter (AKF) was adopted and combined with the optical mapping algorithm to improve the accuracy of cardiac arrest detection of blood vessels. However, the early detection of a cardiac arrest using OMA with AKF is a mathematically complex process that requires a lot of time to get the desired result since it usually needs to process a huge amount of data. Thus, this helps in achieving the desired results with a reasonable level of accuracy when performing the analysis of depolarization features [2]. The use of the AKF in proper applications introduces the challenge of performing an extremely large number of computation operations in a reasonable portion of time [2]. So, real-time applications have strict requirements that may not be met because of their complexity. So, one of the purposes of the research aims to accelerate the examination process of anticipated cardiac arrest and reduce its processing time. This is achieved by proposing a parallel implementation that includes reviewing, investigating, discussing, and analyzing the theoretical concepts of a hybrid algorithm of the OMA and the AKF. Accordingly, in this research, different optimization and parallelization techniques were adopted and applied to introduce an improved cardiac arrest detection software solution to provide real-time support for the specialists in their fields. Parallelization techniques break down complex operations into smaller and simpler operations that can be run concurrently. This helps in dividing the overall work and distributing it among several threads in order to perform the overall task and achieve the desired results quickly [6, 7].
The organization of the paper is as follows: Section 1 provides an introduction that explains the problem and aims of the study. Section 2 reviews the relevant literature, examining the theoretical and practical aspects of OMA and AKF. The theory of OMA is explained in Section 3. Section 4 explains the theory of AKF. The OpenCV library tool is presented in Section 5. Section 6 describes the methods, techniques, and procedures for conducting the research. The experimental results are analyzed in section 7. Finally, section 8 provides a conclusion of the proposed research.
A number of studies have negotiated several aspects related to the implementation of the OM in many applications using various parallel processing platforms. The optical image of a normal heart is usually acquired by charge-coupled device (CCD) cameras and Photodiode Array (PDA) detectors. Qu et al. [8] studied a comprehensive imaging system that used three PDAs to image Langendorff live rabbit hearts with or without irregular heartbeats. The studies' results revealed that the PDA system could achieve a higher Signal to Noise Ratio (SNR) at nearly ten times faster than the CCD camera.
Wang et al. [9] described in detail the results of their study using the OM. They were able to detect the transmembrane potential and intracellular calcium concentration transient in ventricular tissue specimens using Guinea pigs and rabbit animal models. They also indicated that exponential fitting met the requirement for a post-cutting recovery time of thirty-six minutes for pigs and sixty-three minutes for rabbits in order to obtain (97.5%) of the APD final steady position values. Attin and Clusin [10] discussed the basic concepts of the OM technique and how it could be applied to theelectrophysiology of the heart to study its normal rhythm and irregular heartbeats. These techniques present an opportunity to get recordings of membrane potential with a higher spatial and temporal resolution than electrical mapping. It also helps to obtain timely recordings of membrane potential and calcium transients in the entire heart.
Previous research reported that fluorescent optical data digital filtering was also an important requirement for strong successive data analysis [11]. An adjustable spatial-temporal Gaussian filter is used for tackling OM signals and filter parameters that can be selected automatically with no further user input. Moreover, they developed an adaptive spatial-temporal Gaussian filter for examining fluorescence-optical data with low SNR. The result allows the use of an adjustable filter method, which completely automatically identifies filter parameters in accordance with the signal features of the recorded data. Allan [12] developed a new method of comprehensive OM by applying a single camera to examine myocardial electrophysiology in separated Langendorff live rabbit hearts using recorded data from the panoramic OM system and filtered it for the purpose of analysis. He also studied the change of heart electricity under various activity conditions in both normal hearts and rabbit hearts. In addition, he examined the variations in the pattern of electricity activation according to the variations in system activity.
Contacting cardiac electrogram is one of the applications that uses OM [13]. It attempts to evaluate and validate the performance of a two-dimensional free movement marker tracing algorithm that follows movement distortion in video images [13]. The computer simulation is applied to produce artificial OM videos that indicate the heart systole and diastole. They also examined the movement tracing and stability algorithms on the artificial OM using the experimental data. Moreover, optical maps with a significant reduction in motion artifacts indicated potential wave actions that spread through the movement of the heart surface. Finally, they pointed out how a decrease related to the dissociation of movement artifacts could be quantified and tied to tracing accuracy. Meng et al. [2] presented an implementation of OMA using GPU for cardiac electro-physiology. They divided the process and assembled the arrays of data to avoid the GPU memory space limitation. The proposed implementation of GPU was faster than parallelization using the multicore platform. It was capable of processing the OM video at 578 frames per second, which approximately improves the speedup 158 times compared to the use of the OpenMP tool solution on a multicore system. Further, Meng et al. [2] examined real-time OM technology and explained how they used dense spatial electrophysiology. They also studied the acceleration of the OM approach in heterogeneous systems. The proposed architecture improved the speed 273 times compared to the use of regular machines with multiple cores and traditional software tools.
Several scholars have studied the AKF in object tracking and the variations in the earlier works [14]. The AKF allows estimating the conditions of the object's movement in the case of tracking a moving object. A vascular tracing method based on the KF [15]. The vessel position measurements are made to give an accurate prediction of the B-spline control points of velocity and position over time. Results indicate two sequences of the exact coronary artery motion. This makes it easy to control the occurrence of any clot in real time [15]. Salleh et al. [16] proposed Kalman filtering for the noise reduction of the statistical heart sound. The heart sound cycles are found with additional noise for the measurement. The model is designed into a state space form to enable the use of KF to predict the clear heart sound cycles to detect possible heart problems [16].
The technology of OM has proved to be a beneficial means to record and study heart electricity. Optical mapping calculates the electrical impulses of the heart after injecting a voltage-sensitive fluorescent dye [17]. Optical mapping can be used in many applications that need features of images since it does not essentially intervene with the heart [18, 19]. It introduces an intensive spatial heart surface electrical map [20]. Electrical phenomena can be envisaged by measuring different light intensities with one or more high-speed Complementary Metal Oxide Semiconductor (CMOS) cameras, which provide clear resolution signals. Similarly, optical mapping involves the use of filters and resolution signal techniques similar to those used in whole-heart electrophysiology [2].
Applying mechanical power to the heart muscle using electrodes can make modifications to the electrical activity through Mechanic Electrode Feedback (MEF) [21]. Optical maps are often applied to detect irregular heartbeats. Using real-time visualization, one might be able to instantly diagnose irregular heartbeats and study them more closely. Moreover, although one can detect the existence of irregular heartbeats using an ECG device, a deeper understanding of this condition can be obtained using OM through determining action potential duration and amplitude. This requires repetitive loops and communication speed [2].
Recording action potentials of OM is performed using a high-speed sensor. A potentio-metric fluorescent dye is used by OM in which emission intensity varies inversely with the voltage of the transmembrane [17]. The response time of changing fluorescence dyes into corresponding voltage is very fast, so the dye response time is neglected and the limitation in temporal resolution is only from recording technology [17]. Researchers used the latest technologies in imaging which allow them to achieve high spatial and temporal resolution of monitoring voltage transactions through transmembrane optically. Additionally, applying forces on the heart mechanically with electrodes can change the electrical activity through Mechanolectrode Feedback (MEF) [21].
The optical mapping algorithm is computationally intensive due to its operations; it also consumes a lot of time even with using a highly optimized approach implemented on a multi-core CPU platform because of the high data productivity in which it takes a long time to tackle a small amount of data [2]. Initially, given the intensity of the raw image, the noise can be reduced using spatial and phase filtration [17]. Each image is divided into a number of pixels. Each pixel works like a sensor on a heart location. The difference in pixel intensity over time is proportional to the voltage of the selected location. Therefore, a base pixel of a 100 × 100 resolution video is equal to 10,000 traditional sensors that bring about additional precise and global information over normal electrode techniques [20]. In order to take advantage of all the optimization possibilities of OMA, a full study and analysis should be performed for parallelism possibilities in their tasks. The OMA is divided into many steps as follows:
3.1 Raw camera data
Video raw data typically includes measurable sensor noise. The raw image of the signals' intensity should be processed by applying a set of methods involving spatial phase displacement and filtraization to decrease the noise. The operation of OMA consists of processing video data to reduce biological features like repolarization, depolarization, and activation time. Direct extraction of the biological properties from raw data outputs is deemed extremely incorrect for most medical applications, which has been suggested and proved [22]. Therefore, a number of experiments require the elimination of noise and blur owing to the heart contraction using a combination of ratiometry and motion tracking [2].
3.2 Normalization
The first OMA operation on video raw data is normalization. This process is one of the most important techniques used to re-scale the data values of different features to be in a smaller range from (0) to (1) or (-1) to (1). Normalization is separately implemented every second of a video. In order to calculate the base value of normalization for a pixel location, the mean value is found in the temporal array using Eq. (1). The standard deviation is determined based on Eq. (2) [23]. Then, each pixel of an image will be normalized using Eq. (3) with the correspondent normalization base value [2].
$\mu=\frac{\sum_i^n x(i)}{n}$ (1)
$\sigma=\sqrt{\frac{\sum_i^n(x(i)-\mu)^2}{n}}$ (2)
$Z=\left(\frac{(x-\mu)}{\sigma}\right)$ (3)
where, Z represents the normalized pixel, x represents raw pixel, μ represents mean value and σ represents the standard deviation.
Normalization determines whether a particular pixel is useful to reduce computational complexity [2]. Obviously, a pixel is signaled validly if it achieves the following conditions:
·If the pixel's value range is greater than a given range, then the pixel is in action.
·If the maximum pixel's values are greater than the given values, then the pixel is considered active as a heart pixel.
3.3 Inversion
Image inversion is an essential technique for quantum information processing and in image segmentation, where images are divided into various segments to process each one separately to increase image enhancement [24]. The normalized image data is represented as a matrix of data. Each row of the matrix indicates the row of the image and its value indicates the matching pixel grey level. The white color value is (255) and the black color value is (0). The pixels of the normalized image matrix will be multiplied by (255), then it will be inverted by subtracting its cell values from the number of gray shades based on Eq. (4) [24].
$I=1-z$ (4)
where, I refers to the inverted pixel and z refers to the normalized pixel.
3.4 Phase shift spatial filter
A phase shift spatial finite impulse response (FIR) filter and a temporal median filter are included in OMA to improve the electrical signal [2]. A kernel window first goes through low interpolation using a factor of (10) and then applies a phase shift spatial filter. The procedure applies to both spatial and temporal filters on the raw data in the kernel window. The phase variation function employs a window through time, indicating a kernel that determines valid pixels with a dimension that defines the window center. The phase moves the entire window at the appropriate time, using it as a reference for the center pixel. The moved window is turned back along with the amount of mean shift. The Fast Fourier Transform (FFT) is also applied to compute the amount of phase shift [2].
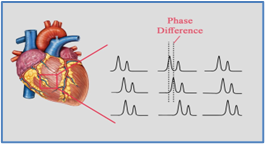
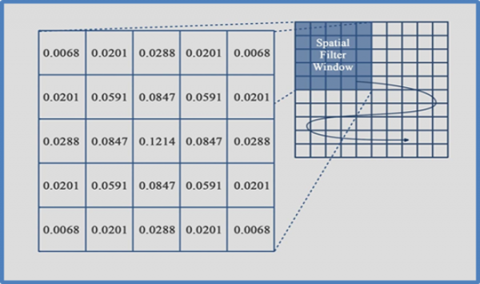
The signal moves as a waveform, where all the adjacent pixels defer in phase with the filtered pixel, as shown in Figure 1 [2]. These phase variations represent noise on the filtered image if the spatial filter is directly stratified. To reduce the noise in the image data, a 2D spatial filter (5×5 Gaussian filter (δ=1.179) is used. All of the image pixels are exchanged with the convolution of the 5×5 Gaussian filter and 24 phase-shifted adjacent pixels. The 2D filter procedure and its coefficients are illustrated in Figure 2.
The Gaussian filter was considered since it is one of the most important types of AKF. It was used to convert the image from one form to another to obtain a contrast of properties of the image. The kernel was applied to every pixel in the image so that the image appears to have a more specific form. Accordingly, it is possible to determine the basic colors of a digital image by extracting the basic characteristics from the original image, so the object could be identified by converting the digital image to a gray scale and applying the Gaussian kernel in order to give a high contrast to the areas of dense color according to the color gradations required to be found.
The original image is divided into squares according to the size of the kernel. It performs an arithmetic operation by multiplying itself with every number in the subset. The result of the calculation process forms the new image, and the resulting image is the required feature. Unfortunately, this process requires high computational time. Therefore, the contrast is taken through the FFT to help find the contrast on the coordinate axis.
Figure 1. Phase differences of filtered pixels
Figure 2. 2-D filter procedure and its coefficients
3.5 Padding zeros
Padding bits is a mechanism of adding extra bits to a given matrix of pixel values of an image for the purpose of determining its frames and boundaries. The padding zeros function is applied to the input array before FFT to make the length of the array input an integer power of 2. The Adaptive Kalman Filter (AKF) is utilized by this process to determine the boundaries of the object so that the searching process for a row containing zeros is better than the search for a full area. Thus, the process of obtaining the result becomes easier, faster, and more accurate. AKF consists of a set of mathematical operations that render a precise calculation of the mean for estimating the state of a process condition to reduce the mean squared error. AKF helps to estimate the past, present, and future conditions of a moving object when the exact nature of the identified system is not known. It allows correcting and limiting the areas where movement is sought in the next step [25].
3.6 Interpolation
The input array should be extended to the length raised to the power of the interpolation factor. Then, a coefficient array of a corresponding filter is generated by the algorithm. The extended array passes across the filter in order to make the output array of interpolation [2]. In the OMA, more frames with video data are given for interpolation to improve the sampling rate of the time axis [2].
3.7 Two-dimensional spatial filter
A 2-D spatial filter is applied to individual frames to enhance the signal. The signal moves as a waveform, all the adjacent pixels defer in phase with the filtered pixel. It is important to remove the phase variations by moving the pixels across the time axis. In order to identify the phase shift between two pixels, suppose two signals S1 and S2 where the signal S2 is the shifted time version with signal S1 delay of t0 as represented in Eq. (5) [17].
$S 2(t)=S 1(t-t 0)$ (5)
The relation between the Fourier transformations of S1 and S2 is illustrated in Eq. (6) where t0 is found using Eq. (7). The Inverse Fast Fourier Transforms (IFFT) are taken on both sides based on Eq. (8) [17].
$S 2(f)=e^{-j 2 \pi f t 0} S 1(f)$ (6)
$\frac{S 2(f) S 1 *(f)}{|S 2(f) S 1 *(f)|}=e^{-j 2 \pi f t 0}$ (7)
$\left.\frac{S 2(f) S 1 *(f)}{|S 2(f) S 1 *(f)|}\right)=\delta(t-t 0)$ (8)
The time shift operations include fetching the reference FFT array and the array that should be shifted. Then, calculate the conjugation of the reference FFT array and multiply it by the other FFT array. Next, the IFFT of the output array achieved in the second step is carried out and the maximum value of the output array is found. Thus, the indicator of the maximum value is the required time difference t0. The adjacent pixels are shifted with the correspondent time variations after the t0’s are found in all filter windows. The output data of the phase shifting is extended to a factor which is the size of the window owing to the fact that every pixel has its own filter window.
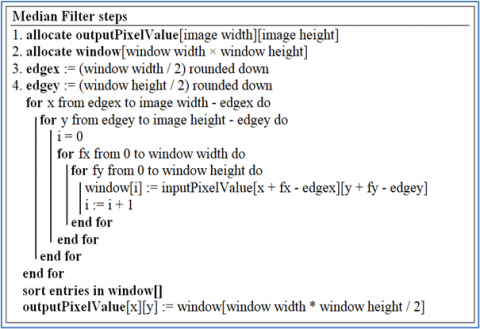
3.8 Median filter
The output of the phase-shift filter applies a temporal filter to further enhance the image quality and strip noise after correcting the phase spatial filter. The median filtering is used to maintain the steep upstroke of the potential of optical action which alters a pixel with the median value of the set and a number of its adjacent pixels along the time axis [26]. The heart’s actions will be better kept up, and the image will be ready for analysis.
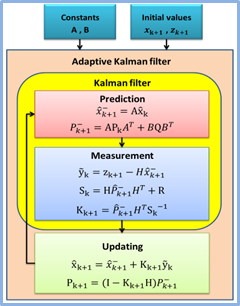
The extraction of cardiorespiratory system signals resulting from non-contact sensing arrangements is a challenging mission, and it is likely disrupted by the noise of measurement. Basic filtering methods cannot extract information for control purposes. The AKF approach using the real-time filtering system was presented. It permanently estimates heart and breathing rates to improve performance through feedback to the system. The covariance matrices of the sensor and system noise are adapted to the targeted application automatically for the purpose of improving the separation capabilities of signals [25]. The AKF approach continuously enhances the ability to separate the targeted signals from the sensor raw data, thus making it possible to apply real-time filtering. Moreover, it is possible to use the AKF approach to measure heart and breathing rates in real time. When the AKF matrices are adapted, the estimation results are improved and they make the filter able to detect possible cardiac arrest [25]. The adaptive Kalman filter consists of three steps as follows:
4.1 Prediction
Eq. (9) can be used to calculate the predicted state, and Eq. (10) can be used to calculate the next estimate variance [27, 28].
$\hat{x}_{k+1}^{-}=A \hat{x}_k$ (9)
$P_{k+1}^{-}=A P_k A^T+B Q B^T$ (10)
where, $\hat{x}_{k+1}^{-}$is the predicted state vector, $P_{k+1}^{-}$ is the variance matrix for $\hat{x}_{k+1}^{-}$, xk is the current state, A is a (N×N) matrix that represents the state at time step (K) to the state at step (K+1), B is a (N×1) matrix that relates the input to the state x, Pk is the current variance and Q is the process noise covariance.
4.2 Measurement
The predicted residual vector, which represents the difference between the actual measurement and the predicted one, is expressed by Eq. (11) [27]. The measurement before covariance is found by Eq. (12) [27]. The Optimal Kalman gain is found using Eq. (13) [27].
$\tilde{y}_k=Z_{k+1}-H \hat{x}_{k+1}^{-}$ (11)
$S_k=H \hat{P}_{k+1}^{-} H^T+R$ (12)
$K_{k+1}=\hat{P}_{k+1}^{-} H^T S_k^{-1}$ (13)
where, zk+1 is the actual measurement and H is a (M×N) matrix that relates the state with the measurement zk, R is the covariance of the measurement noise.
4.3 Updating
The updated state vector can be calculated through Eq. (14) [27]. The updated error covariance estimate can be calculated through Eq. (15) [27].
$\hat{x}_{k+1}=\hat{x}_{k+1}^{-}+K_{k+1} \tilde{y}_k$ (14)
$P_{k+1}=\left(I-K_{k+1} H\right) P_{k+1}^{-}$ (15)
OpenCV is a powerful tool containing libraries that can be used to perform tasks in many applications, such as computer vision, detecting and tracking of objects, landmark detection, camera movements, video actions tracing, object 3D models extracting, and producing a high resolution image of the whole scene [29]. OpenCV contains many of the algorithms needed by the computer vision process. It also has an independent architecture that can be used to build more complex structures [29].
OpenCV has interfaces for C++, MATLAB, Java, and Python. Its template interface easily works with the standard template library (STL) containers. It has many functions and ready design blocks that support the process of implementing more than 500 algorithms [29]. Architectural units of the OpenCV allow the use of static libraries that are fully reliant on a coding system. The codes are converted into an executable file by taking a copy of the required codes and making them a part of the program, since codes are connected at the compile time. It also supports the use of shared libraries at runtime (running of executable codes) by referencing the required shared code [29].
The OpenCV libraries contain many modules. The most essential one is a multi-dimensional array (Mat) that is responsible for basic data structures and primary functions. Other important modules also consist of the image processing (imgproc) module that allows the use of needed operations to process images such as filtering, warping, resizing, color conversion, histograms, interpolation, padding, interpolation, and others. OpenCV also contains the video analysis (video) module that covers movement algorithm estimates, tracing of objects, and background removal. Moreover, the object detection (objdetect) module is also available to detect objects such as faces, eyes, people, things, animals, and others [29].
OpenCV can also automatically distribute outputs by reallocating the memory for output function parameters. Moreover, the OpenCV implementation supports multi-threading and re-entry capability. The same functions or various classes can be called from various threads because reference counting processes apply to the atomic-specific module orders [29].
To detect cardiac arrest early, two methods were developed and implemented. The first method is the Adaptive Kalman Filter, and the second method is our proposed method, which combines the AKF and OMA to improve the accuracy of detection. The coding system was designed to provide image maps of digital images using the latest developments in available programming techniques and OpenCV Libraries. The proposed system includes a number of basic steps to help the specialist doctor to extract the distinctive features of digital images which can indicate the presence or absence of cardiac arrest.
The processes of OMA were applied, which consisted of filters, shifting, flipping (convolve) and transformation of digital images so that the computer can read them better and the appropriate decision can be made by classification algorithms. Further, AKF was adopted and applied since it continuously enhances the ability to separate the targeted signals from the sensor raw data.
Moreover, various parallelism and optimization techniques are selected and applied among the OMA's internal steps. Every OMA step is effectively optimized to enhance speed up, latency, and throughput. The proposed parallel implementation is constructed on a heterogeneous computing system that contains several computation elements (cores) where the OpenCV tool is used to create a sufficient number of threads to utilize the available cores. Heart images are mainly appropriate for processing on parallel structures using multi-core processors, where each CPU can be operated on a sub-image through partitioning of the original images. However, the application of these parallelization methods requires an intensive examination of the algorithm functionality. A generalized model of coarse-grained parallelism is executed; this helps to create a more powerful design that achieves the real-time requirements. The default proposed algorithm parameters are tuned while utilizing the OpenCV library to perform target operations.
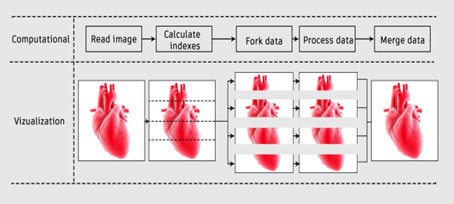
Forking multiple threads, on the other hand, introduces the challenge of evenly distributing overall work among these threads; additionally, there is an overhead associated with resolving several multi-thread issues such as communication, synchronization, and load balancing. A data dependency is a critical issue that reduces the efficiency of the constructed parallel approach since it is not possible to speed up the execution of a program that contains a series of sequential operations and depends on the results of the stages that precede them. Therefore, the program must be written in a way that exploits the features of the existing homogeneous architecture. There are many software libraries that provide the ability to create and manage threads, such as open multi-processing (OpenMP) [30], open computing language (OpenCL) [31-33], and Intel threading building blocks (ITBB) [34]. In this proposed study, the OpenCV library tool is used where several optimization techniques are possible; auto-parallelization and auto-vectorization are used to exploit all the capabilities of the heterogeneous multicore CPU-based system. Using the fork-join model, the primary thread spawns several slave threads, each executing a specific task before being terminated and returning to the joined primary thread. The overall task can be divided into sub-tasks and each of these sub-tasks can be handled by one or more threads, as shown in Figure 3. This implies that the algorithms can be divided to be separately processed without any interference. The OpenCV library uses the fork-join model to create a sufficient number of threads to utilize all available computation cores and maximize the CPU-core utilization factor.
Figure 3. Distributing the main task into several sub tasks using the fork-join model
Figure 3 shows the image distribution to the various cores using a sufficient number of threads. At the fork section, each thread has its own core affinity. This indicates that the thread (1) has affinity (1) and therefore should be executed on core (1) and so on. The thread affinity is also applied for image partitioning. The selected image is divided on a height basis. The threads work horizontally on the indexes measured in accordance to Eq. (16), where the vertical workload is measured in accordance to Eqns. (17), (18), and (19) [35].
$W_x=I S_x$ (16)
If $(A F)=0, U B=0, L B=I S_y$ (17)
If $(A F)>0, U B(n)=\frac{I S_y}{A F}(n-1)+1$ (18)
If $(A F)>0, L B(n)=\frac{I S_y}{A F}(n)$ (19)
where, Wx is the work indexes, ISx is the horizontal image size, UB is the upper vertical index limit, LB is the lower vertical index bound, ISy is the vertical image size, and the AF is the current thread core affinity.
Optimal load balancing to distribute the work among multiple threads is a big concern to reduce the entire number of clock cycles required to perform the target task. Therefore, the tasks were split dynamically and assigned to corresponding threads so that each thread had an equal amount of work to accomplish. The compiler that is associated with the OpenCV library strives hard to achieve load balancing and minimize the execution time aspect for the appropriate task. Improving the load balancing through minimizing the idle time and reducing the number of stall cycles for all threads optimizes the resource utilization and enhances the feasibility of using other possible optimization techniques such as nested input and output, memory prefetching, and reordering patterns of data access.
The whole system processing is partitioned into a number of basic steps. In this research study, we investigated the pseudocode implementation for each step, and the procedure could be assumed to tune the performance and achieve a reasonable execution time. However, parallelizing the proposed method depends mainly on loops that implement a significant portion of the overall execution time. These improvements, such as loop unrolling, loop pipelining, loop dataflow, loop merging, and loop exchange, are applied to improve the cache performance and the parallel processing capabilities of the proposed implementation.
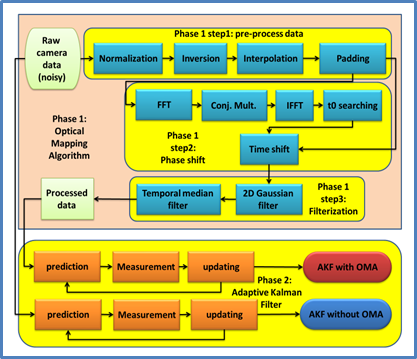
Figure 4 shows the proposed hybrid procedure that combines the AKF and the OMA algorithms. The proposed model is implemented in two possible paths (phases), and each path involves several steps. In the first path, it involves the feature detection of noisy raw camera data through AKF directly without passing it to OMA, while in the second path, it shows applying both the OMA and the AKF approaches as shown in Figure 4.
Figure 4. The proposed method combining AKF with OMA
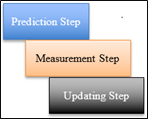
The implementation of OMA consists of three steps; the first step is the data pre-processing that consists of the four stages (Normalization, Inversion, Interpolation, and Padding). The second step is the shift kernel that consists of the five stages (FFT, Conj. Multi., IFFT, t0 searching and time shift). The third step is the filtraization, which consists of the two stages (temporal median filter and 2D Gaussian filter). After the raw data passes through these three steps, processed data is obtained. Then, it passed to the second phase (AKF), which consists of another three stages: the prediction, the measurement, and the updating stage. The following is an explanation of these steps in detail.
PHASE 1: OPTICAL MAPPING ALGORITHM (OMA)
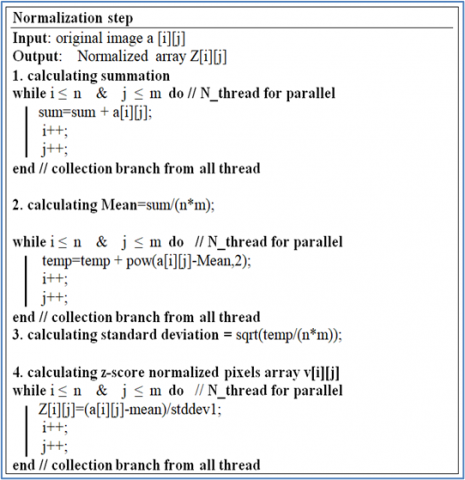
6.1 Normalization step
The normalization process is used to limit the range of pixel density values of the digital image between zero and one in order to facilitate their reading by the Adaptive Kalman classification algorithm and reduce the size of the spacing among the image data [36]. The normalization pseudocode is shown in Figure 5. Fortunately, there was no dependency between the iterations of the while loops in the first step. Optimization techniques through multithreading, vectorization, and loop pipelining were applied by dividing the summation into sub-sums and finding their local values, then adding them to have the total sum. This will help in decreasing the execution time, which positively improves OMA performance. The mean value in step 2 was calculated by dividing the summation of pixels’ values over the number of pixels (n×m), then the result was calculated in the same way of finding the sum value in the first step, which was used to determine the standard deviation in order to get the z-score normalization values.
Figure 5. Normalization algorithm pseudocode
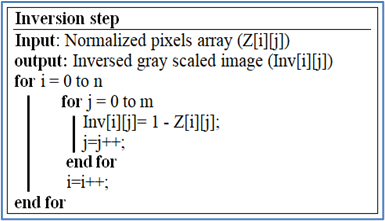
6.2 Inversion step
The inversion process is used to change the grayscale image colors from white to black and vice versa. Figure 6 shows the inversion pseudocode process. There are no dependencies between the iterations of the loop, so the image is split into (n) partitions by applying the loop unrolling technique to improve the execution time.
Figure 6. Inversion algorithm pseudocode
6.3 Interpolation step
The inverted image array is expanded using interpolation by a factor of 10. The expanded array passed through a coefficient array of the FIR filter to generate an interpolated output array in order to promote the rate of sampling across the time axis for identifying edges. Interpolation is used to solve discontinuity artifact problems, blurring in the edge regions and their angles [37]. Figure 7 shows the pseudocode of the interpolation step. There is a clear dependency between steps (1) and (2) together with the inverted image from the earlier step, as shown in Figure 7. Thus, the vectorization optimization technique could be used to reduce the data dependency and the execution time as well. Steps (3) and (4) could be fully parallelized by dividing the main loop into multiple loops horizontally or vertically, each of which is handled by a separate thread, where all threads are executing their tasks concurrently. Then, the full interpolated image should be accomplished after collecting partial results from all considered threads.
Figure 7. Interpolation algorithm pseudocode
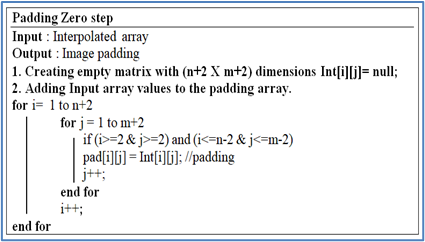
6.4 Padding step
The padding process is used to isolate the image and distinguish its edges in order to be easily tracked by the proposed algorithm by adding a frame with zero padding. Figure 8 shows the padding process pseudocode. There is a high inter-dependency among steps (2) and (1), together with the interpolated image from the previous step, as shown in Figure 8. Thus, vectorization is used here to reduce the data dependency and perform the process with a lower number of clock cycles.
Figure 8. Padding algorithm pseudocode
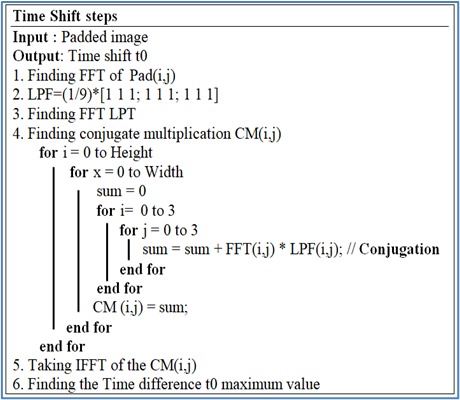
6.5 Time shift step
Finding Fast Fourier Transform (FFT), conjugation, and IFFT of the time shift could be executed through multithreaded parallelization technique since there is no data dependencies upon splitting the original matrices into (n) partitioned. Figure 9 shows "Time shift" procedures containing FFT and IFFT processes.
Figure 9. Time shift algorithm pseudocode
The FFT method is used to convert the range of digital image pixel values from the time domain to the frequency domain and display them in another form that is easy to distinguish. This helps in identifying non-periodic signs such as the noise, which could be processed at the last stage using a 2-D low pass filter to measure and extract several features of the digital image. Moreover, the IFFT is also applied to the output array from the conjugation of the original FFT array and the FFT shifted array. The filter mechanism is used according to the concept of kernel filterization through applying a filter with a specific size to the digital image. The OpenCV Library contains many optimized functions to implement both the FFT and the IFFT algorithms that are used in this processing step.
The Gaussian process is also considered here to obtain the contrast of the image properties. It is applied to each pixel in the image to give the image a more specific shape. Accordingly, it is possible to determine the basic colors of a digital image by extracting the basic features from the original image. So, the object could be identified by converting the digital image into a grayscale and applying the Gaussian kernel in order to increase the contrast level of denser color areas according to the color gradations that are required to be found. The OpenCV tool contains many functions that can be used to parallelize the implementation of the Gaussian function, where pragmas such as loop unrolling and loop pipelining can be used to increase the amount of work per clock cycle.
Although the proposed kernel is a two-dimensional square area that is smaller than the original image, the original image is divided into squares that match the kernel in size. The original image pixels’ values are updated upon performing the multiplication operations with the proposed kernel, and the new image should contain the required feature. Therefore, the degree of intensity of illumination on the image is reduced or increased through changing the pixel density, but the process probably consumes more time. To solve this issue, the contrast is taken by applying Fourier equations to the image matrix to obtain the contrast level value on the coordinate axis. Applying the FFT on the proposed matrices leads to achieving a high contrast level when the illumination intensity is large and a low contrast level when the illumination intensity is low. Finally, the resulted image will be prepared to be processed by the proposed filter in the next step to remove those unwanted details.
6.6 Median filter
The median filter is found to be a proper filter to reduce the noise and maintain the feature of the heart's actions. Data dependencies do not exist among the loop iterations of the median filter, as can be seen in Figure 10, so the pipeline optimization technique is used to improve the performance in terms of the execution time [26]. Next, the original image is inverted by applying the Gaussian method to normalize the image after it has been transferred to its original shape. Then, the data is prepared to be processed by the AKF to detect the location of the object in the processed input image.
Figure 10. Median algorithm pseudocode
PHASE 2: ADAPTIVE KALMAN FILTER (AKF)
The AKF is used to detect the change in the current frame of the image compared to the next frame during the diastole to track and monitor heart dimensions. In addition, when the heart systole occurs, images are compared in both cases to determine the differences between them. The AKF algorithm depends on the presence of an object whose dimensions and location are determined in the selected image. Also, when any change occurred in the image, the AKF algorithm calculated the amount of change in the shape of the image or its dimensions. If different images are available, the AKF algorithm will show a black screen, indicating that there are no changes. In this case, the amount of change in the two heart images between diastole and systole can be calculated several times by using the parallel processing tool with proposed optimization techniques to process a series of images concurrently. The series of images is a representation of the frames in the videos, so the image series can be like an animation that displays a specific movement. The adaptive Kalman filter algorithm flowchart is shown in Figure 11.
Figure 11. The Adaptive Kalman Filter (AKF) algorithm flowchart
The AKF consists of three steps: the prediction, the measurement, and the updating step. Most of the arithmetic operations (multiplication, addition, and subtraction) in these steps have no dependency. So, these steps can be executed in parallel by applying the loop pipelining and loop unrolling optimization techniques. The size of the output processed image from the OMA is (1024×1024). The number of forked threads in the proposed system is 1, 8, 16, 32, and 64. So, tasks are divided evenly between the threads based on Eq. (20).
Task_per_thread $=\frac{\text { Number of matrix rows }}{\text { Number of threads }}$ (20)
Furthermore, the measurement step does not have to wait for the prediction step to complete all of its iterations, and the same thing occurs between the measurement and updating steps. Once the current value is determined, then it can be forwarded to the next step to allow operations overlap execution by applying the dataflow optimization technique as shown in Figure 12. Dataflow is an optimization technique that is applied to the steps to allow parallel execution [38, 39]. Step 2 can’t start until step 1 completes all its iterations. However, by applying the dataflow optimization technique, step 1 can forward the result from the first iteration to step 2, and then both steps can be processed concurrently. The same thing is between steps 2 and 3, as shown in Figure 12. The OpenCV tool automatically inserts channels between the proposed steps to ensure that data can flow asynchronously from one loop to the next [40].
(a) Without dataflow
(b) With dataflow
Figure 12. Data flow technique
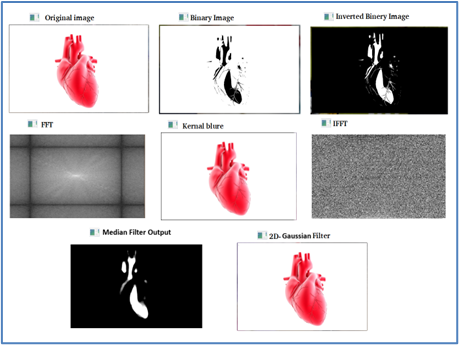
This study designs, analyzes, and implements an intelligent system for early detection of potential cardiac arrests in humans using two approaches: the adaptive Kalman filter and a hybrid approach of both the adaptive Kalman filter and the OMA. Figure 13 shows the result of each step of the OMA approach.
Figure 13. The result of OMA
The proposed system is tested on two homogeneous systems having different characteristics. The first system (Device1) is an Intel Core i5@ 2.7 GHz CPU that consists of two cores, and the second system (Device2) is an Intel Core i8 @ 4.00 GHz CPU that consists of four cores. Tables 1 and 2 show the results of applying the AKF approach and the AKF with the OMA approaches using Device1 and Device2 respectively. Both approaches are constructed (1) without using any sort of parallelization techniques (using a sequential single-thread), (2) and with using the proposed parallelization procedure (several numbers of threads are spawned) on both Device1 and Device2. A reasonable speedup and improvement are achieved, which leads to the construction of a real-time system for cardiac arrest detection and improving the capabilities of the health care sector. From the Tables 1 and 2, the computational speedup improves three times on the Device1 and up to five times on the second system, Device2. This confirms the efficiency of the parallelization approach and the utilized tool in this study.
Table 1. The results of applying the AKF approach on Device1 and Device2 for 64 iterations with a various number of threads
|
Adaptive Kalman filter approach |
||||||
|
Number of Threads |
Device1 |
Speed Up |
Improvement percentage |
Device2 |
Speed Up |
Improvement percentage |
|
1 |
73889.8 |
|
|
15226.50 |
|
|
|
8 |
26473.1 |
2.79 |
0.64 |
3371.09 |
4.52 |
0.78 |
|
16 |
24552.3 |
3.01 |
0.66 |
3194.20 |
4.77 |
0.79 |
|
32 |
24528.5 |
3.01 |
0.67 |
3184.01 |
4.78 |
0.79 |
|
64 |
27486.6 |
2.69 |
0.62 |
3193.29 |
4.77 |
0.79 |
|
* Time is in microseconds |
||||||
Table 2. The results of applying a hybrid of the AKF and OMA approaches on Device1 and Device2 for 64 iterations with a various number of threads
|
Adaptive Kalman filter with optical mapping |
||||||
|
Number of Threads |
Device1 |
Speed Up |
Improvement percentage |
Device2 |
Speed Up |
Improvement percentage |
|
1 |
81767.0 |
|
|
34269.60 |
|
|
|
8 |
30922.9 |
2.64 |
0.62 |
7305.41 |
4.69 |
0.79 |
|
16 |
37646.3 |
2.17 |
0.54 |
7090.44 |
4.83 |
0.79 |
|
32 |
32571.2 |
2.51 |
0.60 |
6990.56 |
4.90 |
0.80 |
|
64 |
32235.9 |
2.54 |
0.60 |
6922.36 |
4.95 |
0.80 |
|
* Time is in microseconds |
||||||
The accuracy of the classification is a very essential task that should be performed to prove the feasibility of the proposed approaches. Cardiac arrests can be interpreted through the analysis of the captured medical image, and thus the image of blood vessels that contain clots can be distinguished through the presence of a group of dark spots in the image of blood vessels. This indicates the presence of a clot or the possibility of its occurrence. This is what distinguishes the possibility of cardiac arrest in the target image from those that are classified as healthy blood vessels. The dark point appearing in the vascular images may not be clearly distinguished by the human eye. However, upon generating the grayscale image, the contrast point can be easily distinguished because it is considered an impurity point that differs from the surrounding points.
Both approaches are applied to the input image to detect the dark spots of blood vessels as shown in Figure 14. Table 3 displays 21 objects detected using the hybrid approach, which includes both the AKF and OMA algorithms, where the object with the largest area (#19 in table 3) is the image frame and objects with areas in the range of 1,3 are considered false objects (noises). Therefore, only six objects can be considered true objects. However, applying the AKF approach only detects three objects. These results demonstrate the feasibility of using the proposed hybrid approach to achieve more accurate results in the process of object identification.
Table 4 shows the accuracy of dark spot detection in blood vessels. The selection of the appropriate filter to be applied with OMA is a very critical issue since it has a high effect on the classification accuracy. Table 4 shows that the selection of hybrid AKF and OMA algorithms is very useful and appropriate for object detection, where the accuracy is improved from 50% to 83.3%.
Figure 14. AKF with OMA detected objects result
Table 3. Areas of detected objects
|
21 |
20 |
19 |
18 |
17 |
16 |
15 |
14 |
13 |
12 |
11 |
10 |
9 |
8 |
7 |
6 |
5 |
4 |
3 |
2 |
1 |
Object # |
|
1032 |
29 |
95294 |
1 |
1 |
2 |
1 |
1 |
1 |
1 |
1 |
1 |
1838 |
191 |
1 |
2 |
1 |
1 |
3 |
32 |
49 |
Area |
Table 4. Accuracy comparison between using AKF alone and AKF with OMA
|
Approach |
Number of true objects |
Number of detected objects |
Accuracy |
|
AKF |
6 |
3 |
50% |
|
Hybrid (AKF and OMA) |
6 |
5 |
83.3% |
The optical mapping algorithm is carefully studied, analyzed, implemented, and parallelized to detect cardiac arrest through the detection of dark spots in blood vessels. Different optimization and parallelization techniques were adopted and applied to reduce the execution time in order to obtain faster results to serve a group of people, patients and doctors. Since the selection of the appropriate filter to be applied with OMA is a very critical issue since it has a high effect on the classification accuracy, the adaptive Kalman filter is adopted and combined with the optical mapping algorithm. The experimental results demonstrate the efficiency of using hybrid AKF and OMA in the process of object detection, where the accuracy is improved from 50% to 83.3% compared to using only the AKF approach. The achieved speedup is five times compared with the sequential one, where more speedup is achieved by increasing the problem size and the number of iterations. This is due to the exploitation of the parallel and pipelined platform of multicore and the inherent parallelism in the proposed approach operations where many optimizations are incorporated.
[1] WHO, W.H.O. Cardiovascular diseases (CVDs). 11 June 2021. [Online]. Available: https://www.who.int/news-room/fact-sheets/detail/cardiovascular-diseases-(cvds), accessed on 1 July 2021.
[2] Meng, P., Irturk, A., Kastner, R., McCulloch, A., Omens, J., Wright, A. (2012). GPUacceleration of optical mapping algorithm for cardiac electrophysiology. In 2012 Annual International Conference of the IEEE Engineering in Medicine and Biology Society, pp. 1558-1561. https://doi.org/10.1109/EMBC.2012.6346240
[3] Semmlow, J.L. (2008). Biosignal and Medical Image Processing. CRC Press.
[4] Campestrini, C., Heil, T., Kosch, S., Jossen, A. (2016). A comparative study and review of different Kalman filters by applying an enhanced validation method. Journal of Energy Storage, 8: 142-159. https://doi.org/10.1016/j.est.2016.10.004
[5] Jarrah, A., Zaitoun, M. (2022). Optimised implementation of AVR system using particle swarm optimisation. International Journal of Computational Science and Engineering, 25(3): 272-284. https://doi.org/10.1504/IJCSE.2022.123114
[6] Yang, C.T., Chang, T.C., Wang, H.Y., Chu, W.C., Chang, C.H. (2011). Performance comparison with OpenMP parallelization for multi-core systems. In 2011 IEEE Ninth International Symposium on Parallel and Distributed Processing with Applications, Busan, Korea (South), pp. 232-237. https://doi.org/10.1109/ISPA.2011.60
[7] Almomany, A., Ayyad, W.R., Jarrah, A. (2022). Optimized implementation of an improved KNN classification algorithm using Intel FPGA platform: COVID-19 case study. Journal of King Saud University-Computer and Information Sciences, 34(6): 3815-3827. https://doi.org/10.1016/j.jksuci.2022.04.006
[8] Qu, F., Ripplinger, C.M., Nikolski, V., Grimm, C., Efimov, I.R. (2007). Three-dimensional panoramic imaging of cardiac arrhythmias in rabbit heart. Journal of Biomedical Optics, 12(4): 044019. https://doi.org/10.1117/1.2753748
[9] Wang, K., Lee, P., Mirams, G.R., Sarathchandra, P., Borg, T.K., Gavaghan, D.J., Kohl, P., Bollensdorff, C. (2015). Cardiac tissue slices: preparation, handling, and successful optical mapping. American Journal of Physiology-Heart and Circulatory Physiology, 308(9): H1112-H1125. https://doi.org/10.1152/ajpheart.00556.2014
[10] Attin, M., Clusin, W.T. (2009). Basic concepts of optical mapping techniques in cardiac electrophysiology. Biological Research for Nursing, 11(2): 195-207. https://doi.org/10.1177/1099800409338516
[11] Pollnow, S., Pilia, N., Schwaderlapp, G., Loewe, A., Dössel, O., Lenis, G. (2018). An adaptive spatio-temporal Gaussian filter for processing cardiac optical mapping data. Computers in Biology and Medicine, 102: 267-277. https://doi.org/10.1016/j.compbiomed.2018.05.029
[12] Allan, A.J. (2016). Examination of myocardial electrophysiology using novel panoramic optical mapping techniques. Doctoral dissertation, University of Glasgow.
[13] Christoph, J., Luther, S. (2018). Marker-free tracking for motion artifact compensation and deformation measurements in optical mapping videos of contracting hearts. Frontiers in Physiology, 9: 1483. https://doi.org/10.3389/fphys.2018.01483
[14] Jarrah, A., Al-Tamimi, A.K., Albashir, T. (2018). Optimized parallel implementation of extended Kalman filter using FPGA. Journal of Circuits, Systems and Computers, 27(1): 1850009.
[15] Curwen, R.W., Amini, A.A., Duncan, J.S., Lee, F. (1994). Tracking vascular motion in X-ray image sequences with Kalman snakes. In Computers in Cardiology 1994, pp. 109-112. https://doi.org/10.1109/CIC.1994.470237
[16] Salleh, S.H., Hussain, H.S., Swee, T.T., Ting, C.M., Noor, A.M., Pipatsart, S., Ali, J., Yupapin, P. (2012). Acoustic cardiac signals analysis: A Kalman filter–based approach. International Journal of Nanomedicine, 7: 2873. https://doi.org/10.2147/IJN.S32315
[17] Sung, D., Somayajula-Jagai, J., Cosman, P., Mills, R., McCulloch, A.D. (2001). Phase shifting prior to spatial filtering enhances optical recordings of cardiac action potential propagation. Annals of Biomedical Engineering, 29(10): 854-861. https://doi.org/10.1114/1.1408927
[18] Laughner, J.I., Ng, F.S., Sulkin, M.S., Arthur, R.M., Efimov, I.R. (2012). Processing and analysis of cardiac optical mapping data obtained with potentiometric dyes. American Journal of Physiology-Heart and Circulatory Physiology, 303(7): H753-H765. https://doi.org/10.1152/ajpheart.00404.2012
[19] Iravanian, S., Christini, D.J. (2007). Optical mapping system with real-time control capability. American Journal of Physiology-Heart and Circulatory Physiology, 293(4): H2605-H2611. https://doi.org/10.1152/ajpheart.00588.2007
[20] Pak, H.N., Liu, Y.B., Hayashi, H., Okuyama, Y., Chen, P.S., Lin, S.F. (2003). Synchronization of ventricular fibrillation with real-time feedback pacing: implication to low-energy defibrillation. American Journal of Physiology-Heart and Circulatory Physiology, 285(6): H2704-H2711. https://doi.org/10.1152/ajpheart.00366.2003
[21] Sung, D., Mills, R.W., Schettler, J., Narayan, S.M., Omens, J.H., McCulloch, A.D. (2003). Ventricular filling slows epicardial conduction and increases action potential duration in an optical mapping study of the isolated rabbit heart. Journal of Cardiovascular Electrophysiology, 14(7): 739-749. https://doi.org/10.1046/j.1540-8167.2003.03072.x
[22] Meng, P., Jacobsen, M., Kastner, R. (2012). FPGA-GPU-CPU heterogenous architecture for real-time cardiac physiological optical mapping. In 2012 International Conference on Field-Programmable Technology, pp. 37-42.
[23] Funke, M., Yang, Y., Lahtinen, A., Benninghoven-Frey, K., Kliesch, S., Neuhaus, N., Stukenborg, J., Jahnukainen, K. (2021). Z-scores for comparative analyses of spermatogonial numbers throughout human development. Fertility and Sterility, 116(3): 713-720. https://doi.org/10.1016/j.fertnstert.2021.04.019
[24] Phillips, D. (1994). Image Processing in C (Vol. 724). Lawrence: R & D Publications.
[25] Foussier, J., Teichmann, D., Jia, J., Misgeld, B., Leonhardt, S. (2014). An adaptive Kalman filter approach for cardiorespiratory signal extraction and fusion of non-contacting sensors. BMC Medical Informatics and Decision Making, 14(1): 1-15. https://doi.org/10.1186/1472-6947-14-37
[26] Hsia, S.C., Hsu, W.C. (2000). A parallel median filter with pipelined scheduling for real-time 1D and 2D signal processing. IEICE Transactions on Fundamentals of Electronics, Communications and Computer Sciences, 83(7): 1396-1404.
[27] Jarrah, A. (2016). Optimized parallel architecture of Kalman filter for radar tracking applications. Jordan J. Electr. Eng, 2(3): 215-230.
[28] Reina, G., Vargas, A., Nagatani, K., Yoshida, K. (2007). Adaptive Kalman filtering for GPS-based mobile robot localization. In 2007 IEEE International Workshop on Safety, Security and Rescue Robotics, pp. 1-6. https://doi.org/10.1109/SSRR.2007.4381270
[29] Bradski, G., Kaehler, A. (2008). Learning OpenCV: Computer vision with the OpenCV library. O'Reilly Media, Inc.
[30] Almomany, A., Al-Omari, A.M., Jarrah, A., Tawalbeh, M. (2020). Discovering regulatory motifs of genetic networks using the indexing-tree based algorithm: A parallel implementation. Engineering Computations, 38(1): 354-370. https://doi.org/10.1108/ec-02-2020-0108
[31] Almomany, A., Al-Omari, A., Jarrah, A., Tawalbeh, M., Alqudah, A. (2020). An OpenCL-based parallel acceleration of aSobel edge detection algorithm Using IntelFPGA technology. South African Computer Journal, 32(1): 3-26. https://doi.org/10.18489/sacj.v32i1.749
[32] Almomany, A., Jarrah, A., Al Assaf, A. (2022). FCM clustering approach optimization using parallel high-speed Intel FPGA technology. Journal of Electrical and Computer Engineering, 2022: 1-11. https://doi.org/10.1155/2022/8260283
[33] Abedalmuhdi, A., Wells, B.E., Nishikawa, K.I. (2017). Efficient particle-grid space interpolation of an FPGA-accelerated particle-in-cell plasma simulation. 2017 IEEE 25th Annual International Symposium on Field-Programmable Custom Computing Machines (FCCM), pp. 76-79. https://doi.org/10.1109/FCCM.2017.63
[34] Kim, W., Voss, M. (2011). Multicore desktop programming with Intel threading building blocks. IEEE Software, 28(1): 23-31. https://doi.org/10.1109/ms.2011.12
[35] Danielsson, J., Jägemar, M., Behnam, M., Sjödin, M., Seceleanu, T. (2018). Measurement-based evaluation of data-parallelism for OpenCV feature-detection algorithms. In 2018 IEEE 42nd Annual Computer Software and Applications Conference (COMPSAC), pp. 701-710. https://doi.org/10.1109/COMPSAC.2018.00105
[36] Ochoa, N.A., Silva-Moreno, A.A. (2007). Normalization and noise-reduction algorithm for fringe patterns. Optics Communications, 270(2): 161-168. https://doi.org/10.1016/j.optcom.2006.09.062
[37] Tsao, J. (2003). Interpolation artifacts in multimodality image registration based on maximization of mutual information. IEEE Transactions on Medical Imaging, 22(7): 854-864. https://doi.org/10.1109/TMI.2003.815077
[38] Jarrah, A., Almomany, A., Alsobeh, A.M., Alqudah, E. (2021). High-performance implementation of wideband coherent signal-subspace (CSS)-Based DOA algorithm on FPGA. Journal of Circuits, Systems and Computers, 30(11): 2150196. https://doi.org/10.1142/S0218126621501966
[39] Al Bataineh, A., Kaur, D., Jarrah, A. (2018). Enhancing the parallelization of backpropagation neural network algorithm for implementation on FPGA platform. In NAECON 2018-IEEE National Aerospace and Electronics Conference, pp. 192-196. https://doi.org/10.1109/NAECON.2018.8556656
[40] Wu, D., Zhang, C.J., Ji, L., Ran, R., Wu, H.Y., Xu, Y.M. (2021). Forest fire recognition based on feature extraction from multi-view images. Traitement du Signal, 38(3): 775-783. https://doi.org/10.18280/ts.380324