Fuchun Jiang* | Hongyi Zhang | Chenwei Feng | Chen Zhu
© 2022 IIETA. This article is published by IIETA and is licensed under the CC BY 4.0 license (http://creativecommons.org/licenses/by/4.0/).
OPEN ACCESS
This paper designs a deep learning-based closed-loop detection algorithm for indoor space. You only look once (YOLO) v3 was adopted to detect the objects in the scene, extract the semantic and position information of the non-dynamic objects contained in the current frame, and solve the similarities between the current frame and key historical frame, thereby completing closed-loop detection. In our network structure, the prior static semantic library is employed to differentiate and eliminate the dynamic objects in the scene, such that the network can apply to most indoor scenes. In addition, the closed-loop detection was made immune to the disturbance of dynamic objects. The extracted semantic information can be applied to modules like visual odometer and semantic maps.
simultaneous localization and mapping (SLAM), you only look once (YOLO) v3, closed-loop detection
Simultaneous localization and mapping (SLAM) refers to the process that a robot establishes its own global position in an unknown environment by acquiring external information with sensors, estimating poses, and incremental modelling of the environment [1].
During the mapping process, the robot resorts to closed-loop detection to judge whether a newly acquired image has appeared in the image series, i.e., whether the robot has arrived at the same location, or to obtain a new initial position after the loss of feature point registration [2].
As a key module of the SLAM, closed-loop detection aims to reduce the cumulative error during the environmental mapping. It plays an important role in the SLAM system. The long-term correctness of the estimated trajectory and map hinges on the accuracy of closed-loop detection. Besides, closed-loop detection provides the correlations between the current data and all historical data. If the tracking algorithm fails, the object can be positioned again based on closed-loop detection [3].
Closed-loop detection is essentially a problem of scene identification. In traditional visual SLAM, the closed-loop detection is achieved by the visual bag of words (BOW) model. The model collects a huge number of images, extracts the feature points from them, and divides these points into k classes through k-means clustering (KMC), forming a dictionary of the feature point set. After an image is inputted to the model, the feature points will be extracted, and each feature point will be assigned to a class by looking up the dictionary. The class of each feature point will be outputted in the form of a vector. The images are illustrated with the cluster features in the dictionary, in order to judge the similarity between two images [4].
The BOW model has been widely used for closed-loop detection. The reason is that most SLAM research is based on feature points. Thus, the BOW, which operates on feature points, becomes the preferred model. After all, the system has already extracted feature points on the front end. Using the feature points again for closed-loop detection would yield twice the result with half the effort [5]. However, the core of the BOW is to select the corresponding frames against a dictionary formed through clustering of traditional features. If the environment is very complex (e.g., uneven illumination, and occlusion), the BOW is easy to match images incorrectly. What is worse, the BOW needs to be trained offline on numerous images [6]. Furthermore, the BOW only highlights the presence/absence of words, failing to consider their relative spatial relationship. During the establishment of the dictionary, the feature point clusters have no practical meaning. It is impossible for researchers to judge the quality of the dictionary, based on the clustering results.
The closed-loop detection is essentially a problem of image description and similarity measurement. Meanwhile, deep learning relies on neural networks to learn the deep features of mages. In recent years, the rapid advancement of deep learning has spurred the research and development of graphic processing units (GPUs) with superior performance. As computers get faster and faster, embedded GPUs are widely implemented in SLAM systems [7]. More and more researchers began to apply deep learning to closed-loop detection and other links of the SLAM.
Hou et al. [8] depicted image features by convolutional neural network (CNN), and applied the features to the closed-loop detection of the visual loop. Their experimental results show that: the CNN-based image representation achieved a comparable performance as the most advanced traditional generation methods for artificial features, and greatly outshined the feature extraction speed than the traditional methods, when there were no significant illumination changes in the environment. The superiority of extraction speed was two orders of magnitude on the entry-level GPUs. With the aid of a deep neural network (DNN), Gao and Zhang [9] completed the closed-loop detection of the visual SLAM system. Specifically, a stacked autoencoder was trained to learn the feature representation, and a cyclic detection algorithm was called to find a closed loop in the similarity / difference matrix.
On the combination between deep learning and closed-loop detection, most of the existing studies merely replace traditional artificial feature representation with deep learning, and compute the similarity based on the extracted feature points. For humans, whether a place has been visited is judged based on various factors in the image, including object size, number of objects, and the relative position of objects. The robots should act as humans to realize closed-loop detection from a higher level, breaking away from the limitations of pixels.
Deep learning has been increasingly integrated to the SLAM in the fields of visual odometer, and semantic maps. Recently, marked progress is observed in the application of deep learning in target detection, i.e., how to identify the different objects in the original image, and to determine their classes and positions. The deep learning-based target detection methods are highly robust in complex environments with changing illumination and occlusions, and win the favor of SLAM researchers. For example, Liu [5] designed a semantic SLAM system based on visual sensors. In the link of visual odometer, target detection was performed to recognize the position and type of each object in each frame. On this basis, the feature points were skipped, and the positions and types of objects were used to compute the pose between adjacent frames. Drawing on the visual odometer for target detection, Zhang [6] introduced a target detection algorithm to the link of visual odometer, which excludes dynamic objects, and enhances the robustness of the SLAM frontend. Hence, it is a research hotspot to integrate deep learning, especially target detection techniques, with the SLAM system.
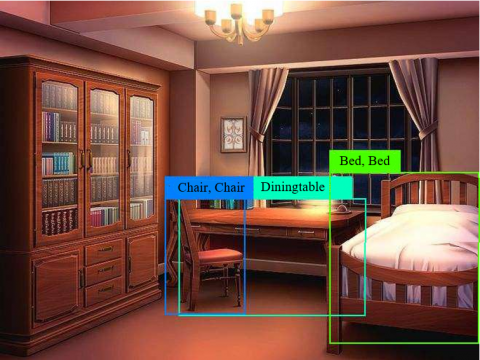
Figure 1. Prediction results of YOLO v3
Figure 2. Structure of YOLO v3
Through the above analysis, this paper designs an algorithm based on the target detection technique of deep learning. The algorithm detects the closed loop based on the objects and their relative position in the environment. In this way, the SLAM system acquires the ability to perceive objects in the environment. In addition, the detection results can be applied to the frontend visual odometer and the backend semantic mapping module.
2.1 Overview
Based on Darknet, you only look once (YOLO) v3 is an end-to-end target detection algorithm, which models and regresses the detection task to easily predict the bounding box position and class of each object. The prediction results of YOLO v3 is shown in Figure 1.
The detection flow of YOLO v3 mainly consists of the following steps: Firstly, the input image is adjusted to the specified scale to meet the needs of the network architecture. Next, the image is divided into small grids. The center of each grid falls on the target in that grid. Finally, the non-maximum suppression (NMS) is implemented to eliminate unwanted results, such that the same object will not be responded to by multiple grids. The NMS firstly obtains the target box with the highest confidence, and then computes the intersection over union (IOU) between any other box and the target box. If the IOU is greater than a threshold, the target box will be removed. In the end, the non-overlapping target box with the highest confidence is obtained (Figure 2).
2.2 Prediction of target bounding box
In YOLO v3, convolutional prediction is carried out, using (4+1+c)×k kernels (size: 1×1), on the three feature maps, where k is the number of bounding box priors (the default value of k is 3), and c is the number of classes predicted for the targets. Among the various parameters, 4k are responsible for predicting the offset of the target bounding box, k are responsible for predicting the probability for a target bounding box to contain targets, and ck are responsible for predicting the probability for the k bounding box priors to correspond to c classes.
The prediction flow of target bounding box is shown in Figure 3, where the dashed rectangle box is the preset bounding box, the solid-line rectangle box is the predicted bounding box obtained by the network offset. Note that cx and cy are the center coordinates of bounding box prior in the feature map, respectively; pw and ph are the width and height of bounding box prior in the feature map, respectively; tx, ty, tw, and th are the center offset, and aspect ratio of the bounding box predicted by the network, respectively; bx, by, bw, and bh are the center offset, and aspect ratio of the final bounding box, respectively. The formula in the right of the figure represents the conversion process from bounding box prior to the final prediction of the bounding box, where σ(x) is the sigmoid function to limit the predicted offset between 0 and 1.
2.3 Calculation of loss function
The loss function of YOLO v3 is mainly divided into three parts: target positioning loss Lloc(l, g), target confidence loss Lconf(o, c), and target classification loss Lcla (O,C), where λ1, λ2, and λ3 are coefficients of balance:
$L(O, o, C, c, l, g)$
$=\lambda_{1} L_{c o n f}(o, c)+\lambda_{2} L_{c l a}(O, C)+\lambda_{3} L_{l o c}(l, g)$
2.3.1 Target confidence loss
Target confidence loss can be understood as the probability for the target bounding box to contain targets. This loss Lconf(o,c) is a binary cross entropy, where oi∈{0,1} indicates whether the target bounding box i contains targets (0 means the box does not contain targets; 1 means the box contains targets); $\hat{C}_{i}$ is the sigmoid probability for the target bounding box to contain targets, which can be obtained by processing the predicted value with the sigmoid function:
$L_{\text {conf }}(o, c)=-\sum_{\hat{c}_{i}=\operatorname{Sigmoid}\left(c_{i}\right)}\left(o_{i} \ln \left(\hat{c}_{i}\right)+\left(1-o_{i}\right) \ln \left(1-\hat{c}_{i}\right)\right)$
2.3.2 Target classification loss
Target classification loss Lcla(O,C) is also a binary cross entropy, where Oij∈{0,1} indicates whether the target bounding box i contains type j targets (0 means the box does not contain such targets; 1 means the box contains such targets); $\hat{C}_{i j}$ is the sigmoid probability for the target bounding box to contain type j targets, which can be obtained by processing the predicted value $\hat{C}_{i j}$ with the sigmoid function:
$L_{c l a}(O, C)=-\sum_{i \in \text { Pos }} \sum_{j \in c l a}\left(O_{i j} \ln \left(\hat{C}_{i j}\right)+\left(1-O_{i j}\right) \ln \left(1-\hat{C}_{i j}\right)\right)$
$\hat{C}_{i j}=\operatorname{Sigmoid}\left(C_{i j}\right)$
2.3.3 Target positioning loss
Target positioning loss Lloc(l,g) is the quadratic sum between the actual offset and the predicted offset, where $\hat{l}$ is the coordinate offset of the predicted bounding box; $\hat{g}$ is the coordinate offset between the matching ground truth (GT) box and the default box; (bx, by, bw, bh) is the predicted parameters of the target bounding box; (cx, cy, pw, ph) is the parameters of the default bounding box; (gx, gy, gw, gh) is the parameters of the actual matching target bounding box:
$L_{l o c}(l, g)=\sum_{i \in p o s} \sum_{m \in\{x, y, w, h\}}\left(\hat{l}_{i}^{m}-\hat{g}_{i}^{m}\right)^{2}$
$\hat{l}_{i}^{x}=b_{i}^{x}-c_{i}^{x}, \hat{l}_{i}^{y}=b_{i}^{y}-c_{i}^{y}$
$\hat{l}_{i}^{w}=\log \left(b_{i}^{w} / p_{i}^{w}\right), \hat{l}_{i}^{h}=\log \left(b_{i}^{h} / p_{i}^{h}\right)$
$\hat{g}_{i}^{x}=g_{i}^{x}-c_{i}^{x}, \hat{g}_{i}^{y}=g_{i}^{y}-c_{i}^{y}$
$\hat{g}_{i}^{w}=\log \left(g_{i}^{w} / p_{i}^{w}\right), \hat{g}_{i}^{h}=\log \left(g_{i}^{h} / p_{i}^{h}\right)$
As shown in Figure 4, YOLO v3 target detection network is adopted to extract the semantic information from the current frame, including the coordinates of each object, the confidence of each object, and the position of the predicted box. After preprocessing the information, whether the state is initial is judged, i.e., whether key historical frame is available. If yes, the current frame is compared with key historical frame. If the similarity is greater then the preset threshold, then there is a loop; otherwise, the current frame is saved as a key historical frame. [11-14]
Figure 3. Prediction flow of target bounding box
Figure 4. Principle of closed-loop detection algorithm
3.1 Loop judgement
Precision and recall are important indicators of the quality of an algorithm. In the SLAM system, precision refers to the probability v that the loops extracted by the algorithm are true loops; recall refers to the probability that all true loops are correctly detected. Precision is more important to the SLAM system than recall, for false positive loops will add wrong edges to the backend pose graph. In severe cases, the optimization algorithms will yield completely wrong results. To guarantee the accuracy of closed-loop detection, the relevant thresholds were set to a relatively high level.
The loop judgement is composed of two parts: feature preprocessing and similarity calculation.
3.1.1 Preprocessing of semantic information
The image information collected by the camera are processed by the network to obtain the semantic information of the current frame, including the class of objects in the frame, the confidence of each object, and the position of each object in the image. Next, the objects with relatively high confidence are selected to represent the current image, in order to exclude the disturbance indued by incorrect identification, and enhance the tolerance of YOLO v3 target detection network. After that, the semantic information screened from the image is composed into a character string. By comparing the character strings, whether the current image is the same as the key historical frame is determined, revealing whether the two frames contain the same classes and number of objects.
The network should not recognize the dynamic objects like humans and animals as regions of interest (ROIs) in the indoor environment. Otherwise, when the robot returns to the original scene, it would observe incorrectly due to the disappearance of dynamic objects. Hence, an effective information library was established for the most common 20 classes of static objects in indoor scenes. Only if the detected object is found in that library, will it be used to represent the information of the current frame. Table 1 lists the classes of objects in the effective information library.
Table 1. Classes of objects in the effective information library
|
Chair |
Table |
Desk |
Sofa |
Bed |
|
lamp |
trashcan |
Side table |
door |
bookshelf |
|
keyboard |
computer |
Computer monitor |
fridge |
printer |
|
tv |
clock |
bench |
telephone |
Window |
3.1.2 Similarity calculation
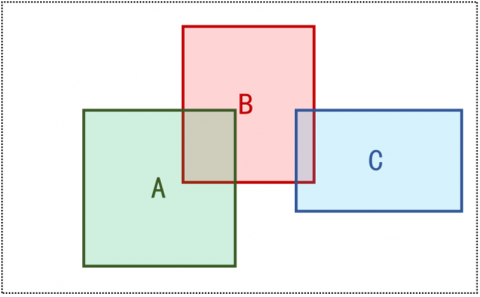
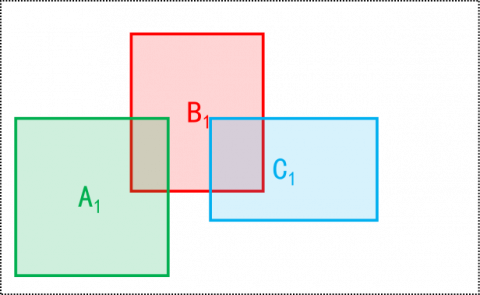
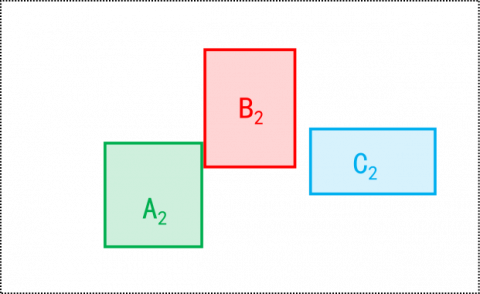
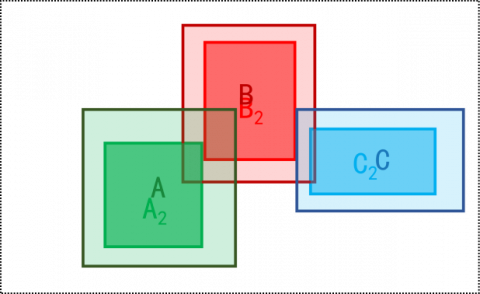
If the current frame and key historical frame are consistent, then the IOU and mean IOU (similarity) between the positions of the same object in the two images. Figures 5-10 explain the similarity calculation model. It is assumed that three objects A, B and C exist in the field of view of the camera. Figure 5 is the top view of the relative position between the objects and the camera. Figures 6, 7, and 9 are shot with the camera at the initial position, position 1, and position 2, respectively. Figures 8 and 10 illustrate the IOU calculation between the objects in Figure 6 and those in Figures 7 and 9, respectively.
Figure 5. Top view of the relative position between the objects and the camera
Figure 6. Image taken at the initial position
Figure 7. Image taken at position 1
Figure 8. IOU calculation between the objects in Figure 6 and those in Figure 7
(The same object is in the same color.)
Figure 9. Image taken at position 2
Figure 10. IOU calculation between the objects in Figure 6 and those in Figure 9
(The same object is in the same color.)
4.1 Environment
In our experiments, YOLO v3 target detection algorithm is adopted for closed-loop detection under the framework of Darknet. The computer used in the experiments has a central processing unit (CPU) of Inter® CoreTM i7-7700K CPU@4.20GHz, a memory of 8GB, and an adaptor of NVIDIA GeForce GTX 1080GPU. The parallel computing framework is CUDA9.0; the graphics processing unit (GPU)-accelerated library of primitives for deep neural networks is cuDNN9.0; the programming language is python 3.6.8.
4.2 Results
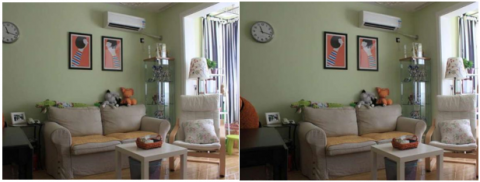
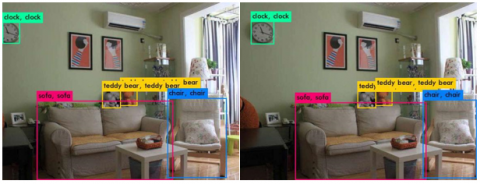
Figure 11 shows the images shot at the same position by the camera from different places. Image X was taken as the historical frame, and image Y as the current frame. YOLO v3 was adopted to extract the semantic information of each object, and its position in the image [15, 16].
Table 2 records the similarity calculation between the historical and current frames.
The results show that the mean IOU of the above control group was 0.48. The value was below the preset threshold of 0.7. Thus, the two frames do not form a loop.
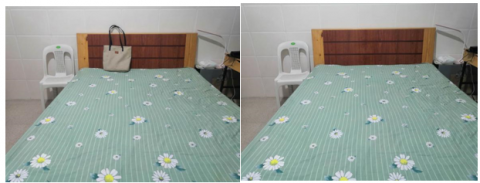
Figure 12 shows the images shot at the same position in the dynamic environment by the camera from the same place. Image X was taken as the historical frame, and image Y as the current frame. YOLO v3 was adopted to extract the semantic information of each object, and its position in the image. Table 3 records the similarity calculation between the historical and current frames.
The results show that the mean IOU of the above control group was 0.905. The value was greater the preset threshold of 0.8. Thus, the two frames form a loop.
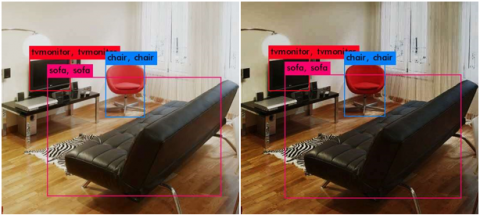
Figure 13 shows the images shot at the same position under changing illumination by the camera from the same place. Image X was taken as the historical frame, and image Y as the current frame. YOLO v3 was adopted to extract the semantic information of each object, and its position in the image. Table 4 records the similarity calculation between the historical and current frames.
The results show that the mean IOU of the above control group was 0.95. The value was above preset threshold. Thus, the two frames form a loop.
1. The original image
2: After network extraction
Figure 11. Images shot at the same position by the camera from different places
Table 2. Similarity calculation between the historical and current frames
|
Historical frame |
Current frame |
IOU |
||||
|
Semantic information |
Coordinates |
Effective? Yes/No |
Semantic information |
Coordinates |
Effective? Yes/No |
|
|
clock |
(0.04 0.17 0.07 0.12) |
Yes |
clock |
(0.10 0.17 0.10 0.13) |
Yes |
0.16 |
|
sofa |
(0.43 0.78 0.58 0.46) |
Yes |
sofa |
(0.51 0.79 0.55 0.45) |
Yes |
0.73 |
|
chair |
(0.82 0.76 0.25 0.45) |
Yes |
chair |
(0.89 0.77 0.23 0.44) |
Yes |
0.56 |
|
teddy bear |
(0.53 0.53 0.07 0.10) |
No (not in the semantic library) |
teddy bear |
(0.54 0.55 0.08 0.10) |
No (not in the semantic library) |
|
|
teddy bear |
(0.46 0.55 0.08 0.10) |
No (not in the semantic library) |
teddy bear |
(0.61 0.53 0.07 0.10) |
No (not in the semantic library) |
|
Table 3. Similarity calculation between the historical and current frames
|
Historical frame |
Current frame |
IOU |
||||
|
Semantic information |
Coordinates |
Effective? Yes/No |
Semantic information |
Coordinates |
Effective? Yes/No |
|
|
bed |
(0.53 0.57 1.02 0.90) |
Yes |
bed |
(0.54 0.57 1.00 0.96) |
Yes |
0.92 |
|
chair |
(0.22 0.40 0.14 0.38) |
Yes |
chair |
(0.22 0.40 0.15 0.40) |
Yes |
0.89 |
|
handbag |
(0.48 0.24 0.11 0.27) |
No (not in the semantic library) |
|
|
|
|
Table 4. Similarity calculation between the historical and current frames
|
Historical frame |
Current frame |
IOU |
||||
|
Semantic information |
Coordinates |
Effective? Yes/No |
Semantic information |
Coordinates |
Effective? Yes/No |
|
|
tvmonitor |
(0.20 0.34 0.17 0.15) |
Yes |
tvmonitor |
(0.20 0.34 0.17 0.15) |
Yes |
1 |
|
sofa |
(0.56 0.63 0.73 0.56) |
Yes |
sofa |
(0.56 0.63 0.74 0.58) |
Yes |
0.95 |
|
chair |
(0.52 0.42 0.16 0.24) |
Yes |
chair |
(0.52 0.42 0.17 0.25) |
Yes |
0.90 |
1: The original image
2: After network extraction
Figure 12. Images shot at the same position in the dynamic environment by the camera from different places
1: The original image
2: After network extraction
Figure 13. Images shot at the same position under changing illumination by the camera from different places
This paper designs an object-level closed-loop detection algorithm based on deep learning. Experimental results demonstrate that our algorithm can effectively detect closed loops, and eliminate the disturbance from dynamic objects in the scene, by introducing an effective semantic library. In addition, the deep learning-based target detection algorithm does not require the illumination intensity to be stable. It can make good judgements, even if the illumination changes. However, YOLO v3 was not retained in our experiments. To further enhance the experimental precision, the future research will train the network with data collected from the indoor environment.
[1] Yu, J. (2016). Research on SLAM method based on orb key frame Closed-loop Detection Algorithm. Zhejiang University of Technology, Zhejiang, China.
[2] Zhao, Y., Liu, G.L., Tian, G.H., Luo, Y., Wang, Z.R., Zhang, W., Li, J.W. (2017). A Survey of Visual SLAM Based on Deep Learning. Robot, 39(6): 889-896. https://doi.org/10.13973/j.cnki.robot.2017.0889
[3] Gao, X., Zhang, T. (2017). Visual SLAM Lecture 14: from Theory to Practice. Publishing House of Electronics Industry, Beijing, China.
[4] Angeli, A., Filliat, D., Doncieux, S., Meyer, J.A. (2008). Fast and incremental method for loop-closure detection using bags of visual words. IEEE transactions on robotics, 24(5): 1027-1037. https://doi.org/10.1109/TRO.2008.2004514
[5] Liu, Z. (2018). Semantic based map design SLAM. Beijing Jiaotong University, Beijing, China.
[6] Zhang, W. (2019). Research on SLAM of indoor vision based on object semantic information. Shandong University, Jinan, China.
[7] Aldegheri, S., Bombieri, N., Bloisi, D.D., Farinelli, A. (2019). Data flow ORB-SLAM for real-time performance on embedded GPU boards. In 2019 IEEE/RSJ International Conference on Intelligent Robots and Systems (IROS), 5370-5375. https://doi.org/10.1109/IROS40897.2019.8967814
[8] Hou, Y., Zhang, H., Zhou, S. (2015). Convolutional neural network-based image representation for visual loop closure detection. In 2015 IEEE International Conference on Information and Automation, pp. 2238-2245. https://doi.org/10.1109/ICInfA.2015.7279659
[9] Gao, X., Zhang, T. (2015). Loop closure detection for visual slam systems using deep neural networks. In 2015 34th Chinese Control Conference (CCC), pp. 5851-5856. https://doi.org/10.1109/ChiCC.2015.7260555
[10] Redmon, J., Farhadi, A. (2018). Yolov3: An incremental improvement. arXiv preprint arXiv:1804.02767.
[11] Su, H., Maji, S., Kalogerakis, E., Learned-Miller, E. (2015). Multi-view convolutional neural networks for 3d shape recognition. In Proceedings of the IEEE International Conference on Computer Vision, pp. 945-953.
[12] Li, B., Zhang, T., Xia, T. (2016). Vehicle detection from 3d lidar using fully convolutional network. arXiv preprint arXiv:1608.07916.
[13] Hirschmuller, H. (2007). Stereo processing by semiglobal matching and mutual information. IEEE Transactions on Pattern Analysis and Machine Intelligence, 30(2): 328-341. https://doi.org/10.1109/TPAMI.2007.1166
[14] Cai, Y., Liu, Z., Wang, H., Sun, X. (2017). Saliency based pedestrian detection in far infrared images. IEEE Access, 5: 5013-5019. https://doi.org/10.1109/ACCESS.2017.2695721
[15] Kang, J.K., Hong, H.G., Park, K.R. (2017). Pedestrian detection based on adaptive selection of visible light or far-infrared light camera image by fuzzy inference system and convolutional neural network-based verification. Sensors, 17(7): 1598. https://doi.org/10.3390/s17071598
[16] Song, S., Lichtenberg, S.P., Xiao, J. (2015). Sun RGB-d: A RGB-d scene understanding benchmark suite. In Proceedings of the IEEE Conference on Computer Vision and Pattern Recognition, pp. 567-576.