Sha Liu* | Yu Tan | Chunyang Wu
© 2022 IIETA. This article is published by IIETA and is licensed under the CC BY 4.0 license (http://creativecommons.org/licenses/by/4.0/).
OPEN ACCESS
Owing to visual blind spot areas and occasional negligence, combined sugarcane harvester drivers often make mistakes in field operation, some of which evolve into major accidents. To improve drivers’ perception of and response to warning information, this paper explores the optimal interaction mode of warning information for the cabin of combined sugarcane harvesters. A series of experiments were carried out on a stationary driving simulator to verify the driver experience and alarm efficiency of three modes of warning information, namely, text, audio, and image, as well as their dual-channel modes. The physiological data, such as electrodermal activity (EDA), photoplethysmography (PPG), and electroencephalogram (EEG), of eight subjects were collected through the experiments. On this basis, the cognitive load of drivers was analyzed under different modes of warning information. The motion feedback time was recorded to parse the driver’s recognition rate and reaction speed to the warning information, and the eye movement was captured to analyze the driver’s attention distribution. The results show that the recognition rate under the dual-channel mode of visual and audio is higher than that of the single-channel mode of text or image. The addition of the visual warning information (text or image) to the audio information reduces the attention distribution time, and the best reduction effect is achieved in the image plus voice mode. The EDA indices of latency, amp sum, and mean half decay time fully reflect the effect of alarm information modes on the subjects’ reaction speed and emotional stimulation. The image plus voice mode has the fastest response speed, smallest response to stimuli, and the best ability for emotional recovery than the other modes. The eye movement, some EDA indices, and EEG are more sensitive to stress reaction, while the HRV is not sensitive for analyzing drivers’ stress to the stimuli of warning information in a short time. The research results lay the basis for designing a more efficient and accurate reminder mode of warning information for combined sugarcane harvesters.
Human-machine interface (HMI), interaction mode, harvester cabin, physiological feedback, eye movement
In recent years, China has witnessed the rapid development of the agricultural machinery industry. The comprehensive mechanization rate of farming, planting, and harvesting has surpassed 71.25%, with the total number of combined harvesters exceeding 2 million [1]. The rising rate of agricultural mechanization is accompanied by frequent occurrence of agricultural machinery accidents, which brings huge losses to agricultural production, and threatens the safety of human life and property.
During the operation of combined sugarcane harvesters, accidents may arise from the following factors: visual blind area, lack of concentration [2], poor driving skills, and inability to handle danger information in complex environments [3]. About 30% of traffic accidents take place as large vehicles turn right, because the driver has visual blind spots [4]. This means the variation of traffic environment severely affects the driver’s distribution of attention [5].
To prevent accidents, the design of vehicle cabin has been repeatedly improved. Many intelligent driving systems are adopted to monitor and predict the danger of environmental changes, and issue warnings and instructions. These systems enable the driver to realize the impending danger, and react properly to avoid accidents. However, the effectiveness of danger warning depends on how the driver perceives the warning information. Hence, it is crucial to present the warning information appropriately.
To present the warning information for combined sugarcane harvesters efficiently and accurately, this paper develops a stationary driving simulator, and carries out a series of experiments. Based on the experimental data, the drivers’ attention distribution, reaction speed, cognitive load, and information recognition rate were analyzed under three modes of warning information, namely, text, audio, and image, as well as their dual-channel modes. Finally, several suggestions were drawn for the robust interaction design of cabin interface in combined sugarcane harvesters.
2.1 Driver state detection
Dangerous driving behaviors (e.g., over-following, and land departure), and crash rate can be effectively reduced by many technologies, such as collision warning system, and lane departure system [6]. For example, Zhao et al. [7] designed an auxiliary system that monitors the blind area of right turn for cars and trains. In the system, wave radar is employed to monitor the position and speed of pedestrians and vehicles in the blind area, and the frequency of buzzer sound and flashing light is utilized to remind the driver of potential danger. Fan [8] designed an anti-collision alarm device for roller operation: Ultrasonic detection is adopted to automatically measure the distance between obstacles within the visual blind area in the rear of the roller, and to issue sound and light alarms during the reversing process; The obstacle images and their distances are displayed synchronously on the video device set in the cabin; Then, the driver receives audio-visual alarms from a large alarm lamp and a high decibel vibrating horn, which tell him/her to brake the car.
Lisk et al. [9] applied the intelligent video management system (IVMS) on short-range commercial vehicles. The system can capture audio-visual events, and feedback the driver’s video recording to supervise and guide driver behaviors. The implementation of the IVMS lowered the number of accidents by 60%, and reduced the cost of accidents by 86%. Hickman and Hanowski [10] instructed instructing long-distance truck drivers of two transportation companies, and found that the dangerous driving behaviors were reduced by 37% and 52%, respectively. Kim et al. [11] combined internal information like driver’s face image and external road information to assess the driver's cognitive state, and reminded the driver to stay alert and avoid traffic accidents.
Some researchers have attempted to detect driver drowsiness based on eyelid closure [12]. But all of them adopted special embedded platforms with limited groups of users. Subsequently, some scholars have studied the smartphone-based driver monitoring and alarm system, which usually integrates cameras and electroencephalogram (EEG) sensors [13-15]. Cameras are adopted more extensively, due to the discomfort of wearing EEG sensors.
2.2 Driver access to information
Previous studies have shown that, while driving, 70% of the information gained by the driver are visual information, and 20% are audio information [16]. Intuitively speaking, images and languages are the two most direct and high-speed channels for people to acquire external information. In fact, languages are the most direct, effective, and convenient form of communication for human beings [17].
Many researchers have explored the relationship between cabin interface and the driver’s information reception. Iwao et al. [18] studied the truck drivers’ looking at the screen while driving, and discovered that their recognition rate of screen information is affected by driving tasks and warning sounds. The assignment of the second driving task shortened the time of staring at the screen, and reduced the recognition rate of screen information, calling for more attention from the driver. The recognition rate (100%) in the presence of the tone dropped to 50% in the absence of the tone. Wu and Boyle [19] evaluated the effects of 4 different audio warning messages on the inter-motion assistance system (IMA) for hazard detection. The results show that all warning messages significantly enhanced the driver’s ability to evade danger. Different warning messages led to significantly different reaction times, speeds, and eye movements of the subjects. The message brake now achieved the best effect in collision reduction and obstacle avoidance. The messages danger and vehicle on the left improved the driver’s ability to detect danger. In addition, the effectiveness of non-voice warning messages could be improved through training.
Desmet and Diependaele [20] noticed the significant impact of hands-free phone on driver behaviors: the drivers’ visual range was dispersed upon hearing audio signals, indicating that these signals affect the distribution of driver’s attention. Bell et al. [21] found that the number of dangerous driving behaviors nosedived in the presence of light warning plus immediate supervision. Yu and Lin [22] studied the driving quality, attention distribution, and interaction, when the drivers interacted in the modes of text, audio, and video, respectively. The results show that video interfaces had a much stronger interference than audio and text interfaces. The drivers can better understand the text, if important information is highlighted, and have an improved interactive experience.
Based on genetic algorithm (GA), Yao and Yuan [23] optimized warning information on the display interface of a road roller, and sorted out the prompt mode of warning information. But their research does not benefit the visual search of users, for the information is collected in real time from the interfaces, and the elements of the warning information are too many. Zhang et al. [24] discovered that the growing information display rate suppresses the information provision rate, and diversifies the effect of information color coding on the information provision rate. Zhang et al. [25] designed an effective information interface for rear-end collision alarm with both audio and visual alarm signals (buzzer and icon). Nevertheless, the effect of the interface was merely tested in the form of subjective questionnaire, the reaction time was not quantified, the interaction mode was configured simply, and the semantic factors in the signals were not fully explored.
The above research has effectively examined the information forms of early warning in general driving behaviors. For large and medium-sized agricultural equipment like sugarcane harvesters, the driver needs to complete various operations continuously, in addition to the said driving behaviors, in a noisy and shaking environment. So far, there is little report on how to set up early warning information such that the driver can perceive accidents faster, and make correct decisions. This paper aims to fill up this research gap.
This section compares the user feedback efficiency and recognition effect of different information modes, namely, sound, image, and text, in the accident alarms during the driving and operation of agricultural machinery.
3.1 Preparations
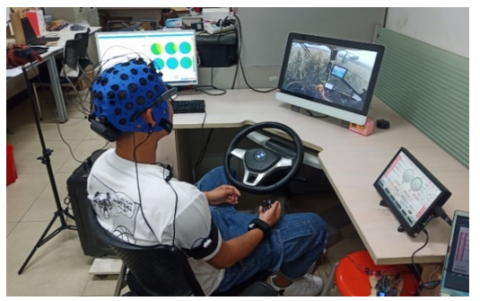
Figure 1. Fixed simulation cabin
The experimental instrument is a self-designed fixed simulation cabin (Figure 1). In front of the screen lies a driving simulator, which includes a steering wheel, and two pedals that emulate the swing of the lift from side to side.
According to field investigation, the 10-inch interactive screen of the sugarcane harvester was installed on the right side of the cabin. The screen could be rotated by any angle required by the driver. The screen was deployed with an angle of 45° to ensure the uniformity of experimental conditions. In the range of the visual angle, the driver can perceive the road conditions, and watch the warning interface. During the harvesting operation, the visual field of the driver is blocked by sugarcanes, and the focus distance is relatively short. In the course of driving, the driver has a relatively wide visual range, and a relatively long focus distance. Hence, the distance from the driver’s eyes to the screen was fixed at 100cm, providing a reference for subsequent analysis.
To record the reaction speed to prompts, a timer was designed with an Arduino development board. At each pedal, a pressure sensor was placed to capture the pressure. The sensor output was taken as the end signal of the timer, and used to measure the duration from screen change to the stepping down of the pedal. During the experiments, the attention distribution of each driver was tracked in real time by a wearable eye tracker. In addition, the real-time physiological data were collected in real time with electrodermal activity (EDA) sensors, photoplethysmography (PPG) sensors, and EEG sensors for subsequent analysis on reaction time and cognitive load.
Eight subjects, 4 males and 4 females, aged 18-25, were recruited. All of them have driving experience, hold a driving license for ordinary motor vehicles, and possess certain knowledge about the driving of agricultural machinery. Every subject has normal or corrected visual acuity, without color blindness or strabismus.
3.2 Experimental process
Before each experiment, the experimental purpose and tasks were introduced to the subjects. Every subject was given 10 mins to get familiar with the experimental environment and interactive interface. The experiment simulates the scenario that the subject drives a harvest in a straight line to harvest sugarcanes. Once he/she finishes harvesting one row, and turns to the next row, a visual blind spot would appear in the turning process. It is assumed that a danger (left or right) exists in this very spot. The driver would receive an alarm in different modes. In the real world, if there is a danger in the blind spot on the left side of the harvester, the driver should turn the harvester’s lift to the right rear by stepping on the left pedal. If there is a danger in the blind spot on the right side of the harvester, the driver should turn the harvester’s lift to the left rear by stepping on the right pedal. During the experiment, the subject needs to step on the left pedal after receiving the left danger signal, and the right pedal after receiving the right danger signal.
At the very beginning of each experiment, the subject was asked to sit in the designated position, and adjust his/her seat such that his/her eyes are 100 cm away from the screen. Five numbers 1-5 would appear randomly on the screen to simulate various driving actions, and keep the subject focused on the road. The subject was required to whisper the number he/she saw on the screen. In addition, several instructions, such as blowing the horn and steering wheel 90° (180°) left (right), would appear randomly on the screen. The subject must follow the instructions immediately.
Field tests show that the noise of the harvesting environment is around 69-82dB. Hence, the noise level of our experiments was set to 70dB, including the uniform working noise of the harvester, and the irregular interference audio signals, e.g., the sound of horns, and the chatting of pedestrians.
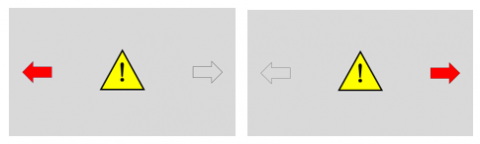
Our experiments verify whether the change of audio signal (visual signal) affects the attention distribution, reaction speed, cognitive load, and information recognition rate of the subjects, when the visual signal (audio signal) remains unchanged. Among them, the reaction speed and cognitive load were measured by EDA, PPG, and EEG. Hence, the experiments involve two independent variables, namely, visual signals in the form of text or image, and audio signals (meaningful voice and the beep sound), as well as three dependent variables, including the recognition rate of the warning message, the driver’s attention distribution, and the statistical values of EDA, PPG, and EEG. The signals of text and image mode are shown in Figures 2 and 3, respectively.
Figure 2. Signals of text mode
Figure 3. Signals of image mode
During each experiment, danger warning signals were issued on the interface from time to time. That is, the interface changed from the original state to the warning state occasionally. In each experiment, the left danger signal and right danger signal appeared twice, respectively, in a random order. Each signal was given off with a random audio interference. The moment that a signal appeared on the interface was regarded as the start time. Each time, a warning signal lasted 5s (the voice signal was broadcasted only once), i.e., the initial interface resumed after 5s.
Upon seeing a warning signal, the subject must give feedback, and step on one of the pedals, which triggers the pressure sensor on the pedal. The feedback duration was recorded by the timer. Under the guidance of the experimenter, the subject completed the tasks in different interaction modes. If the subject did not complete the required operation within 5s or execute the operation incorrectly, the task would be recorded as failed. After each task, the experimental instrument was reset by the experimenter. In the experiment, the subject was asked to turn his/her eyes to the warning screen after receiving an operational task to ensure that the displayed information was clearly visible.
3.3 Results analysis
3.3.1 Recognition rate
The warning signal in any information mode appeared 24 times in each experiment. Tables 1 and 2 show the recognition rates of warning information in different modes under the noisy environment, and a noise-free environment, respectively. It can be observed that noise significantly interfered with the recognition of alarm information. In both noisy and noise-free environments, the recognition rates under the dual-channel modes were higher than those under the single-channel modes: the recognition rates under text plus voice or text plus beep were higher than those under text or voice; the recognition rates under image plus voice or image plus beep were higher than those under image or voice.
Table 1. Recognition rate in noisy environment
|
Single-channel |
Text |
Image |
Voice |
|||
|
Recognition rate |
75% |
83.3% |
79.2% |
|||
|
Dual-channel |
Text plus voice |
Text plus beep |
Image plus voice |
Image plus beep |
Voice plus text |
Voice plus image |
|
Recognition rate |
95.8% |
100% |
100% |
100% |
95.8% |
100% |
Table 2. Recognition rate in noise-free environment
|
Single-channel |
Text |
Image |
Voice |
|||
|
Recognition rate |
75% |
58.3% |
100% |
|||
|
Dual-channel |
Text plus voice |
Text plus beep |
Image plus voice |
Image plus beep |
Voice plus text |
Voice plus image |
|
Recognition rate |
91.7% |
100% |
100% |
95.8% |
100% |
100% |
3.3.2 Attention distribution
In each experiment, the time distribution of attention of each subject was recorded by the eye movement method. The recorded data were subjected to the student’s t-test. The t-statistic can be calculated by:
$t=\frac{\bar{X}-\mu}{\frac{\sigma_{X}}{\sqrt{n-1}}}$
where, $\bar{X}$ and $\mu$ are the mean of the sample and the population, respectively; $\sigma_{X}$ is the standard deviation of the sample; $n$ is the sample size. The data analysis was supported by Excel and SPSS.
In the noisy environment, the mean time for the subjects’ gaze point to move from the screen to the road was 560.92ms under the text mode, and 426.44ms under the text plus voice mode. The sig. value of the t-test was 0.009<0.05, suggesting a marked difference between the mean time for the attention to turn to the road under the text mode, and that under the text plus voice mode; the feedback was faster under the latter mode than under the former mode.
The mean time for the subjects’ gaze point to move from the screen to the road was 818.08ms under the image mode, and 417.10ms under the image plus voice mode. The sig. value of the t-test was 0.000<0.05, indicating a statistically significant difference between the mean time of attention distribution under the image mode, and that under the image plus voice mode. The mean time under the former mode was slightly different from that under the latter mode.
In summary, the addition of sound to visual (text or image) warning information shortens the time for the subjects to distribute their attention. This is particularly true under the image plus voice mode.
3.3.3 Electrophysiological indices
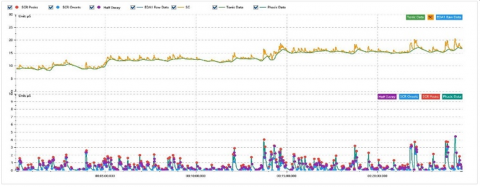
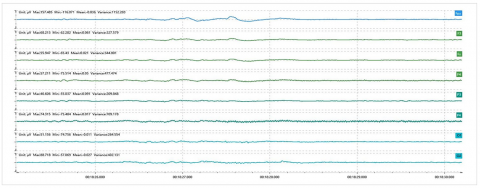
The SCR is an effective tool to measure the real-time emotional response and physiological changes of drivers [26, 27]. Thus, the EDA data of the subjects were subjected to an event correlation analysis. Figure 4 shows the complete record of a subject’s EDA in the noisy environment. Table 3 presents the mean values of the EDA indices of all subjects.
Table 3. Mean values of the EDA indices of all subjects
|
Model |
Latency (s) |
Amp sum (μS) |
SCL (μS) |
Mean half decay time (μS) |
|
Text |
1.343 |
0.449 |
11.514 |
1.069 |
|
Image |
1.629 |
0.424 |
11.038 |
1.294 |
|
Voice |
1.830 |
0.814 |
10.743 |
1.783 |
|
Text plus beep |
1.340 |
0.610 |
10.408 |
1.109 |
|
Text plus voice |
0.830 |
0.270 |
10.287 |
0.853 |
|
Image plus beep |
1.166 |
0.612 |
10.216 |
0.792 |
|
Image plus voice |
0.756 |
0.277 |
10.289 |
0.781 |
Table 4. Ranking by mean values of SCR indices and mean test results
|
|
Ranking |
SCR index |
One-way ANOVA |
|
Audio factors
|
Image plus voice < image plus beep < image |
latency |
F = 3.533, P = 0.035 |
|
Image plus beep < image |
latency |
P>0.05 |
|
|
Image plus voice < image |
latency |
F=7.642, P=0.008 |
|
|
Visual factors |
Image plus voice < text plus voice < voice |
latency |
F=8.781, P=0.000 |
|
Image plus voice < text plus voice < voice |
mean half decay time. |
F=5.236, P=0.008 |
|
|
Text plus voice < voice |
latency |
F=11.000, P=0.002 |
|
|
mean half decay time |
F=7.353, P=0.010 |
||
|
Image plus voice < voice |
latency |
F=13.832, P=0.001 |
|
|
mean half decay time |
F=8.620, P=0.005 |
Figure 4. EDA image of a subject in the noisy environment
On SPSS, a one-way analysis of variance (ANOVA) was performed on each SCR index under single-channel modes. Comparing the mean values of multiple samples, it was found that the EDA indices under different visual modes (text and image) were not significantly different, when the audio signals were consistent; these indices under different audio modes (beep and voice) were not significantly different, when the visual signals were consistent. Next, the EDA indices under the single-channel modes were compared with those under the corresponding dual-channel modes. A one-way ANOVA was conducted on each SCR index under the modes of image, image plus beep, and image plus voice. The results show no significant difference in mean latency. By feedback speed, the different modes can be ranked in descending order as image plus voice, image plus beep, and image.
Furthermore, an one-way ANOVA was carried out on the SCR indices under the modes of voice, text plus voice, and image plus voice. It is clear that the three modes differed significantly in the mean values of latency, and mean half decay time. Similarly, another one-way ANOVA was implemented on the SCR indices under the modes of voice, text plus voice, and image plus voice. The results reveal that the three modes differed significantly in the mean values of latency, and mean half decay time, but the difference did not significantly affect SCL (Table 4).
Overall, latency and mean half decay time could fully reflect the variation in the subjects’ reaction speed, and the effect of different alarm modes on driver emotions. The subjects responded faster under the image plus voice mode than under the other modes. Under this mode, the stimulus invokes a relatively small response, and the subjects could recover better emotionally. Thus, the image plus voice is the ideal mode for prompting alarm information.
3.3.4 Heart rate variability (HRV)
The HRV, which depends on the autonomic nervous system, is an important indicator of the change of psychological load. Some studies have shown that the HRV decreases with the growing stress [28]. The most reliable HRV indices that differentiate between stressful and non-stressful situations include the square root of the mean squared differences of successive R-R intervals (RMSSD), the average of normal-to-normal R-R intervals (AVNN), and the standard deviation of normal-to-normal R-R intervals (SDNN) [29, 30]. The mean R-R interval and the time domain parameter (pNN50) are significantly lower in the stressful state with mental task than in the relaxed state. The stress would increase the low-frequency (LF) / high-frequency (HF) ratio, an important frequency-domain index of sympathetic activity. However, some scholars reported that the LF/HF ratio at rest is not significantly different from that under mental tasks [31].
Garcia et al. [32] proposed a method based on the HRV, especially NN50 and pNN50, to evaluate the psychological differences between drivers under different driving conditions. It was learned that the NN50 and pNN50 values of the driver operating under no event were higher than those of the driver executing lane change, turning, and stop. Their results demonstrate that NN50 and pNN50 can be used to judge the driver’s stress state, and clarify whether the driver is ready to take over an autopiloting vehicle [32].
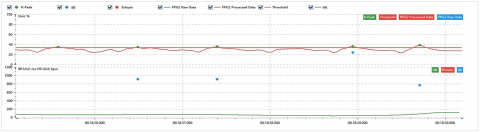
In our experiments, the HRV signals were recorded by PPG sensors. Figure 5 shows the PPG data acquired from a subject within 5s upon receiving the right danger signal under the image mode in a noisy environment.
The LF/HF ratio of each subject was analyzed to reveal his/her stress state. No significant difference was observed between the mean values of the LF/HF ratio. For a few subjects, there was a significant difference in that ratio between the image mode and image plus beep mode (P=0.001), and between the voice mode and text plus voice mode (P=0.034). The image plus beep mode had a lower LF/HF ratio than the image mode. A possible reason is that the addition of audio signal to the image mode reduces the subjects’ cognitive stress. Besides, the voice mode had a much smaller LF/HF ratio than the image plus voice mode and the text plus voice mode, and the cognitive stress of the subjects was lower under the single-signal mode than under the dual-signal modes.
The time-domain indices, NN50 and pNN50, are proven indices of parasympathetic control [33]. However, no significant difference in these indices was observed between different modes. This is probably because the recording (stimulus) lasts only 5s.
In summary, the HRV indices were not as sensitive as the EDA indices in response to stress and pressure. Since the warning information can be recognized very quickly, the HRV indices are not suitable for pressure load evaluation.
Figure 5. PPG data of a subject within 5s upon receiving the right danger signal under the image mode in a noisy environment
3.3.5 EEG indices
Excessive stress causes pain, and adversely affects our cognitive function, making it easier for us to make errors [34]. The resulting rise of error rate is related to the inhibitory control of the brain. Inhibition is usually defined as the deliberate limitation of planning or dominant response. It is a crucial mechanism for the brain to operate normally in emergencies. It is meaningful to study how stress affects inhibitory control in driving [35, 36].
Some scholars have discovered that specific EEG patterns can be observed earlier than electromyography (EMG) signals of brake pedal response [37]. When an emergency occurs during driving, the first brain process of the driver is inhibition, which guides the movement planning and the responses (e.g., braking) to avoid traffic accidents [38, 39]. The inhibition increases the values of δ and θ [40]. The variation pattern and expression of the δ wave in EEG reflect how much negative psychosocial stimulation affects the brain function [41]. In general, θ waves only appear in healthy adults, when they are asleep, especially when they are frustrated, moved, or depressed.
The α wave is the main electrical activity of the cerebral cortex, when the subject is awake and quiet. Normally, α waves are abundant during the acceptance and rejection of tasks. Besides, β waves, which represent the awakening of the brain, are the main electrical activity in the excited state of the cerebral cortex, indicating that the subject is especially alert, attentive, and nervous. These waves can be adopted to explore the brain state, when emotional changes are induced by visual stimuli [42]. Moreover, γ waves, which integrate information processing and feedback, play an important role in the cognitive activities and the information transmission in the human brain. From the angle of inhibition operation, Jung-tai King et al. [43] quantified the brain activities in emergency driving, by exerting stress on subjects under time pressure. The results show that the β and γ indices in frontal and central regions were significantly correlated with driver inhibition. The β and γ band power under the stress state were much higher than those under the normal state. Plus, the β and γ indices were more active than δ and θ.
In our experiments, the EEG data were collected by the deployed sensors. Figure 6 displays the EEG data collected from a subject within 5s upon receiving the right danger signal in under the image mode in the noisy environment.
The previous studies have concluded that β and γ waves are suitable for studying the electrical activity of the human brain under tasks. In our experiments, the β and γ band data of each subject were collected under different information modes, analyzed statistically, and subjected to a one-way ANOVA.
Figure 6. EEG data collected from a subject within 5s upon receiving the right danger signal in under the image mode in the noisy environment
The test results show that most subjects had statistically significant differences in the β and γ band data under the text and voice modes (P < 0.05), and under the image and voice modes (P < 0.05). The total and mean energies of β and γ under the voice mode were much smaller than those in the text and image modes. In other words, the stimuli generate a much smaller pressure under the voice mode than under the latter two modes. No significant difference was observed between other modes.
Next, a one-way ANOVA was performed on the δ and θ band data of each mode. No results similar to those of β and γ bands were found. In general, the total and mean energies of δ and θ bands under the voice mode were lower than those in the text and image modes, but the gap was not statistically significant. Hence, the β and γ indices are more obvious than δ and θ.
(1) The presentation mode of alarm information affects the recognition rate, attention distribution, reaction speed, and cognitive load of drivers. In the real (noisy) operating environment of the sugarcane harvester, the drivers have higher recognition rate, faster reaction speed, and shorter distraction time under the dual-channel modes (visual plus audio) than under single-channel modes. Between single-channel modes, the cognitive load of the drivers under the voice mode is significantly lower than that under the text or image mode. The image plus voice mode boasts the fastest reaction speed, the smallest response to stimuli, the strongest recovery energy, and the swiftest attention shift from the screen to the road. In the interaction design of cabin interface, the dual-channel mode of visual plus audio is better than the single-channel mode of visual or audio, and the best dual-channel mode is image plus voice.
(2) Out of the various physiological feedback data, the eye movement, some EDA indices, and EEG are more sensitive to stress reaction. The HRV and other physiological indices are not so sensitive.
(3) Our experiments only target three single-channel modes (text, image, and voice), and several dual-channel modes (different combinations between visual modes of text and image and audio modes of voice and beep), without analyzing the multi-channel modes involving three or more modes. Besides, the simulations were all conducted in the lab rather than the real operating environment. To acquire driver information more efficiently and accurately, the future work will further study the modes of dynamic graphics and somatosensory.
This work was funded by Beijing Social Science Foundation (Grant No.: 19ytb018). The experimental equipment and techniques were supported by Kingfar International Inc. and Ms. Gao Ying.
[1] Hou, F.A. (2021). Prediction of main indexes of agricultural mechanization development in China during the 14th Five-year Plan period. Agriculture Machinery Technology Extension, 2021(11): 7-9. https://doi.org/10.3969/j.issn.1671-3036.2021.11.003
[2] Chan, M., Singhal, A. (2013). The emotional side of cognitive distraction: Implications for road safety. Accident Analysis & Prevention, 50: 147-154. https://doi.org/10.1016/j.aap.2012.04.004
[3] Li, X.Y. (2021). Agricultural machinery accident notification 2020 - driver error is the main cause of agricultural machinery accidents. China Agricultural Machinery Safety Supervision, 2021(03): 13-14.
[4] Wu, J., Kong, J. (2010). Blind zone of vehicle rearview mirrors and its forecast methods. Journal of Wuhan University of Technology (Information & Management Engineering), 32(6): 958-961.
[5] Ren, Y.Y., Li, X.S., Zheng, X.L. (2018). Study on driver attention allocation under common driving behaviors. In CICTP 2018: Intelligence, Connectivity, and Mobility, 1743-1752. Reston, VA: American Society of Civil Engineers. https://doi.org/10.1061/9780784481523.173
[6] Merrikhpour, M., Donmez, B., Battista, V. (2014). A field operational trial evaluating a feedback–reward system on speeding and tailgating behaviors. Transportation Research Part F: Traffic Psychology and Behaviour, 27(Part A): 56-68. https://doi.org/10.1016/j.trf.2014.09.002
[7] Zhao, G.Q., Wang, X.Y., Zhang, X.D., Deng, J.Y., Han, R. (2019). Design of auxiliary monitoring system for right turn bending blind zone of trailer trains. Forestry Machinery & Woodworking Equipment, 47(8): 40-42. https://doi.org/10.3969/j.issn.2095-2953.2019.08.009
[8] Fan, Y. (2016) Study on anti-collision alarm device for roller operation. Public Communication of Science & Technology, 155(2): 80, 89.
[9] Lisk, D., Cruice, F., Pollard, T. (2013). How perdue farms inc. implemented a video-based driver risk management program. In ASSE Professional Development Conference and Exposition. OnePetro. Paper Number: ASSE-13-692.
[10] Hickman, J.S., Hanowski, R.J. (2011). Use of a video monitoring approach to reduce at-risk driving behaviors in commercial vehicle operations. Transportation Research Part F: Traffic Psychology and Behaviour, 14(3): 189-198. https://doi.org/10.1016/j.trf.2010.11.010
[11] Kim, S., Rammohan, M., Lee, M. (2015). In-attention state monitoring based on integrated analysis of driver’s headpose and external environment. In International Conference on Neural Information Processing, 601-608. Springer, Cham. https://doi.org/10.1007/978-3-319-26535-3_68
[12] Wu, Q., Sun, B.X., Xie, B., Zhao, J.J. (2010). A perclos-based driver fatigue recognition application for smart vehicle space. In 2010 Third International Symposium on Information Processing, pp. 437-441. https://doi.org/10.1109/ISIP.2010.116
[13] Dasgupta, A., Rahman, D., Routray, A. (2018). A smartphone-based drowsiness detection and warning system for automotive drivers. IEEE Transactions on Intelligent Transportation Systems, 20(11): 4045-4054. https://doi.org/10.1109/TITS.2018.2879609
[14] Wan, Z., He, J., Voisine, A. (2013). An attention level monitoring and alarming system for the driver fatigue in the pervasive environment. In International Conference on Brain and Health Informatics, pp. 287-296. Springer, Cham. https://doi.org/10.1007/978-3-319-02753-1_29
[15] You, C.W., Lane, N.D., Chen, F., Wang, R., Chen, Z., Bao, T.J., Campbell, A.T. (2013). Carsafe app: Alerting drowsy and distracted drivers using dual cameras on smartphones. In Proceeding of the 11th Annual International Conference on Mobile systems, Applications, and Services, pp. 13-26. https://doi.org/10.1145/2462456.2465428
[16] Liu, D. (2013). Design research of interactive information visualization on web page. Jiangnan University.
[17] Chen, Z.G. (2003) Design and implementation of interactive drawing system based on speech recognition technology. Dalian University of Technology. https://doi.org/10.7666/d.y636649
[18] Iwao, M., Horiguchi, A., Kobayashi, M. (2002). Study on behavior of cab-over truck driver looking at a display while driving. JSAE Review, 23(4): 489-494. https://doi.org/10.1016/S0389-4304(02)00228-X
[19] Wu, X., Boyle, L.N. (2021). Auditory messages for intersection movement assist (IMA) systems: Effects of speech-and nonspeech-based cues. Human Factors, 63(2): 336-347. https://doi.org/10.1177/0018720819891977
[20] Desmet, C., Diependaele, K. (2019). An eye-tracking study on the road examining the effects of handsfree phoning on visual attention. Transportation Research Part F: Traffic Psychology and Behaviour, 60: 549-559. https://doi.org/10.1016/j.trf.2018.11.013
[21] Bell, J.L., Taylor, M.A., Chen, G.X., Kirk, R.D., Leatherman, E.R. (2017). Evaluation of an in-vehicle monitoring system (IVMS) to reduce risky driving behaviors in commercial drivers: Comparison of in-cab warning lights and supervisory coaching with videos of driving behavior. Journal of Safety Research, 60: 125-136. https://doi.org/10.1016/j.jsr.2016.12.008
[22] Yu, Z., Lin, X. (2020). Social car: The research of interaction design on the driver's communication system. Concurrency and Computation: Practice and Experience, 32(6): e5139. https://doi.org/10.1002/cpe.5139
[23] Yao, J., Yuan, M.D. (2019). Research on optimization design of warning information on display screens of road roller. Industrial Design, 2019(10): 157-160. https://doi.org/10.3969/j.issn.1672-7053.2019.10.068
[24] Zhang, L., Yang, W., Wang, J.P., Zhou, Y.C. (2018) Research on the effects of information display characteristics on information presentation ratio under task interruptions of human-computer interaction. Value Engineering, 37(14): 292-295.
[25] Zhang, H., Cheng, B., Shi, J.G., Feng, R.J. (2008). Design of man-machine information interface on automobile alarming system. Tractor & Farm Transporter, 2: 71-72.
[26] Nisa'Minhad, K., Ali, S.H.M., Khai, J.O.S., Ahmad, S.A. (2016). Human emotion classifications for automotive driver using skin conductance response signal. In 2016 International Conference on Advances in Electrical, Electronic and Systems Engineering (ICAEES), pp. 371-375. https://doi.org/10.1109/ICAEES.2016.7888072
[27] Setz, C., Arnrich, B., Schumm, J., La Marca, R., Tröster, G., Ehlert, U. (2009). Discriminating stress from cognitive load using a wearable EDA device. IEEE Transactions on Information Technology in Biomedicine, 14(2): 410-417. https://doi.org/10.1109/TITB.2009.2036164
[28] Reijmerink, I., van der Laan, M., Cnossen, F. (2020). Heart rate variability as a measure of mental stress in surgery: A systematic review. International Archives of Occupational and Environmental Health, 93(7): 805-821. https://doi.org/10.1007/s00420-020-01525-6
[29] Dalmeida, K.M., Masala, G.L. (2021). HRV features as viable physiological markers for stress detection using wearable devices. Sensors, 21(8): 2873. https://doi.org/10.3390/s21082873
[30] Amato, F., Mazzocca, N., Moscato, F., Vivenzio, E. (2017). Multilayer perceptron: an intelligent model for classification and intrusion detection. In 2017 31st International Conference on Advanced Information Networking and Applications Workshops (WAINA), pp. 686-691. https://doi.org/10.1109/WAINA.2017.134
[31] Taelman, J., Vandeput, S., Spaepen, A., Huffel, S.V. (2009). Influence of mental stress on heart rate and heart rate variability. In 4th European conference of the international federation for medical and biological engineering, 1366-1369. Springer, Berlin, Heidelberg. https://doi.org/10.1007/978-3-540-89208-3_324
[32] Garcia, F.C., Kubo, T., Chang, C.L., Hisada, M., Bando, T., Kato, M., Ikeda, K. (2020). Evaluating mental state of drivers in automated driving using heart rate variability towards feasible request-to-intervene. In 2020 IEEE International Conference on Systems, Man, and Cybernetics (SMC), pp. 3454-3459. https://doi.org/10.1109/SMC42975.2020.9283356
[33] Jobbágy, Á., Majnár, M., Tóth, L.K., Nagy, P. (2017). HRV-based stress level assessment using very short recordings. Periodica Polytechnica Electrical Engineering and Computer Science, 61(3): 238-245. https://doi.org/10.3311/PPee.10075
[34] Cottrell, N.D., Barton, B.K. (2012). The impact of artificial vehicle sounds for pedestrians on driver stress. Ergonomics, 55(12): 1476-1486. https://doi.org/10.1080/00140139.2012.724452
[35] Schwabe, L., Höffken, O., Tegenthoff, M., Wolf, O.T. (2013). Stress-induced enhancement of response inhibition depends on mineralocorticoid receptor activation. Psychoneuroendocrinology, 38(10): 2319-2326. https://doi.org/10.1016/j.psyneuen.2013.05.001
[36] Yu, R. (2016). Stress potentiates decision biases: A stress induced deliberation-to-intuition (SIDI) model. Neurobiology of Stress, 3: 83-95. https://doi.org/10.1016/j.ynstr.2015.12.006
[37] Haufe, S., Treder, M.S., Gugler, M.F., Sagebaum, M., Curio, G., Blankertz, B. (2011). EEG potentials predict upcoming emergency brakings during simulated driving. Journal of Neural Engineering, 8(5): 056001. https://doi.org/10.1088/1741-2560/8/5/056001
[38] Kim, H.G., Cheon, E.J., Bai, D.S., Lee, Y.H., Koo, B.H. (2018). Stress and heart rate variability: A meta-analysis and review of the literature. Psychiatry Investigation, 15(3): 235-245. https://doi.org/10.30773/pi.2017.08.17
[39] Sonnleitner, A., Treder, M.S., Simon, M., Willmann, S., Ewald, A., Buchner, A., Schrauf, M. (2014). EEG alpha spindles and prolonged brake reaction times during auditory distraction in an on-road driving study. Accident Analysis & Prevention, 62: 110-118. https://doi.org/10.1016/j.aap.2013.08.026
[40] Putman, P., van Peer, J., Maimari, I., van der Werff, S. (2010). EEG theta/beta ratio in relation to fear-modulated response-inhibition, attentional control, and affective traits. Biological Psychology, 83(2): 73-78. https://doi.org/10.1016/j.biopsycho.2009.10.008
[41] Zhang, C., Zhao, Z.F., Li, J. (2015). Research on relationship of four common syndromes of ‘Rigid-Gentle Syndrome Differentiation’ of psychosomatic diseases and δ and θ wave change in brain electrical activity mapping. Global Traditional Chinese Medicine, 2015(8): 916-920. https://doi.org/10.3969/j.issn.1674-1749.2015.08.006
[42] Chen, Z.H., Su, Y. (2015). Beta rhythm synchronous research based on emotional change generated by visual stimulation. Journal of Dalian Jiaotong University, 159(4): 93-96.
[43] King, J.T., Prasad, M., Tsai, T., Ming, Y.R., Lin, C.T. (2018). Influence of time pressure on inhibitory brain control during emergency driving. IEEE Transactions on Systems, Man, and Cybernetics: Systems, 50(11): 4408-4414. https://doi.org/10.1109/TSMC.2018.2850323