Mamunur Rashid | Mahfuzah Mustafa* | Norizam Sulaiman | Nor Rul Hasma Abdullah | Rosdiyana Samad
© 2021 IIETA. This article is published by IIETA and is licensed under the CC BY 4.0 license (http://creativecommons.org/licenses/by/4.0/).
OPEN ACCESS
Nowadays, many studies have been conducted to assess driver fatigue, as it has become one of the leading causes of traffic crashes. However, with the use of advanced features and machine learning approaches, EEG signals may be processed in an effective way, allowing fatigue to be detected promptly and efficiently. An optimal channel selection approach and a competent classification algorithm might be viewed as a critical aspect of efficient fatigue detection by the driver. In the present framework, a new channel selection algorithm based on correlation coefficients and an ensemble classifier based on random subspace k-nearest neighbour (k-NN) has been presented to enhance the classification performance of EEG data for driver fatigue detection. Moreover, power spectral density (PSD) was used to extract the feature, confirming the presented method's robustness. Additionally, to make the fatigue detection system faster, we conducted the experiment in three different time windows, including 0.5s, 0.75s, and 1s. It was found that the proposed method attained classification accuracy of 99.99% in a 0.5 second time window to identify driver fatigue by means of EEG. The outstanding performance of the presented framework can be used effectively in EEG-based driver fatigue detection.
electroencephalogram (EEG), driver fatigue, channel selection, ensemble classifier, correlation coefficient, random subspace k-NN
The frequent occurrence of traffic accidents has led to social problems that endanger human life and property. It is estimated by World Health Organization (WHO) that over 1.2 million people die every year in traffic accidents, and millions are injured or crippled [1]. There is now an upswing in traffic accidents, which has gained widespread attention from society and government to this problem [2]. Since traffic accidents are so common, it is therefore absolutely essential to work on finding ways to prevent traffic accidents worldwide. Researchers found that 20–30% of all traffic accidents are caused by fatigued driving (FD), which means that FD is a major cause of traffic accidents [2]. When drivers are fatigued, they become easily distracted, less attentive, and their brain is less responsive, increasing the likelihood of a traffic accident [3]. FD detection (FDD) techniques have widespread use in the prevention of traffic accidents and have grown progressively in popularity among automotive industry, government organizations, and researchers in recent years.
Currently, three distinct categories of driving fatigue detection methods are available, including vehicle-based approaches, facial behaviour-based approaches and physiological approaches [4]. Vehicle-based approaches mainly include drivers’ acceleration, braking, lane position, steering angle, and handle movement patterns [5-7]. Such measurements are easily obtainable but dependent on vehicle types, driving habits, or road conditions. The facial behaviour-based approach is generally observed by the vehicle driver's behavioural and physical status, including head position, facial features, steering errors, reaction time and lane deviation [8]. However, these measurements tend to be unstable under certain conditions, such as poor lighting, bad weather, at night, or when a driver is wearing eyeglasses [9]. The physiological approach makes use of bio-signals that are associated with driving fatigue, including electrooculography (EOG) to assess eye movement [10], electroencephalography (EEG) [11] to assess brain state, electrocardiography (ECG) to measure heart rate variability [12], and electromyography (EMG) to assess muscle activity [5]. Most importantly, EOG, EEG, ECG, and surface EMG have all been investigated as physiological measures of driving fatigue detection with particular benefits and drawbacks to each other [4]. In the measurement of physiological approach, the electrodes are placed on the body surface, and this leads to it being considered intrusive in nature [13]. For example, EOG signals are retrieved through electrodes that are positioned near the eye, which can impair the ability to drive. Measurement of ECG can be performed using less intrusive methods; however, the inter-subject variability of ECG signals makes it difficult to design a generic driving fatigue detection system that is applicable to everyone. The usefulness of surface EMG in determining real-time driving fatigue is somewhat restricted [8]. More recently, researchers have started to apply the EEG for detecting driving fatigue in which several aspects of EEG make it potentially useful to detect driving fatigue, including the high portability, high temporal resolution and outstanding sensitivity to brain state. More specifically, EEG measures the neural activity of the scalp surface non-invasively to determine whether the brain is fatigued or not [4]. However, the multiple-electrode techniques to retrieve EEG signal is vulnerable to external influences, and extracting informative features from noisy EEG signals is crucial for successful fatigue detection while operating a vehicle [6]. Multichannel EEG recording provides a thorough record of EEG activity, however, certain channels carry noise and reductant information [7]. Thus, the appropriate channel selection is crucial for optimizing the effectiveness of any EEG based systems [7]. Developing an excellent single classifier may be challenging due to the instability of EEG signals, and the training set's often limited size. As a result, single classifiers may perform poorly or be unreliable.
In this work, a novel channel selection algorithm and ensemble learning-based classification algorithm is proposed for an EEG-based driver fatigue detection system. Initially, we select the most significant channels using a correlation coefficients-based channel selection algorithm. This algorithm finds the ranking of the 20 most significant channels among 33 channels. Finally, utilizing the ensemble of random subspace k-NN (ERS-k-NN) classifier, the extracted features have been classified.
The major goal of the present study is to enhance the classification accuracy of driver fatigue detection systems with reduced computational complexity. To reach the goal, the contribution of the present study can be summed up as follows:
The remainder of the article is presented as follows. Section 2 describes the proposed methods under “Materials and Methods”. The findings and discussion of the study are found in Sections 3 and Section 4, respectively. The article finishes with Section 5, which serves as a summary of the article and future directions of the research.
Numerous strategies have been utilized in channel selection, including wrapper technique, filtering technique, hybrid technique, embedded technique, and human-based technique [14]. Additionally, approaches for channel selection can be grouped into filter and wrapper approaches. Usually, filter approaches are based on specific criteria, including fisher criterion or mutual information [15]. Wrapper approaches are typically used to select channels in conjunction with a particular classifier, such as a decision tree and genetic algorithm [16]. Varsehi and Firoozabadi [17] proposed a novel EEG channel selection method known as Granger causality (GC), but here, the calculations of GC are all in the time domain. Jin et al. [18] introduced EEG channel selection based on the bispectrum approach. However, the influence of the filter's different frequency ranges on the bispectrum calculation is ignored. Liu et al. [19] proposed a technique based on Fisher's criterion for automatically determining the optimal subject-dependent channel distribution. To sum up, present approaches for channel selection are either low effective or lack a neurophysiological basis.
The performance of numerous linear and nonlinear single classifiers, including DT, KNN, SVM, Neural Network, Hidden Markov Model (HMM) and Fisher discriminant analysis, have been evaluated for detecting driver fatigue using EEG signals [20]. Fu et al. [10] proposed a fatigue identification framework based on the HMM. Tuncer et al. [21] utilized k-NN to classify the extracted features from EEG fatigued and alert data. Nevertheless, developing an excellent single classifier may be challenging due to the instability of EEG signals, and the training set's often limited size. As a result, single classifiers may perform poorly or be unreliable. Although recent research has demonstrated that ensemble classifiers outperform single classifiers [22-24]; few studies have been undertaken on the use of ensemble classifiers based on EEG signals to examine driver fatigue detection. Hassan and Bhuiyan [22] suggested a method for sleep staging based on EEG data employing Complete Ensemble Empirical Mode Decomposition with Adaptive Noise and Bootstrap Aggregating (Bagging). Their outcomes demonstrated that the proposed approach was more accurate in terms of accuracy than state-of-the-art strategies. Moreover, Hassan and Subasi [23] developed an approach to perform seizure detection by employing linear programming Boosting in which the performance is superior to the existing works. Chatterjee et al. [25] developed an ensemble approach to classify MI data employing a different combination of Naive Bayes, SVM and k-NN. Additionally, they used a variety of ensemble learning architectures such as AdaBoost, loggitboost and bagging. However, ensemble learning-based classification is an almost new concept in EEG based driver fatigue detection.
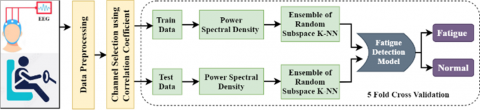
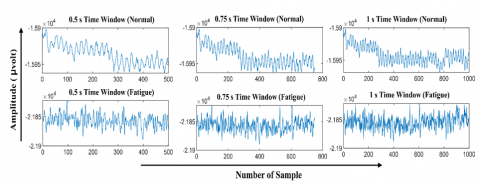
Figure 1 depicts the entire workflow for this study. This study contributes to the advancement of classification accuracy for binary-class EEG data containing fatigue and alert state. This study validated the proposed approach using a publicly available online dataset. At the outset, the time window for each trial has been specified. To minimize the computational costs, three distinct time windows has been selected. This study has utilized three different time windows, including 0.5s, 0.75s, and 1s, to identify the shortest window length shown in Figure 2. While multichannel EEG recording provides a comprehensive account of EEG activity, some channels carry noise and reductant data. Hence, a proper channel selection approach is required to minimize the computational cost. In this study, a novel channel selection technique has been applied, which is known as correlation coefficient analysis. After selecting the most significant channels, the feature from EEGF time series data should be extracted. For the present study, the feature has been extracted in terms of power spectral density. To avoid overfitting complexity, a five-fold cross-validation approach has been applied in this study. The data sets have been partitioned such that for testing, 5% of the feature vectors are applied, whereas 95% of the feature vectors are applied for training in the first iteration. Likewise, another 95% feature vectors are applied for the training set as well as the rest has been utilized for the test set in the subsequent iteration. This procedure is repeated until the test set contains all features. To classify the extracted feature, a random subspace k-NN based ensemble classifier has been utilized. The ensemble of random subspace K-NN was trained using the feature extracted from training trials. The training model has been validated through testing trials, whereas the different metrics have been utilized to evaluate the performance. Subsequently, a variety of metrics was employed to evaluate the performance of the classifier.
Figure 1. The complete architecture of the current study
Figure 2. Time-series representation of driver fatigue data
3.1 Experimental data
In this experiment, we have used a publicly available online EEG dataset for driver fatigue detection [26]. Before starting data collection, the participants were familiarized themselves with the procedures and purposes of the experiment by completing a 5-minutes driving task. Each experimental process was carried out in a controlled laboratory environment employing a static driving simulator. Each subject completed a sustained attention driving task on a static driving simulator equipped with a large screen comprised of 24-inch. The driving environment for this study was a low-traffic roadway, and the driving activity began at 9 a.m. The participants were offered 10 minutes away from the simulator after a 5-minute training run to perform an unstructured activity in the lab. Following a brief check of all instrumentation, the participants started around 1±2 hours of driving. In this instance, EEG recordings were carried out in two distinct stages. In the first round, the driving time was 20 minutes, and then for the last 5 minutes of EEG recordings, the final state was marked as normal. The continuous driving persisted for 40±100 minutes until the individual indicated that he or she was fatigued, and the last 5 minutes of EEG recordings were grouped as a fatigued state. This EEG data were collected from 32 electrodes, and the sampling rate was 1000Hz. The recorded horizontal and vertical EOG signals were used to monitor eye movements and blinks. Following the acquisition of EEG signals, the major phase of data preprocessing was performed through the Scan 4.3 software [27].
3.2 Correlation coefficient
Correlation-based approaches are advantageous for detecting task-related brain activations [28]. The purpose of this phase is to minimize the number of possible EEG channels in our dataset by eliminating the channels that are substantially uncorrelated with one another across trials. We presume that the channels associated with driver fatigue contain specific information that is consistent across all trials in which every subject undertake the same driver fatigue tasks. In comparison to fatigue-related channels, other channels may comprise less common features, which are not irrelevant to the fatigue information. We use the correlation coefficient to determine similarity based on this assumption. Therefore, we are just concerned about the similarity between any two channels, not in their directional influence. The normalization has to be accomplished at first. The amplitudes of EEG signals recorded from various human scalps vary with respect to time. A normalization is a powerful tool for reducing this variability. The Z-score normalization is employed to normalize the mean of all data to zero and the standard deviation to 1 [16]. Z-score has been calculated using Eq. (1).
${{Z}_{xy}}=\left( {{S}_{xy}}-mea{{n}_{x}} \right)/{{\sigma }_{x}}$ (1)
where, $S_{x y}$ is the $y^{\text {th }}$ sampling value of $y^{\text {th }}$ channel, mean $_{x}$ is the mean value of $y^{t h}$ channel and $\sigma_{x}$ denotes the standard deviation of $y^{\text {th }}$ channel. Secondly, the correlation coefficients are measured. Our approach makes use of Pearson's correlation analysis. Pearson's correlation coefficient is a statistic that estimates the statistical relationship between two or more random variables or their linear dependency [29]. It is defined as,
$\varphi \left( A,B \right)=\frac{1}{{{N}_{trial}}-1}\sum\limits_{i=1}^{{{N}_{trial}}}{\left( \frac{{{X}_{i}}-\overline{A}}{{{\sigma }_{A}}} \right)}\left( \frac{{{B}_{i}}-\overline{B}}{{{\sigma }_{B}}} \right)$ (2)
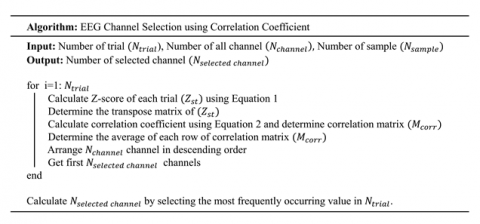
where, $\mathrm{A}$ and $\mathrm{B}$ are represented as two observable variables, $N_{\text {trial }}$ is the number of observations, $\bar{A}$ and $\overline{\mathrm{B}}$ are the means of the two variables. The standard deviations of the two variables are denoted by $\sigma_{A}$ and $\sigma_{B}$. In our circumstance, the value of $\varphi(A, B)$ varies between 0 to 1, suggesting low to high correlation. Between every pair of EEG channels, the correlation coefficient is measured. For each trial, correlation measurement forms one correlation matrix $\mathrm{R}$ of dimensions $\mathrm{N}$ $\times N$. The mean for each row can be obtained from this matrix. The row i with the highest mean correlation can be identified. This demonstrates that the channel $i$ is highly correlated with other channels, implying that the channel $i$ is quite significant. We classified $N_{\text {selected }}$ channels into a single class of highly correlated channels using this criterion. After $N_{\text {trial }}$ trials, $N_{\text {trial }} \times N_{\text {selected channel }}$ channels have been recorded. Due to the fact that the majority of channels are repeated, the $N_{\text {selected channel }}$ channels that appear most frequently are selected. As a result, the data dimensions reduced from $N_{\text {trial }} \times N_{\text {channel }} \times N_{\text {sample }}$ to $N_{\text {trial }} \times N_{\text {selected channel }} \times N_{\text {sample }}$. It will reduce the time complexity and enhance the efficiency of feature extraction. The flowchart of the proposed algorithm is expressed as follows (See Figure 3).
Figure 3. Flow-chart of the proposed channel selection algorithm
3.3 Power spectral density
PSD measures have repeatedly been reported in the literature to be reliably correlated to mental fatigue [30]. In a study [31], the authors found that overall PSD of EEG changed across the 2-h driving session. The frontal PSD for the delta EEG band showed an inverted U-shaped quadratic trend, while the power spectra of the beta band linearly increased as the driving session progressed [31]. At the same time, other studies [32, 33] have reported increased levels of all EEG-spectral power across the entire scalp due to arousal decrements. Moreover, the PSD is widely used and appeared excellent performance in a variety of studies related to EEG based emotion recognition and fatigue detection. Motivated from these, we have employed PSD based feature extraction techniques. The power spectrum of the EEG has been computed using fast Fourier transformation (FFT). The following equations represent the FFT [Eq. (3)] [34] and power spectral density [Eq. (4)].
$X(k)=\sum\limits_{k=1}^{N-1}{X\left( n \right)}W_{N}^{kn};K=0......N-1$ (3)
$PSD=|X\left( k \right){{|}^{2}}=|\sum\limits_{n=0}^{N-1}{x\left( nTs \right)}{{e}^{-j2\pi nk/N}}{{\quad|}^{2}}$ (4)
where, k = 0, 1… N-1 and one particular value of k are composed of N complex multiplications. Owing to the value of n between 0 to N-1, the multiplication of wkn and x (n) was performed for N times.
3.4 Ensemble of random subspace KNN
Nowadays, such learning models have become the most popular, as they improve the fundamental learner's performance and capabilities. These characteristics are present in ensemble-based learners. Ensemble learning is the technique of incorporating multiple classification approaches in order to create a highly effective composite model from the data. The goal of this strategy is to achieve a higher accuracy rate from multiple models than any single model. The most frequently used ensemble techniques are Random Subspace, Bagging and Adaboost. An ensemble inducer can be composed of any type of base classifier algorithm, including decision tree, k-nearest neighbour (k-NN) and other sorts of base learner algorithms. The k-NN and random subspace have been utilized as the base learner and ensemble approach, respectively, in the proposed study.
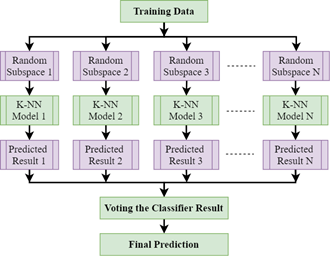
The k-NN algorithm is an essential machine learning method that divides the feature space into distinct clusters based on the features associated with the different classes. This classifier considers the k metric distances between the test sample features and those of the nearest classes while classifying a test feature vector [35]. In K-NN architecture, the number of neighbours and the sort of distance metric are significant factors. Owing to its strong generalization and simplicity of implementation, K-NN is extensively employed in pattern recognition [36]. Nevertheless, the high dimensionality of EEG typically hinders the effectiveness of K-NN. These characteristic spaces get exponentially more complex as the number of features increases [36]. In this circumstance, a strategy that takes advantage of the K-NN classifier without being significantly affected by the sparsity of high-dimensional data is highly recommended. The well-known ensemble learning approach successfully exploits the benefits of high-dimensionality [37]. The ensemble classifier develops a robust classifier by integrating the output of several weak or base classifiers in order to enhance the overall classification accuracy. While k-NN is stable in terms of adjusting training datasets, it is susceptible to feature set variation [38]. Due to the perceptive nature of the input selection of k-NN, ensemble systems based on random subspaces are capable of enhancing the efficiency of single k-NN classifiers [39]. Random subspace is a frequently utilized ensemble technique that generates individual classifiers from randomly chosen subspaces of data [40]. Additionally, the output of each independent classifier is eventually integrated using a conventional majority vote to produce the final outcome. The entire procedure is depicted in Figure 4. When a test sample is chosen as a prototype for the k-NN classifier, just the selected features are input to the distance. However, in subspace k-NN, it is the projection of all points to the specified subspace, and it uses the distances to determine the k nearest neighbours. After selecting a random subspace, a new set of k-nearest neighbours is established. By combining k adjacent neighbours in each subspace chosen, a majority vote on the test sample's class membership is obtained. In this ensemble, the same training sample reappears if it is confined to be in multiple chosen subspaces in the centre of adjacent k neighbours.
Figure 4. A random subspace-based ensemble K-NN architecture
3.5 Performance evaluation
To facilitate the evaluation of classification quality; the classification results and classifier performance are defined in terms of classification accuracy (CA), specificity, sensitivity, recall, F1 score, precision, MCC, and AUC, which are expressed as follows:
$CA=\frac{TP+TN}{TP+FN+TN+FP}\times 100%$ (5)
$Sensitivity=\frac{TP}{TP+FN}\times 100%$ (6)
$Specificity=\frac{TN}{TN+FP}\times 100%$ (7)
$\Pr ecision=\frac{TP}{TP+FP}\times 100%$ (8)
The precision intuitively indicates the classifier's ability to assess the whole sample in which the positives are classified as positives and the negatives are classified as negatives.
$\operatorname{Re}call=\frac{TP}{TP+FN}$ (9)
The recall value intuitively represents the proportion of correctly identified positive samples.
$F1=\frac{2*\Pr ecision*\operatorname{Re}call}{\Pr ecision+\operatorname{Re}call}$ (10)
The F1 score can be considered as a weighted average of precision and recall, with the optimal value at one and the worst value at 0.
$\begin{align} & MCC \\ & =\frac{TP*TN-FP*FN}{\sqrt{\left( TP+FP \right)\left( TP+FN \right)\left( TN+FP \right)\left( TN+FN \right)}} \\\end{align}$ (11)
where, TP, TN, FP and FN denote true positive, true negative, false positive and false negative, respectively.
In machine learning, the Matthews correlation coefficient (MCC) can be used to assess the quality of two-class classifications [41]. The MCC is essentially a value for the correlation coefficient between -1 and +1.
4.1 Performance in different time window
Initially, we have analyzed the classifier performance using the combination of all subject’s trials. For the time windows selection, we applied three different time windows (i.e., 0.5s, 0.75s and 1s) to assess their performance. As shown in Figure 5, the three-time windows achieved almost equal classification accuracy (e.g., 99.9%). The number of samples in 0.5s, 0.75s and 1s, are 500, 750 and 1000, respectively. To reduce the time used for a single trial, we chose 0.5s as the time window. This short time window makes the system faster by reducing the number of samples in each trial. Hence, the rest of the analysis of this study has been subjected to 0.5s of time window.
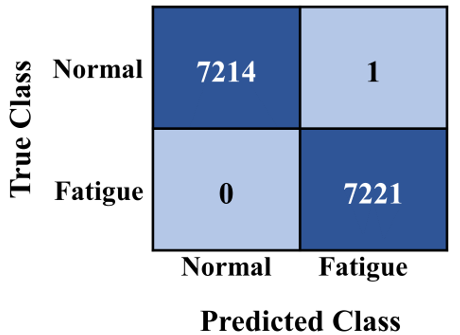
Initially, the combination of all subject’s trials was applied to analyze the classifier performance. In this study, two mental states of the driver, including fatigue state and normal state, were utilized. During labelling, normal state and fatigue state has been denoted by 1 and 2, respectively. The datasets consist of 14436 trials where class-1 and class-2 have 7215 and 7221 trials, respectively. The k-fold cross-validation technique has been applied to evaluate the performance of the classifier. In this experiment, the value of k has been set at 5 in the k-fold cross-validation approach. Figure 6 shows the confusion matrix of the ERS-KNN classifier, in which only one trial from the normal class has been misclassified. A total of 14435 trials has been accurately identified out of 14436 trials. Hence, the classification accuracy is 99.99%.
Figure 5. Classification accuracy in three different time windows
Figure 6. Confusion matrix of ERS-KNN classifier
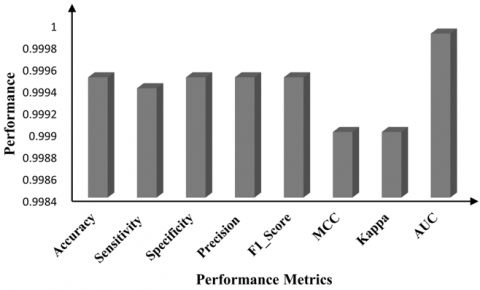
Figure 7. Performance of the ERS-KNN with different metrics
Apart from classification accuracy, we have evaluated the classifier's performance by applying a variety of performance metrics. Several performance evaluation measures, including specificity, F1-score, sensitivity, MCC, kappa, precision, and AUC, are utilized in this study. The performance of the ERS-kNN classifier is depicted in Figure 7 using several performance evaluation indicators. The value of sensitivity, specificity, precision, F1-score, MCC, kappa and AUC are 0.9994, 0.9995, 0.9995, 0.9995, 0.999, 0.999 and 0.9999 respectively.
In general, the random subspace approach produces low-correlated multiple weak learners since it randomly selects feature subsets. The prediction accuracy is typically improved when predictions are made using low-correlated several weak learners. Randomly picked features within a feature subset may also be highly correlated if the majority of the features are highly correlated [42].
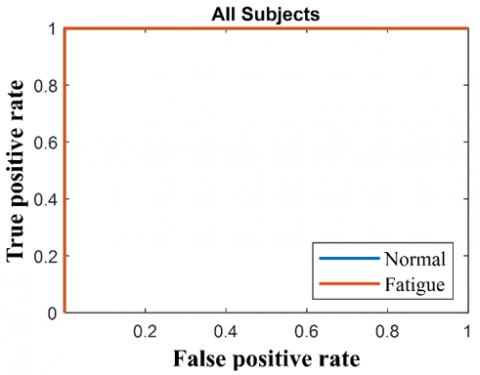
Figure 8 illustrates the receiver operating characteristic (ROC) of the ERS-KNN classifier. Figure 5 illustrates the same performance of the ERS-KNN classifier. The cause for a classifier's better accuracy can be inferred by evaluating the true positive rate vs false positive rate curve for each class on the ROC curve.
Figure 8. ROC of ERS-KNN classifier
4.2 Performance of each subject
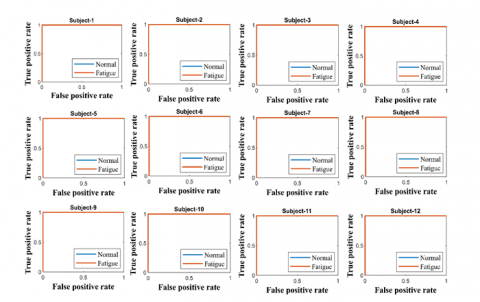
We have also assessed the performance of the classifier with the individual subject. All the subjects have performed perfectly. Table 1 shows the accuracy, sensitivity, specificity, precision, F1_Score, MCC, kappa and AUC of each subject separately. All the subjects have achieved the highest performance. We have also calculated the average and standard deviation of accuracy, sensitivity, specificity, precision, F1_Score, MCC, kappa and AUC of each subject separately. It also shows the highest performance with zero standard deviation. These performances indicate that the proposed ERS-KNN may recognize the driver’s fatigue or normal state efficiently.
Figure 9 illustrates the receiver operating characteristic (ROC) curve of the ERS-KNN classifier for all subjects separately. True positive rate (TPR) on the Y-axis and false positive rate (FPR) or 1-specificity on the X-axis is shown using different threshold ratios as sweeping variables in order to produce the ROC graph. A classifier's random performance would be represented by a straight line linking (0, 0) to (1, 1). If the classifier's ROC curve appears in the bottom right triangle, it performs poorer than random guessing; if the ROC curve appears in the upper left, the classifier is likely to perform better than random guessing [33]. For quantitative assessment of classification efficiency, the areas under the curve of ROC (AUC) were also measured (see the last column of Table 1). In contrast to accuracy measurement, AUC measures the likelihood that the classifier would score a randomly given positive example greater than a randomly selected negative example [33]. The AUC value ranges from 0 to 1, with a larger AUROC value signifying enhanced classification success. Every subject's AUC with an ERS-KNN classifier is 1.
The proposed method gets benefitted from the use of random subspaces for both classifier construction and aggregation. The small sample size problem can be solved by building classifiers in random subspaces when the number of training objects is small compared to the data dimensionality [42]. As a result, the overall size of the training population grows. Random subspaces may produce stronger classifiers than the original feature space when the data contains numerous redundant features. An ensemble of these classifiers may be better than a single classifier trained on the original training data throughout the entire feature space for making decisions.
Table 1. Performance of ERS- k-NN based classification algorithms for every subject separately
|
Subject |
Performance Metrics |
|||||||
|
Accuracy |
Sensitivity |
Specificity |
Precision |
F1_Score |
MCC |
Kappa |
AUC |
|
|
S-01 |
1 |
1 |
1 |
1 |
1 |
1 |
1 |
1 |
|
S-02 |
1 |
1 |
1 |
1 |
1 |
1 |
1 |
1 |
|
S-03 |
1 |
1 |
1 |
1 |
1 |
1 |
1 |
1 |
|
S-04 |
1 |
1 |
1 |
1 |
1 |
1 |
1 |
1 |
|
S-05 |
1 |
1 |
1 |
1 |
1 |
1 |
1 |
1 |
|
S-06 |
1 |
1 |
1 |
1 |
1 |
1 |
1 |
1 |
|
S-07 |
1 |
1 |
1 |
1 |
1 |
1 |
1 |
1 |
|
S-08 |
1 |
1 |
1 |
1 |
1 |
1 |
1 |
1 |
|
S-09 |
1 |
1 |
1 |
1 |
1 |
1 |
1 |
1 |
|
S-10 |
1 |
1 |
1 |
1 |
1 |
1 |
1 |
1 |
|
S-11 |
1 |
1 |
1 |
1 |
1 |
1 |
1 |
1 |
|
S-12 |
1 |
1 |
1 |
1 |
1 |
1 |
1 |
1 |
|
Mean±SD |
1±0 |
1±0 |
1±0 |
1±0 |
1±0 |
1±0 |
1±0 |
1±0 |
Figure 9. ROC of ERS- k-NN based classification algorithms for every subject separately
The proposed method gets benefitted from the use of random subspaces for both classifier construction and aggregation. The small sample size problem can be solved by building classifiers in random subspaces when the number of training objects is small compared to the data dimensionality [42]. As a result, the overall size of the training population grows. Random subspaces may produce stronger classifiers than the original feature space when the data contains numerous redundant features. An ensemble of these classifiers may be better than a single classifier trained on the original training data throughout the entire feature space for making decisions.
When building classifiers in random subspaces, the number of training objects is considerably increased; hence the implemented method is especially effective for weak linear classifiers obtained on small and critical sample sizes of training data [43]. As a result, linear classifiers that are vulnerable to the dimensionality curse now perform better with random subspace.
Table 2. Classification accuracy of selected electrode
|
No. of Selected Electrode |
Electrode Name |
Accuracy (%) |
|
1 |
C3 |
93.7 |
|
2 |
C3, Cz |
94.24 |
|
3 |
C3, Cz, CP4 |
99.96 |
|
4 |
C3, Cz, CP4, CP3 |
99.96 |
|
5 |
C3, Cz, CP4, CP3, P3 |
99.97 |
|
6 |
C3, Cz, CP4, CP3, P3, Fz |
99.94 |
|
7 |
C3, Cz, CP4, CP3, P3, Fz, FCz |
99.96 |
|
8 |
C3, Cz, CP4, CP3, P3, Fz, FCz, C4 |
99.94 |
|
9 |
C3, Cz, CP4, CP3, P3, Fz, FCz, C4, TP7 |
99.94 |
|
10 |
C3, Cz, CP4, CP3, P3, Fz, FCz, C4, TP7, FT7 |
99.94 |
|
11 |
C3, Cz, CP4, CP3, P3, Fz, FCz, C4, TP7, FT7, F4 |
99.95 |
|
12 |
C3, Cz, CP4, CP3, P3, Fz, FCz, C4, TP7, FT7, F4, T6 |
99.96 |
|
13 |
C3, Cz, CP4, CP3, P3, Fz, FCz, C4, TP7, FT7, F4, T6, TP8 |
99.96 |
|
14 |
C3, Cz, CP4, CP3, P3, Fz, FCz, C4, TP7, FT7, F4, T6, TP8, T5 |
99.97 |
|
15 |
C3, Cz, CP4, CP3, P3, Fz, FCz, C4, TP7, FT7, F4, T6, TP8, T5, FP1 |
99.97 |
|
16 |
C3, Cz, CP4, CP3, P3, Fz, FCz, C4, TP7, FT7, F4, T6, TP8, T5, FP1, FP2 |
99.97 |
|
17 |
C3, Cz, CP4, CP3, P3, Fz, FCz, C4, TP7, FT7, F4, T6, TP8, T5, FP1, FP2, T4 |
99.97 |
|
18 |
C3, Cz, CP4, CP3, P3, Fz, FCz, C4, TP7, FT7, F4, T6, TP8, T5, FP1, FP2, T4, F7 |
99.98 |
|
19 |
C3, Cz, CP4, CP3, P3, Fz, FCz, C4, TP7, FT7, F4, T6, TP8, T5, FP1, FP2, T4, F7, T3 |
99.97 |
|
20 |
C3, Cz, CP4, CP3, P3, Fz, FCz, C4, TP7, FT7, F4, T6, TP8, T5, FP1, FP2, T4, F7, T3, F3 |
99.98 |
4.3 Performance of channel selection algorithms
A total of 33 EEG electrodes were used in this experiment to generate the EEG datasets. Due to the fact that not all electrodes convey the desired information, electrode selection is important to reduce the computational burden. To discover the crucial electrodes, a correlation coefficient-based electrode selection approach was introduced. We have computed the best 20 electrodes, which are C3, Cz, CP4, CP3, P3, Fz, FCz, C4, TP7, FT7, F4, T6, TP8, T5, FP1, FP2, T4, F7, T3 and F3. These electrodes are arranged according to their importance. Hence, the C3 electrode contains the most significant information among others. After arranging the electrodes based on their importance, we have calculated the accuracy of ERS-KNN. Table 2 has tabulated the classification accuracy with different combinations of electrodes. The C3 electrode selected using the correlation coefficient has achieved an accuracy of 93.7%. The achieved accuracy using a single electrode is very encouraging. The accuracy of the ERS-KNN classifier using two electrodes (C3 and Cz) is 94.24%. The accuracy of the ERS-KNN classifier using three electrodes (C3, Cz and CP4) is 99.96% which is almost equal to 100%. This accuracy indicates the effectiveness of the correlation coefficient and ERS-KNN. The ability to select the optimum electrode in advance provides an opportunity to decrease computational complexity. The proposed correlation coefficient based electrode selection method has reduced the electrodes from 33 to 3, resulting in the minimize of computational complexity.
The goal of this study was to develop a framework for determining driver fatigue using EEG measurements. Although EEG signals can be effectively used to detect driver fatigue, there are certain drawbacks to this method, including higher computational cost, a large number of electrodes, overfitting problem of classifiers and so on. An optimum combination of the channel selection algorithm, the feature extraction methods, and the classifier must be employed to overcome those issues and achieve good classification accuracy. Besides, a shorter time window of each trial should be taken to make the system faster. Consequently, in this study, a novel EEG channel selection algorithm and ensemble classifier are introduced to identify driver fatigue. The proposed ERS-KNN classifier achieved a classification accuracy of 99.99% with only three selected channels at 0.5 seconds of the time window. The best significant three channels were selected using a correlation coefficient. To the authors' knowledge, this may be the first study that proposes correlation coefficient as channel selection algorithm and ERS-KNN as classification algorithm for EEG based driver fatigue detection with the highest accuracy within a concise time window. The developed system has the potential to give an innovative approach for drivers monitoring their fatigue or alert state by means of an EEG signal.
The classification ability of the proposed method is compared with the earlier fatigue detection researches. Numerous good researches have also been conducted to detect driver fatigue based on EEG data, as detailed in Table 3. It demonstrates that the classification efficiency of the developed framework is more successful than the other state-of-the-art for driver fatigue detection. Feature extraction was performed with an AR model developed by Nguyen et al. [44] and a Bayesian neural network used for classification, in which they obtained an accuracy of 88.2%. In a study done by Li et al. [45], they used 16 channels of EEG data to calculate 12 different energy features and then reached the maximum level of accuracy at 91.5% with only two electrodes (FP1 and O1). Chai et al. [33] showed that by employing AR feature extractor and sparse-deep belief networks, they were able to increase the classification performance of fatigue detection with an accuracy of 93.1%. Xiong et al. [46] used a hybrid feature consisting of AE and SE in conjunction with an SVM classifier to reach the maximum accuracy of 91.3% with the single electrode (P3). Using EEG signals from two electrodes (O1 and O2) and other physiological signals, Fu et al. [10] developed a method for fatigue identification based on the Hidden Markov Model (HMM). Min et al. [26] developed a multimodal entropy fusion strategy to identify driver weariness using electroencephalography (EEG). They utilized four different classifiers, including SVM, BP, RF and KNN and achieved an accuracy of 98.3%.
Wearable devices with very few sensors should be used in the future to deliver fatigue alerts. This will have an impact on the comfort and usability of the system. Moreover, unlike the 32-channel EEG system utilized in this study, multichannel EEG acquisition devices like this one would only be utilized in the lab environment. Therefore, it would be more practical and feasible to use an EEG device with fewer channels or perhaps a single electrode. System algorithm performance may be improved by optimizing the channel selection algorithm. As mentioned earlier, the proposed correlation coefficient based channel selection algorithm has achieved almost 100% accuracy with only three electrodes. No other study achieved similar accuracy with a such number of electrodes. Moreover, the proposed channel selection algorithm employed in only 0.5s of the time window. Fu et al. [10] achieved the highest accuracy of 92.5% using two electrodes (O1 and O2). Xiong et al. [46] obtained the maximum accuracy of 91.3% at electrode P3. Compared with these studies, the performance of the proposed correlation coefficient based channel selection algorithm is considered to be the best.
Recent research has demonstrated that ensemble classifiers outperform single classifiers [23, 24], but limited research has studied the use of ensemble classifiers based on EEG signals to detect driver weariness. Hu et al. [47] presented a gradient boosting decision tree (GBDT) method for detecting drowsiness using EEG signal and obtained up to 94.0%. Using a single electrode, Wang et al. [48] introduced an ensemble learning technique for measuring driver fatigue. Using three base classifiers, the authors applied three ensemble techniques (bagging, random forest, and boosting) and compared them. The gradient boosted DT achieved the mean accuracy is >94% on 12 subjects. Unlike bagging, the features are randomly picked for each learner in the random subspace method. When compared to more traditional machine learning approaches, our method encourages individual learners to pay less attention to attributes that seem to be very important in the training set but have little correlation with points outside of that training set. Because of this, random subspaces are an attractive option for issues where there are many more variables than training points, such as when training from EEG data. It is therefore an even better choice for online BCI operations because it requires less computing complexity.
This study's methodological strengths are as follows:
Although the proposed approach could significantly outperform other competing driver fatigue detection systems studied, the proposed approaches have many drawbacks. Unfortunately, the number of subjects and dataset size is limited, which hinders the effectiveness of the study. Additional investigations should be conducted to see if the proposed strategy works on large datasets. Furthermore, ensemble learning results in a substantial increase in computing costs. However, the problem can be resolved by using cloud-based parallel processing solutions such as Hadoop. Despite the fact that the EEG has extremely artefact-prone features, no artefact reduction algorithm was applied in this work. As a result, accuracy may be compromised in the presence of noisy EEG signals. Certain artefact-removal techniques may be employed to mitigate this issue, which needs future exploration. We will further evaluate the efficacy of the presented method by taking into account several frequency bands and automatic time window selections, both of which have the potential to lower the computing complexity of the proposed method even more. This multi-parameter optimization challenge will be addressed in greater depth in our subsequent research.
Table 3. Performance comparison of related driver fatigue detection studies
|
Reference |
Channel Selection Algorithm |
Feature Extraction |
Number of Selected Channel |
Classification Algorithm |
Performance |
|
[33] |
- |
AR model |
32 electrodes |
sparse-DBN |
93.1 |
|
[46] |
- |
AE and SE |
P3 |
SVM |
91.28 |
|
[49] |
- |
Adaptive multi-scale fuzzy entropy |
Fp1, Fp2 |
- |
95.37 |
|
[50] |
- |
Time Analysis, Spectral analysis, Wavelet decomposition |
C3, O1, C4, A1, O2, A1 |
NN |
83.6 |
|
[51] |
- |
FFT |
Single channel |
Linear regression |
90 |
|
[44] |
- |
Statistical tests |
64 |
FLDA |
88.6 |
|
[52] |
- |
wavelet entropy |
8 electrodes |
SVM |
90.7% |
|
[11] |
|
Multiple Entropy Fusion |
32 electrodes |
SVM |
98.3 |
|
[21] |
RFNCAPCA |
DCBP and MTTP |
32 electrodes |
KNN |
97.29% |
|
Proposed Method |
Correlation coefficient |
PSD |
3 |
ERS-KNN |
99.96 |
One of the biggest traffic safety issues is driver sleepiness, which contributes to hundreds of accidents and fatalities every year. Among numerous subjective and objective detection methods, driver physiological parameters especially, EEG has emerged as the most trustworthy contemporary technique to assess the driver's alert or fatigue states. The findings in this study show that by analyzing EEG waves during a simulated driving job, it is possible to distinguish between being fatigued or alert. A novel channel selection algorithm known as correlation coefficient has been proposed to select the most significant EEG electrodes. To reduce the computational cost, three different time windows (i.e. 0.5s, 0.75s and 1s) have been utilized during a trial separation. The PSD was used for the feature extractor, and then an ensemble classifier known as ERS-KNN was used as a classifier. The proposed method provides superior classification accuracy (i.e. 99.99%) with only three electrodes at 0.5s of time windows. The results of the experiments indicate that the combination of correlation coefficient, PSD and ERS-KNN algorithm has the potential to greatly improve the accuracy of EEG-based driver fatigue detection systems.
The authors would like to thank the Ministry of Higher Education for providing financial support under Fundamental Research Grant Scheme (FRGS) No. FRGS/1/2019/TK04/UMP/02/7 (University reference RDU1901167) and UMP financial support under PGRS grant PGRS210332. The authors also would like to thank Universiti Malaysia Pahang for its laboratory facilities.
[1] WHO. (2019). Global Status Report on Road Safety : Time for Action. WHO Press.
[2] Chen, L., Zhi, X., Wang, H., Wang, G., Zhou, Z., Yazdzni, A., Zheng, X. (2020). Driver fatigue detection via differential evolution extreme learning machine technique. Electronics, 9(11): 1850. https://doi.org/10.3390/ELECTRONICS9111850
[3] Wang, H., Dragomir, A., Abbasi, N.I., Li, J., Thakor, N.V., Bezerianos, A. (2018). A novel real-time driving fatigue detection system based on wireless dry EEG. Cognitive Neurodynamics, 12(4): 365-376. https://doi.org/10.1007/S11571-018-9481-5
[4] Sikander, G., Anwar, S. (2019). Driver fatigue detection systems: A review. IEEE Transaction on Intelligent Transportation Systems, 20(6): 2339-2352. https://doi.org/10.1109/TITS.2018.2868499
[5] Balandong, R.P., Ahmad, R.F., Mohamad Saad, M.N., Malik, A.S. (2018). A review on EEG-based automatic sleepiness detection systems for driver. IEEE Access, 6: 22908-22919. https://doi.org/10.1109/ACCESS.2018.2811723
[6] Jimenez-Pinto, J., Torres-Torriti, M. (2012). Face salient points and eyes tracking for robust drowsiness detection. Robotica, 30(5): 731-741. https://doi.org/10.1017/S0263574711000749
[7] Picot, A., Charbonnier, S., Caplier, A. (2011). EOG-based drowsiness detection: Comparison between a fuzzy system and two supervised learning classifiers. IFAC Proceedings Volumes, 44(1): 14283-14288. https://doi.org/10.3182/20110828-6-IT-1002.00706
[8] Min, J., Wang, P., Hu, J. (2017). Driver fatigue detection through multiple entropy fusion analysis in an EEG-based system. PLoS One, 12(12): e0188756. https://doi.org/10.1371/journal.pone.0188756
[9] Jung, S.J., Shin, H.S., Chung, W.Y. (2014). Driver fatigue and drowsiness monitoring system with embedded electrocardiogram sensor on steering wheel. IET Intelligent Transport Systems, 8(1): 43-50. https://doi.org/10.1049/IET-ITS.2012.0032
[10] Fu, R., Wang, H., Zhao, W. (2016). Dynamic driver fatigue detection using hidden Markov model in real driving condition. Expert Systems with Applications, 63: 397-411. https://doi.org/10.1016/J.ESWA.2016.06.042
[11] Ren, Z., Li, R., Chen, B., Zhang, H., Ma, Y., Wang, C., Lin, Y., Zang, Y. (2021). EEG-based driving fatigue detection using a two-level learning hierarchy radial basis function. Frontiers in Neurorobotics, 15: 618408. https://doi.org/10.3389/FNBOT.2021.618408
[12] Sun, H., Jin, J., Kong, W., Zuo, C., Li, S., Wang, X. (2020). Novel channel selection method based on position priori weighted permutation entropy and binary gravity search algorithm. Cognitive Neurodynamics, 15(1): 141-156. https://doi.org/10.1007/S11571-020-09608-3
[13] Rafik, D., Larbi, B., (2019) Autoregressive modeling based empirical mode decomposition (EMD) for epileptic seizures detection using EEG signals. Traitement du Signal, 36(3): 273-279. https://doi.org/10.18280/ts.360311
[14] Alotaiby, T., El-Samie, F.E.A., Alshebeili, S.A., Ahmad, I. (2015). A review of channel selection algorithms for EEG signal processing. EURASIP Journal on Advances in Signal Processing, 2015(1): 1-21. https://doi.org/10.1186/S13634-015-0251-9
[15] Yang, Y., Kyrgyzov, O., Wiart, J., Bloch, I. (2013). Subject-specific channel selection for classification of motor imagery electroencephalographic data. 2013 IEEE International Conference on Acoustics, Speech and Signal Processing, pp. 1277-1280. https://doi.org/10.1109/ICASSP.2013.6637856
[16] Jin, J., Miao, Y., Daly, I., Zuo, C., Hu, D., Cichocki, A. (2019). Correlation-based channel selection and regularized feature optimization for MI-based BCI. Neural Networks, 118: 262-270. https://doi.org/10.1016/j.neunet.2019.07.008
[17] Varsehi, H., Firoozabadi, S.M.P. (2021). An EEG channel selection method for motor imagery based brain–computer interface and neurofeedback using Granger causality. Neural Networks, 133: 193-206. https://doi.org/10.1016/j.neunet.2020.11.002
[18] Jin, J., Liu, C., Daly, I., Miao, Y., Li, S., Wang, X., Cichocki, A. (2020). Bispectrum-based channel selection for motor imagery based brain-computer interfacing. IEEE Transactions on Neural Systems and Rehabilitation Engineering, 28(10): 2153-2163. https://doi.org/10.1109/TNSRE.2020.3020975
[19] Liu, Y.H., Huang, S., Huang, Y.D. (2017). Motor imagery EEG classification for patients witamyotrophic lateral sclerosis using fractal dimension and Fisher’s criterion-based channel selection. Sensors (Switzerland), 17(7): 1557. https://doi.org/10.3390/s17071557
[20] Hu, J., Wang, P. (2017). Noise robustness analysis of performance for EEG-based driver fatigue detection using different entropy feature sets. Entropy, 19(8): 385. https://doi.org/10.3390/e19080385
[21] Tuncer, T., Dogan, S., Ertam, F., Subasi, A. (2021). A dynamic center and multi threshold point based stable feature extraction network for driver fatigue detection utilizing EEG signals. Cognitive Neurodynamics, 15(2): 223-237. https://doi.org/10.1007/s11571-020-09601-w
[22] Hassan, A.R., Bhuiyan, M.I.H. (2016). Computer-aided sleep staging using Complete Ensemble Empirical Mode Decomposition with Adaptive Noise and bootstrap aggregating. Biomedical Signal Processing and Control, 24: 1-10. https://doi.org/10.1016/J.BSPC.2015.09.002
[23] Hassan, A.R., Subasi, A. (2016). Automatic identification of epileptic seizures from EEG signals using linear programming boosting. Computer Methods and Programs in Biomedicine, 136: 65-77. https://doi.org/10.1016/J.CMPB.2016.08.013
[24] Yang, T., Chen, W., Cao, G. (2016). Automated classification of neonatal amplitude-integrated EEG based on gradient boosting method. Biomedical Signal Processing and Control, 28: 50-57. https://doi.org/10.1016/J.BSPC.2016.04.004
[25] Chatterjee, R., Datta, A., Sanyal, D.K. (2019). Ensemble learning approach to motor imagery EEG signal classification. Machine Learning in Bio-Signal Analysis and Diagnostic Imaging, 183-208. https://doi.org/10.1016/B978-0-12-816086-2.00008-4
[26] Min, J., Wang, P., Hu, J. (2017). The original EEG data for driver fatigue detection. Figshare, Dataset. https://doi.org/10.6084/m9.figshare.5202739.v1
[27] Horovitz, S.G., Fukunaga, M., de Zwart, J.A., van Gelderen, P., Fulton, S.C., Balkin, T.J., Duyn, J.H. (2008). Low frequency BOLD fluctuations during resting wakefulness and light sleep: A simultaneous EEG-fMRI study. Human Brain Mapping, 29(6): 671-682. https://doi.org/10.1002/HBM.20428
[28] Lu, H., Eng, H.L., Guan, C., Plataniotis, K.N., Venetsanopoulos, A.N. (2010). Regularized common spatial pattern with aggregation for EEG Classification in small-sample setting. IEEE Transaction on Biomedical Engineering, 57(12): 2936-2946. https://doi.org/10.1109/TBME.2010.2082540
[29] Thibeault, C.M., Srinivasa, N. (2013). Using a hybrid neuron in physiologically inspired models of the basal ganglia. Front. Comput. Neurosci., 7: 88. https://doi.org/10.3389/FNCOM.2013.00088
[30] Wascher, E., Rasch, B., Sänger, J., Hoffmann, S., Schneider, D., Rinkenauer, G., Heuer, H., Gutberlet, I. (2014). Frontal theta activity reflects distinct aspects of mental fatigue. Biological Psychology, 96: 57-65. https://doi.org/10.1016/J.BIOPSYCHO.2013.11.010
[31] Morales, J.M., Díaz-Piedra, C., Rieiro, H., Roca-González, J., Romero, S., Catena, A., Fuentes, L.J., Di Stasi, L.L. (2017). Monitoring driver fatigue using a single-channel electroencephalographic device: A validation study by gaze-based, driving performance, and subjective data. Accident Analysis & Prevention, 109: 62-69. https://doi.org/10.1016/j.aap.2017.09.025
[32] Craig, A., Tran, Y., Wijesuriya, N., Nguyen, H. (2012). Regional brain wave activity changes associated with fatigue. Psychophysiology, 49(4): 574-582. https://doi.org/10.1111/J.1469-8986.2011.01329.X
[33] Chai, R., Ling, S.H., San, P.P., Naik, G.R., Nguyen, T.N., Tran, Y., Craig, A., Nguyen, H.T. (2017). Improving EEG-based driver fatigue classification using sparse-deep belief networks. Front. Neurosci., 11: 103. https://doi.org/10.3389/fnins.2017.00103
[34] Otsuka, T., Watanabe, K., Hirano, Y., Kubo, K., Miyake, S., Sato, S., Sasaguri, K. (2009). Effects of mandibular deviation on brain activation during clenching: An fMRI preliminary study. Cranio – The Journal of Craniomandibular & Sleep Practice, 27(2): 88-93. https://doi.org/10.1179/crn.2009.014
[35] Islam, M.N., Sulaiman, N., Rashid, M., Bari, B.S., Mustafa, M. (2020). Hearing disorder detection using Auditory Evoked Potential (AEP) signals. 2020 Emerging Technology in Computing, Communication and Electronics (ETCCE), pp. 1-6. https://doi.org/10.1109/ETCCE51779.2020.9350918
[36] Sharon, H., Elamvazuthi, I., Lu, C., Parasuraman, S. (2019). Development of rheumatoid arthritis classification from electronic image sensor using ensemble method. Sensors, 20(1): 167. https://doi.org/10.3390/s20010167
[37] Ho, T.K. (1998). Nearest neighbors in random subspaces. In: Amin A., Dori D., Pudil P., Freeman H. (eds) Advances in Pattern Recognition. SSPR /SPR 1998. Lecture Notes in Computer Science, vol 1451. Springer, Berlin, Heidelberg. https://doi.org/10.1007/BFb0033288
[38] Chaudhary, S., Taran, S., Bajaj, V., Siuly, S. (2020). A flexible analytic wavelet transform based approach for motor-imagery tasks classification in BCI applications. Computer Methods and Programs in Biomedicine, 187: 105325. https://doi.org/10.1016/j.cmpb.2020.105325
[39] Ho, T.K. (1998). The random subspace method for constructing decision forests. IEEE Transaction on Pattern Analysis and Machine Intelligence, 20(8): 832-844. https://doi.org/10.1109/34.709601
[40] Rashid, M.., Bari, B.S., Hasan, M.J., Razman, M.A.M., Musa, R.M., Nasir, A.F.A., Majeed, A.P.P.A. (2021). The classification of motor imagery response: An accuracy enhancement through the ensemble of random subspace k-NN. PeerJ Computer Science, 7: e374. https://doi.org/10.7717/PEERJ-CS.374
[41] Hu, J. (2017). Automated detection of driver fatigue based on AdaBoost classifier with EEG signals. Front. Comput. Neurosci., 11: 1-10. https://doi.org/10.3389/fncom.2017.00072
[42] Shin, J. (2020). Random subspace ensemble learning for functional near-infrared spectroscopy brain-computer interfaces. Front. Hum. Neurosci., 14: 236. https://doi.org/10.3389/FNHUM.2020.00236
[43] Skurichina, M., Duin, R.P.W. (2002). Bagging, boosting and the random subspace method for linear classifiers. Pattern Analysis & Applications, 5(2): 121-135. https://doi.org/10.1007/S100440200011
[44] Nguyen, T., Ahn, S., Jang, H., Jun, S.C., Kim, J.G. (2017). Utilization of a combined EEG/NIRS system to predict driver drowsiness. Scientific Reports, 7(1): 1-10. https://doi.org/10.1038/srep43933
[45] Li, W., He, Q.C., Fan, X.M., Fei, Z.M. (2012). Evaluation of driver fatigue on two channels of EEG data. Neuroscience Letters, 506(2): 235-239. https://doi.org/10.1016/j.neulet.2011.11.014
[46] Xiong, Y., Gao, J., Yang, Y., Yu, X., Huang, W. (2016). Classifying driving fatigue based on combined entropy measure using EEG signals. International Journal of Control and Automation, 9(3): 329-338. https://doi.org/10.14257/ijca.2016.9.3.30
[47] Hu, J., Min, J. (2018). Automated detection of driver fatigue based on EEG signals using gradient boosting decision tree model. Cognitive Neurodynamics, 12(4): 431-440. https://doi.org/10.1007/s11571-018-9485-1
[48] Wang, P., Min, J., Hu, J. (2018). Ensemble classifier for driver’s fatigue detection based on a single EEG channel. IET Intelligent Transport Systems, 12(10): 1322-1328. https://doi.org/10.1049/IET-ITS.2018.5290
[49] Luo, H., Qiu, T., Liu, C., Huang, P. (2019). Research on fatigue driving detection using forehead EEG based on adaptive multi-scale entropy. Biomedical Signal Processing and Control, 51: 50-58. https://doi.org/10.1016/j.bspc.2019.02.005
[50] Garcés Correa, A., Orosco, L., Laciar, E. (2014). Automatic detection of drowsiness in EEG records based on multimodal analysis. Medical Enginerring & Physics, 36(2): 244-249. https://doi.org/10.1016/j.medengphy.2013.07.011
[51] Ko, L.W., Lai, W.K., Chuang, C.H., Lu, S.W., Lu, Y.C., Hsiung, T.Y., Wu, H.H., Lin, C.T. (2015). Single channel wireless EEG device for real-time fatigue level detection. 2015 International Joint Conference on Neural Networks (IJCNN), pp. 1-5. https://doi.org/10.1109/IJCNN.2015.7280817
[52] Wang, Q., Li, Y., Liu, X. (2018). Analysis of feature fatigue EEG signals based on wavelet entropy. International Journal of Pattern Recognition and Artificial Intelligence, 32(8): 1854023. https://doi.org/10.1142/S021800141854023X