Jiaying Yu | Xiaojing Bai*
© 2021 IIETA. This article is published by IIETA and is licensed under the CC BY 4.0 license (http://creativecommons.org/licenses/by/4.0/).
OPEN ACCESS
The quick and accurate identification of classroom emotions helps teachers perceive the learning state of their students. This paper designs a bimodal identification system for classroom emotions based on electroencephalogram (EEG) signals and countenances. The system relies on the Internet of things (IoT) technology to collect EEG signals, and extracts the signal features with fractal dimension and multiscale entropy algorithm. After that, the support vector machine (SVM) was adopted to classify the classroom emotions. Then, the features of countenances were extracted by local binary pattern (LBP). Experimental results show that our system accurately identified 85.7% of classroom emotions. Compared with the traditional countenance-based emotion identification method, the bimodal approach could extract rich information on classroom emotions, and achieve a good effect on emotion identification.
bimodal emotion identification, Internet of things (IoT), countenances, electroencephalogram (EEG)
In daily life, humans are inevitably affected by each other’s emotions. During interpersonal communication, both sides can make different responses by observing the emotional changes of the other side. The same is true in classroom teaching. Teachers can evaluate the students’ knowledge acquisition based on their classroom emotions.
Plutchik [1] defined the most basic countenances of humans: happiness, anger, fear, despair, sadness, and disgust. Tomarken et al. [2] divided emotions to two basic dimensions: valence (V) and arousal (A). The former represents the transition from unpleasantness to happiness, and the latter represents the transition from depression to excitement. The Database for Emotion Analysis (DEAP) [3] splits emotions into four states, namely, low A high V (LALV), high A high V (HAHV), low A high V (LAHV), and high A low V (HALV). Based on HV and LV, this paper decomposes emotions into happiness and sadness.
It is a complex issue to identify human emotions. The single-modal identification of emotions has many drawbacks. From the perspective of multimodality, the emotions can be identified more accurately by extracting the effective information of different modals. Currently, human emotions are mainly identified based on countenances or electroencephalogram (EEG) signals. The countenance-based strategy boasts two advantages: the abundance of emotion information in each image, and the ease of image collection. However, countenance is easy to be covered up, and the relevant algorithm is too complex to process. The EEG-based strategy is superior in that the EEG signals contain real and explicit emotion information, and offer high and easy-to-process time resolution. The defect of this strategy rests with the inaccurate classification of emotions, and the inconvenience of the large acquisition instruments.
Considering realizability and classification accuracy, this paper proposes an emotion identification system that combines EEG with countenance, and applies the system to classroom teaching. The designed system can evaluate student emotions from their EEGs and countenances in class, such that the teachers can learn the state of their students in class, and make timely adjustment to the teaching plan.
The EEG-based emotion identification can be realized by using Internet of things (IoT). So far, EEG signals have been studied in time and frequency domains [4, 5]. In time domain, Nawaz et al. [6] extracted fractal dimension features of EEG signals for emotion recognition. The physical significance of the fractal dimension is the irregularity of time series. Uchino and Nakagawa [7] found that the left hemisphere of the human brain is more active in positive emotions, while the right hemisphere is more active in negative emotions. To distinguish happiness and sadness, Gao et al. [8] calculated the fractal dimensions of the AF3 channel in the left brain and the F4 channel in the right brain, compared the stability and accuracy of fractal dimension and other EEG features, and concluded that fractal dimension can stably and accurately identify emotions.
In frequency domain, EEG signals can be divided into five frequency bands. Chen et al. [9] held that EEG signals of high frequency bands (e.g., $\beta$ and $\gamma$) are more suitable for emotion research. Chao et al. [10] extracted the differential entropies of EEG signals, trained deep belief network (DBN) and DBN-hidden Markov model (HMM), and achieved high classification accuracy of two types of emotions. Aditya and Tibarewala [11] preprocessed the EEG signals from ten channels through discrete wavelet transform (DWT), extracted energy entropy as features, and classified them with support vector machine (SVM) and k-nearest neighbors (KNN) algorithm; experimental results show that $\gamma$ band was classified more accurately than the other low-frequency channels [12-16].
Some scholars also combined time and frequency domains in EEG research. For example, You et al. [17] normalized EEG signals with empirical mode decomposition (EMD) and extended multivariate EMD (MEMD), extracted power spectral density (PSD), entropy, and eight other features; After independent component analysis (ICA), KNN and artificial neural network (ANN) were adopted to classify the EEG signals; The recognition rates of A and V were 73% and 75%, respectively. Combing time and frequency domains, Tafreshi et al. [18] extracted the fractal dimension and PSD from brain electrical signals in DEAP database, and compared the performance of SVM, multi-layer perceptron (MLP), decision tree (DT), and other classifiers; In the case of PSD extraction, SVM was found to be the most accurate classifier for positive and negative emotions.
Countenance feature extraction targets static or dynamic images. In static images, the countenance features can be extracted by Gabor filter, local binary pattern (LBP), scale-invariant feature transform (SIFT), and principal component analysis (PCA) [19-21]. In dynamic images, these features can be extracted by model approach, geometric approach, and optical flow approach [22-24]. With histogram of oriented gradients (HOG), Wang et al. [25] described the local contour of human faces, and constructed a bottom-up hierarchical DT, which can correctly classify the emotions of any image not included in the training set. Jeong et al. [26] improved the LBP to classify seven kinds of emotions in Japanese Female Facial Expression (JAFFE) Database, and confirmed through experiments that the improved LBP makes emotion identification more accurate. Mayya et al. [27] constructed a facial emotion identification model based on deep learning (DL), which surpasses the traditional convolutional neural network (CNN) by 4% in classification accuracy.
When it comes to multimodal feature extraction, the initial approach is to fuse the countenance data with audio signals, trying to improve the reliability and effectiveness of emotion computing. Su et al. [28] synthetized the EEG information with eye movement signals, and classified emotions with a multi-modal DL deep neural network (DNN). Kessous et al. [29] fused the extracted speech and countenance features, and classified emotions using an SVM. Through DL, Spapé et al. [30] combined EEG signals and electromyography (EMG) signals, proposed an innovative DL model for countenance identification by the two modals; the proposed model increases the accuracy of emotion classification.
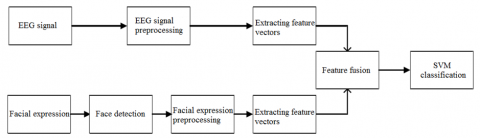
This section explains the design of our bimodal emotion identification system based on both countenance and EEG signals. The system preprocesses the relevant information, extracts the features from countenance and EEG signals, and fuses the extracted two types of features. Figure 1 illustrates the flow of our system.
Our system firstly collects information from EEG signals and countenances. After preprocessing, fractal dimension, multiscale entropy, and uniform pattern LBP were extracted, respectively. In the feature layer, the features of the two modals were merged into bimodal emotion features. Finally, the SVM was called to classify happy and sad emotions.
Figure 1. Flow chart of bimodal emotion identification system
3.1 IoT-based design of EEG modal system
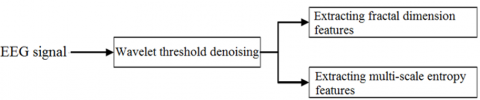
Prefrontal lobe is an important part of the human brain for emotion identification. Since FP1 channel contains lots of emotional information, the authors decided to collect EEG signals from this channel, remove the noises through wavelet thresholding, and calculate the features like fractal dimension and multiscale entropy of EEG signals. Figure 2 explains the flow of EEG modal system.
During system operation, the EEG signals were collected by the IoT. Every subject was asked to wear an electrode cap applied with conductive paste. The electrode distribution meets the international 10–20 system for electrode placement of EEG measurement. The EEG data were collected for 65 s. The data in the first 5s were taken as the reference, and those in the last 60 s were preprocessed. The sampling rate was set to 128 Hz.
The EEG signals are very weak in microvolt level, and easily affected by 50 Hz power frequency alternative current (AC), electrocardiogram (ECG), eye electricity, EMG and other interference sources. Therefore, this paper chooses to remove the residual noises in the EEG signals through wavelet thresholding.
Figure 2. Flow chart of EEG modal system
Fractal dimension and multiscale entropy were extracted from the EEG signals. The higher the fractal dimension, the more active the brain. Here, Higuchi algorithm [31] is employed to calculate the fractal dimension in the following procedure:
(1) Define the length of EEG signal as L, and describe the EEG signals as $\mathrm{X}(1), \mathrm{X}(2), \ldots, \mathrm{X}(\mathrm{L})$.
(2) Set up a new series:
$X_{k}^{m}: X(m), X(m+k), \ldots, X\left(m+\left[\frac{L-m}{k}\right] k\right)$
where, $k$ is the interval between two adjacent numbers in the new series, $k=1,2, \ldots, k_{\max } ; m$ is the initial signal value, $m=1,2, \ldots, k$.
(3) Compute the length of each new series.
(4) For each $k$ value, calculate the mean length $A_{L}(k)$ of the series:
$A_{L}(k)=\left\{\left(\sum_{i=1}^{\left[\frac{L-m}{k}\right]}|X(m+i k)-X(m+(i-1) k)|\right) \times(L-1) /(L-m)\right\} / k$
(5) Obtain $\ln (k)$ and $\mathrm{B}$ under all $\ln \left(A_{L}(k)\right)$ values, fit the slope by least squares (LS) method, and take the opposite number of the slope as fractal dimension.
After wavelet thresholding, the EEG signals were split into 30 segments by a window containing 256 points. The fractal dimension was extracted from each segment, producing a 30-dimensional eigenvector (Figure 3).
Figure 3. Extraction of fractal dimension
Multiscale entropy reflects the complexity of time series on different time scales. The original signals must be coarse-grained to derive the sample entropy on different time scales. Coarse-graining means to segment the original signals using a window with a non-overlapping length $\tau$. The coarse-grained new signals can be defined as:
$y_{j}^{t}=\frac{1}{\tau} \sum_{i=(j-1) \tau+1}^{j \tau} x_{i}$
where, $\tau$ is the current time scale.
The entropy and dimension of multiscale entropy of a sample both depend on the time scale. To adapt the dimension of multiscale entropy to emotion classification, our system extracts the EEG signals of FP1 channel from 10 subjects in DEAP database, and judges the samples with V>6 as happy emotions and those with V<4 as sad emotions. Experimental results show that the mean sample entropy difference between happy and sad emotions was large, at the initial scale of 1. With the growing scale of multiscale entropy, the mean sample entropies of happy and sad emotions gradually converged. After the scale reached 15, the multiscale entropy no longer had an obvious classification effect. Therefore, the multiscale entropy of the first 15 scales was selected as the eigenvector of EEG signals.
3.2 SVM-based design of countenance modal system
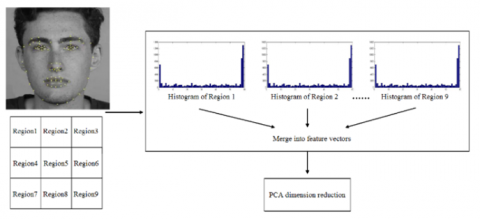
Figure 4. Extraction of uniform pattern LBP
Figure 5. Feature classification by SVM
The countenance modal system supports face detection, preprocessing, and feature extraction. During face detection, the OpenCV face detector was loaded to detect the face region, which was then extracted. In real life, image acquisition is inevitably affected by illumination, head swing, and noise pollution, making it necessary to preprocessing the original images. Histogram equalization is a common method to increase the contrast and clarity of the images. Considering the complexity of countenance identification, this paper adopts the uniform pattern LBP [32] to extract countenance features in the following procedure:
(1) Construct a 3×3 texture region with the center pixel value as the threshold. Compare the value of each of the surrounding eight pixels with the threshold, and set the neighborhood value to 1 if the threshold is smaller, and 0 if the threshold is greater.
(2) In the 3×3 texture region, record the neighborhood values calculated by the surrounding eight pixels as an 8-bit binary number in the clockwise direction. Then, count the number of 0 to 1 or 1 to 0 transitions in the binary number. If the number is smaller than two, take the decimal number corresponding to the binary number as the LBP value of the center pixel; if the number if greater than two, set P to 8, and the LBP value of the center pixel to P+1=9.
(3) Traverse all the pixels to obtain the LBP values of the entire image, and connect the LBP values into an eigenvector in sequence, producing the uniform pattern LBP feature of the whole image.
Figure 4 shows how to extract the uniform pattern LBP.
After dimension reduction, the extracted countenance features were classified by the SVM (Figure 5).
After being computed, the eigenvectors of the subjects should be normalized. Compared with the original data, the normalized data can shorten the training time and improve the test accuracy of SVM classifier. This is because the normalization makes the data more compact, which optimizes the classification hyperplane.
Furthermore, radial basis function (RBF) was chosen as the kernel function of the SVM classifier. As a special tool of nonlinear mapping, the RBF works well on nonlinear separable problems with multidimensional vectors.
3.3 Multimodal feature fusion
Multimodal feature fusion intermingles various information captured by different sensors, such as text, audio, and video. The multimodal feature fusion network consists of a classification layer (decision layer), a feature layer, and a data layer. From the first to the last layer, the dimension and volume of data being processed increase in turn.
Data layer fusion is to directly fuse the original data of different modals, before extracting and classifying the features. The fusion between EEG signals and countenances is a typical case of data layer feature.
Feature layer fusion usually connects the features of different modals in series or in parallel. However, the high-dimensional eigenvectors must go through dimensionality reduction to prevent the curse of dimensionality. For dimensionality reduction, the redundant features are often eliminated by PCA and linear discriminant analysis (LDA).
Decision layer fusion classifies different types of features, and makes a joint decision under certain rules. The input is the results of different sensors or modals, and the output is the interpretation of several classification results simultaneously.
Our system adopts bimodal feature fusion. The system collects two kinds of signals at the same time, processes each type of signals, extracts the corresponding features, and then fuses the two features in series. According to our feature extraction method, 30 fractal dimensions could be obtained from the segments of the preprocessed EEG signals, creating a 30-dimensional fractal dimension. Meanwhile, a 15-dimensional multiscale entropy could be acquired under 15 different time scales. In this way, the EEG features acquired by our approach have 45 dimensions. After the face region was extracted, the countenance image was decomposed through histogram equalization into 3×3 regions, and the uniform pattern LBP was extracted from each region.
After dimensionality reduction, our system obtains 45-dimensional EEG features of EEG modal and LBP features of countenance. The two kinds of features were combined in series. After that, the emotions were classified by the SVM classifier. Figure 6 explains the process of multimodal feature fusion.
Figure 6. Fusion of multimodal features
During feature layer fusion, an $\mathrm{m}$ -dimensional EEG eigenvector $v=\left[v_{1}, v_{2}, \ldots, v_{m}\right]$ is connected in serious with an n-dimensional countenance eigenvector $u=\left[u_{1}, u_{2}, \ldots, u_{n}\right]$ into an $\mathrm{m}+\mathrm{n}$ -dimensional eigenvector $\rho$ :
$\rho=u+v=\left[v_{1}, v_{2}, \ldots, v_{m}, u_{1}, u_{2}, \ldots, u_{n}\right]$
4.1 Model validation and analysis
The theoretical analysis above determines the feature extraction method for emotion identification for our system, and chooses the SVM to classify happy and sad emotions. Here, the FP1 channel of 32 channels in DEAP database is selected to study how this channel affects emotion classification. For label processing, the value range of V was set to 1-9. The samples with V<4 were labeled as sad, and those with V>6 as happy. All the samples of happy and sad emotions were selected, and divided into a training set and a test set by the ratio of 4:1.
During the experiment, the classification accuracies of happy and sad emotions were counted separately. To facilitate the analysis, a number of parameters were defined: HS, the number of all the samples with happy emotions; HT, the number of correctly classified samples with happy emotions; SS the number of all the samples with sad emotions; ST, the number of correctly classified samples with sad emotions. Then, the identification accuracies of happy and sad emotions can be respectively calculated by HT/HS and ST/SS. The identification accuracy of both emotions can be calculated by (HT+ST)/(HS+SS). Figure 7 shows the classification accuracies observed in the experiment.
Figure 7. Experimental classification accuracies
As shown in Figure 7, 74.5% of happy emotions, 77.1% of sad emotions, and 75.2% of both emotions were correctly classified in the experiment. The classification effect is close to the accuracy of traditional multi-channel classification. This confirms the reasonability of the method of EEG modal preprocessing and feature extraction.
Then, SVM was used to classify the emotions of happiness and sadness in countenances. A total of 61 images were selected from the JAFFE database, including 31 happy countenances and 30 sad countenances. Face detection and histogram equalization were performed on the selected images. Then, LBP features were extracted from uniform pattern, and SVM was used to classify the selected images.
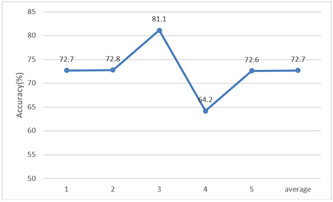
In our experiment, the mean precision of SVM classification was calculated by five-fold cross validation. Twelve samples are selected as the test set and other samples as the training set. The classification accuracy of SVM is recorded in Figure 8.
Figure 8. Classification accuracy of SVM
The classification accuracy of SVM averaged at 72.7%, mainly because the dimension of eigenvector is still too small.
4.2 Classroom emotion identification experiment
To verify its accuracy and feasibility, our system was applied for classroom emotion identification. The videos and images of students in an actual classroom were collected via Bluetooth transmission. Since the camera is far from the students, the images captured are the upper bodies, which contains many parts other than faces. Therefore, the OpenCV face detector was called to extract the facial regions in each image, facilitating the subsequent processing of facial regions.
Twenty students received two rounds of 16 experiments, with 8 experiments in each round. The first round generated 160 samples, which were taken as the training set for the SVM classifier. The second round generated another 160 samples, which were treated as the test set for classification. At the end of the experiments, every student was asked to evaluate his/her emotions against a self-evaluation scale. Table 1 shows the classification accuracy of happy and sad emotions of the 20 students.
As shown in Table 1, the mean classification accuracy of the 20 students was 77.5%. The accuracy was low only on student 17, probably due to his/her emotional motivation.
The control variate method was adopted to compare the classification accuracies of our bimodal approach with EEG modal and countenance modal. The data were collected from the same students as above. Table 2 compares the accuracies of the three methods.
Table 1. Classification accuracy of happy and sad emotions of the 20 students
|
Student number |
Classification accuracy |
Student number |
Classification accuracy |
|
1 |
89.5% |
11 |
80% |
|
2 |
75% |
12 |
82.5% |
|
3 |
62.5% |
13 |
92.5% |
|
4 |
92.5% |
14 |
80% |
|
5 |
70% |
15 |
85% |
|
6 |
80% |
16 |
80% |
|
7 |
65% |
17 |
45% |
|
8 |
75% |
18 |
75% |
|
9 |
75% |
19 |
75% |
|
10 |
90% |
20 |
80% |
Table 2. The accuracy of emotion classification of the three methods
|
Method |
Happiness |
Sadness |
Both emotions |
|
EEG modal |
72.5% |
75% |
73.75% |
|
Countenance modal |
65% |
72.5% |
68.75% |
|
Bimodal emotion identification system |
80% |
82.5% |
81.25% |
Obviously, the bimodal emotion identification system achieved the highest accuracy, which considers both EEG and countenance features. This means the accuracy of emotion classification can be improved by collecting signals of different modals, and fusing the features of these signals into a multimodal feature.
Using only one EEG channel FP1, our system identified both happy and sad emotions with an accuracy of 81.25%, which surpasses the accuracy of the traditional multi-EEG channel-based approach.
This paper adds the countenance modal to the EEG-based emotion classifier. The EEG and countenance features were extracted, and the eigenvectors were fused through proper methods. On this basis, a bimodal emotion identification system was established based on the fused bimodal features. The effectiveness of our system was validated through experiments on students in a real classroom: our system, which considers both EEG features and countenance features, outperformed EEG modal and countenance modal in emotion identification.
This work was supported by Liaoning Provincial Education Department Scientific Research Funding Project: SWOT Analysis of Dance sport Curriculum in Universities in Liaoning Province Based on Social Demand Background (Grant No.: WQN2019ST01).
[1] Plutchik, R. (2001). The nature of emotions: Human emotions have deep evolutionary roots, a fact that may explain their complexity and provide tools for clinical practice. American Scientist, 89(4): 344-350. https://www.jstor.org/stable/27857503
[2] Tomarken, A.J., Davidson, R.J., Wheeler, R.E., Doss, R.C. (1992). Individual differences in anterior brain asymmetry and fundamental dimensions of emotion. Journal of Personality and Social Psychology, 62(4): 676-687. https://doi.org/10.1037/0022-3514.62.4.676
[3] Ganapathy, N., Veeranki, Y.R., Swaminathan, R. (2020). Convolutional neural network based emotion classification using electrodermal activity signals and time-frequency features. Expert Systems with Applications, 159: 113571. https://doi.org/10.1016/j.eswa.2020.113571
[4] Gupta, A.K., Chakraborty, C., Gupta, B. (2021). Secure transmission of EEG data using watermarking algorithm for the detection of epileptical seizures. Traitement du Signal, 38(2): 473-479. https://doi.org/10.18280/ts.380227
[5] Melek, M., Manshouri, N., Kayikcioglu, T. (2020). Low-cost brain-computer interface using the Emotiv Epoc headset based on rotating vanes. Traitement du Signal, 37(5): 831-837. https://doi.org/10.18280/ts.370516
[6] Nawaz, R., Cheah, K.H., Nisar, H., Yap, V.V. (2020). Comparison of different feature extraction methods for EEG-based emotion recognition. Biocybernetics and Biomedical Engineering, 40(3): 910-926. https://doi.org/10.1016/j.bbe.2020.04.005
[7] Uchino, K., Nakagawa, M. (2011). On the Emotion Measurement Method with Fractal Dimension Subspace of Multichannel EEG Signals. IEICE Technical Report; IEICE Tech. Rep, 111(217): 33-38.
[8] Gao, Z., Cui, X., Wan, W., Gu, Z. (2019). Recognition of emotional states using multiscale information analysis of high frequency EEG oscillations. Entropy, 21(6): 609. https://doi.org/10.3390/e21060609
[9] Chen, D. W., Miao, R., Yang, W. Q., Liang, Y., Chen, H. H., Huang, L. (2019). A feature extraction method based on differential entropy and linear discriminant analysis for emotion recognition. Sensors, 19(7): 1631. https://doi.org/10.3390/s19071631
[10] Chao, H., Zhi, H., Dong, L., Liu, Y. (2018). Recognition of emotions using multichannel EEG data and DBN-GC-based ensemble deep learning framework. Computational Intelligence and Neuroscience, pp. 1-11. https://doi.org/10.1155/2018/9750904
[11] Aditya, S., Tibarewala, D.N. (2012). Comparing ANN, LDA, QDA, KNN and SVM algorithms in classifying relaxed and stressful mental state from two-channel prefrontal EEG data. International Journal of Artificial Intelligence and Soft Computing, 3(2): 143-164. https://doi.org/10.1504/IJAISC.2012.049010
[12] Kishore, D., Rao, C.S. (2020). A multi-class SVM based content based image retrieval system using hybrid optimization techniques. Traitement du Signal, 37(2): 217-226. https://doi.org/10.18280/ts.370207
[13] Nazih, W., Hifny, Y., Elkilani, W., Abdelkader, T., Faheem, H. (2019). Efficient detection of attacks in SIP based VoIP networks using linear l1-SVM classifier. International Journal of Computers Communications & Control, 14(4): 518-529. https://doi.org/10.15837/ijccc.2019.4.3563
[14] Afify, H.M., Mohammed, K.K., Hassanien, A.E. (2020). Multi-images recognition of breast cancer histopathological via probabilistic neural network approach. Journal of System and Management Sciences, 1(2): 53-68.
[15] Deore, S.P., Pravin, A. (2019). Histogram of oriented gradients based off-line handwritten Devanagari characters recognition Using SVM, K-NN and NN classifiers. Rev. d'Intelligence Artif., 33(6): 441-446. https://doi.org/10.18280/ria.330606
[16] Afify, H.M., Darwish, A., Mohammed, K.K., Hassanien, A.E. (2020). An automated CAD system of CT chest images for COVID-19 based on genetic algorithm and K-nearest neighbor classifier. Ingénierie des Systèmes d’Information, 25(5): 589-594. https://doi.org/10.18280/isi.250505
[17] You, Y., Chen, W., Li, M., Zhang, T., Jiang, Y., Zheng, X. (2020). Automatic focal and non-focal EEG detection using entropy-based features from flexible analytic wavelet transform. Biomedical Signal Processing and Control, 57: 101761. https://doi.org/10.1016/j.bspc.2019.101761
[18] Tafreshi, T.F., Daliri, M.R., Ghodousi, M. (2019). Functional and effective connectivity based features of EEG signals for object recognition. Cognitive Neurodynamics, 13(6): 555-566. https://doi.org/10.1007/s11571-019-09556-7
[19] Jia, Q., Gao, X., Guo, H., Luo, Z., Wang, Y. (2015). Multi-layer sparse representation for weighted LBP-patches based facial expression recognition. Sensors, 15(3): 6719-6739. https://doi.org/10.3390/s150306719
[20] Bin, S., Sun, G. (2020). Optimal energy resources allocation method of wireless sensor networks for intelligent railway systems. Sensors, 20(2): 482. https://doi.org/10.3390/s20020482
[21] Xi, X., Zhang, Y., Hua, X., Miran, S.M., Zhao, Y.B., Luo, Z. (2020). Facial expression distribution prediction based on surface electromyography. Expert Systems with Applications, 161: 113683. https://doi.org/10.1016/j.eswa.2020.113683
[22] Niese, R., Al-Hamadi, A., Farag, A., Neumann, H., Michaelis, B. (2012). Facial expression recognition based on geometric and optical flow features in colour image sequences. IET Computer Vision, 6(2): 79-89. https://doi.org/10.1049/iet-cvi.2011.0064
[23] Ghimire, D., Lee, J. (2013). Geometric feature-based facial expression recognition in image sequences using multi-class AdaBoost and support vector machines. Sensors, 13(6): 7714-7734. https://doi.org/10.3390/s130607714
[24] Sun, G., Chen, C.C., Bin, S. (2021). Study of cascading failure in multisubnet composite complex networks. Symmetry, 13(3): 523. https://doi.org/10.3390/sym13030523
[25] Wang, Y., Li, M., Zhang, C., Chen, H., Lu, Y. (2020). Weighted-fusion feature of MB-LBPUH and HOG for facial expression recognition. Soft Computing, 24(8): 5859-5875. https://doi.org/10.1007/s00500-019-04380-x
[26] Jeong, D., Kim, B.G., Dong, S.Y. (2020). Deep joint spatiotemporal network (DJSTN) for efficient facial expression recognition. Sensors, 20(7): 1936. https://doi.org/10.3390/s20071936
[27] Mayya, V., Pai, R.M., Pai, M.M. (2016). Automatic facial expression recognition using DCNN. Procedia Computer Science, 93: 453-461. https://doi.org/10.1016/j.procs.2016.07.233
[28] Su, Y., Li, W., Bi, N., Lv, Z. (2019). Adolescents environmental emotion perception by integrating EEG and eye movements. Frontiers in Neurorobotics, 13: 46. https://doi.org/10.3389/fnbot.2019.00046
[29] Kessous, L., Castellano, G., Caridakis, G. (2010). Multimodal emotion recognition in speech-based interaction using facial expression, body gesture and acoustic analysis. Journal on Multimodal User Interfaces, 3(1): 33-48. https://doi.org/10.1007/s12193-009-0025-5
[30] Spapé, M.M., Harjunen, V., Ravaja, N. (2017). Effects of touch on emotional face processing: A study of event-related potentials, facial EMG and cardiac activity. Biological Psychology, 124: 1-10. https://doi.org/10.1016/j.biopsycho.2017.01.002
[31] Panuszka, R., Damijan, Z., Kasprzak, C. (2004). Fractal EEG analysis with Higuchi’s algorithm of low-frequency noise exposition on humans. The Journal of the Acoustical Society of America, 115(5): 2388-2388. https://doi.org/10.1121/1.4780443
[32] Tian, G., Zhou, S., Sun, G., Chen, C.C. (2020). A novel intelligent recommendation algorithm based on mass diffusion. Discrete Dynamics in Nature and Society, 2020: 4568171. https://doi.org/10.1155/2020/4568171