Chao Zhang | Ji Zou | Zhongjing Ma*
© 2021 IIETA. This article is published by IIETA and is licensed under the CC BY 4.0 license (http://creativecommons.org/licenses/by/4.0/).
OPEN ACCESS
The development of science and technology has promoted the extensive application of surface electromyography (sEMG) collection technique in real-time exercise testing, assistive judgment of rehabilitation therapy, and assessment of intelligent artificial limb application. However, there is a severe lacking of studies on pattern recognition based on effective signal, and evaluation of limb rehabilitation status. To make up for the gap, this paper explores the identification and analysis of limb rehabilitation signal based on wavelet transform. Specifically, the authors detailed the basic flow of sEMG signal generation in motor unit during limb rehabilitation exercise, and proposed a limb EMG pattern recognition method. Then, support vector machine (SVM) was selected to recognize the pattern of the EMG signal extracted from the limb rehabilitation exercise of patients, and to judge the rehabilitation status. Finally, wavelet thresholding was combined with total variation denoising (TVD) to effectively remove the noise from EMG signal. The proposed method was proved effective through experiments.
wavelet thresholding, limb rehabilitation, electromyography (EMG) signal, pattern recognition
The proliferation of artificial intelligence in rehabilitation has brought convenience to our lives [1-6]. The painless and noninvasive surface electromyography (sEMG) collection technique is being extensively applied to real-time exercise testing, assistive judgment of rehabilitation therapy, and assessment of intelligent artificial limb application [7-10]. Based on the collected EMG signal, it is possible to effectively judge the limb rehabilitation stats of patients, and provide practical evidence to the development of rehabilitation medicine.
So far, domestic and foreign researchers have deeply explored the processing and analysis of sEMG signal, and drawn many substantive conclusions [11-16]. To avoid the complex and time-consuming preprocessing of surface signal, Prasad et al. [17] labeled the EMG signals of four gestures (fist-clenching, left movement, right movement, and palm-opening), divided the training set and test set by signal length, and applied convolutional neural network (CNN) to efficiently process EMG signal, and recognize and classify the gestures. To find the potential causes of chronic non-specific lumbago, Lee et al. [18] established the relationship between the degree of pain and the peak torque of extensors and flexors, and verified the interaction and positive correlation between the two factors, according to the degree of muscle pain and the root-mean-square of dysfunction index of patients during exercise. Shabani and Mahjoob [19] detected and analyzed the EMG signal changes of main muscles in the typical Tai Chi style “Brush Knee and Twist Step”, extracted the effective eigenvalues of the signal, and realized the pattern recognition of long- and short-term practitioners, based on backpropagation neural network (BPNN). Using support vector machine (SVM), Johnson et al. [20] gathered the EMG signal from the hands of amputees, and distinguished their arm motions from those of able-bodied subjects. To disclose the change law of EMG signal of lower limbs in active and passing walking, Kurzynski and Wolczowski [21] adopted the three-dimensional (3D) motion capture and analysis system to collect and analyze the EMG signal of 15 subjects during slow walking, normal walking, and fast walking, and presented the results of 3D gait analysis.
To sum up, many scholars have explored EMG signal processing, especially in terms of collection principle, signal preprocessing, and signal feature analysis [22-27]. However, there is a severe lacking of studies on pattern recognition based on effective signal, and evaluation of limb rehabilitation status. To make up for the gap, this paper introduces wavelet transform to the identification and analysis of limb rehabilitation signal. Section 2 details the basic flow of sEMG signal generation in motor unit during limb rehabilitation exercise, and proposes a limb EMG pattern recognition method. Section 3 chooses the SVM to recognize the pattern of the EMG signal extracted from the limb rehabilitation exercise of patients, and to judge the rehabilitation status. Section 4 combines wavelet thresholding with total variation denoising (TVD) to effectively remove the noise from EMG signal. Experimental results demonstrate the effectiveness of our method.
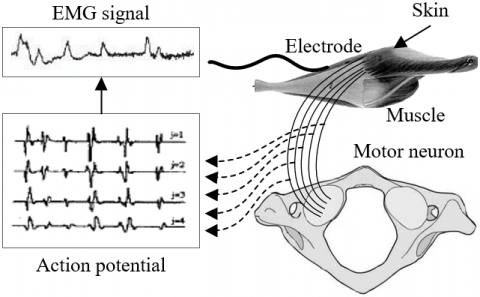
Figure 1 explains the basic flow of the formation of sEMG signal in a motor unit during limb rehabilitation exercise. The motor unit, stimulated by the neurotransmitter in synaptic cleft, produces an action potential on the relevant muscle fiber. The action potential will be transmitted electrochemically. The transmission will cause muscle fiber to change and the muscle to contract. The repeated muscle contractions continuously induce and activate the action potential of the motor unit. In this way, a sequence of action potentials will appear. These potentials will superimpose each other in time and space, thereby producing EMG signal.
Figure 1. Formation of sEMG signal
If the limbs of the patient are gradually improving, the theory of muscle synergy indicates that the central nervous system will send a limb control command. After receiving the command, the corresponding limb muscles will be regulated well. These muscles will be linearly combined in order, and a muscle contraction mode will form. In this way, the limb could complete the right motion function. Mathematically, the i-th correct limb motion function ui equals the linear weighting of the muscle synergy gj and activation coefficient qij of M groups of limb muscles:
$\begin{align} & {{u}_{i}}\left( l \right)\approx \sum\nolimits_{j=1}^{M}{{{q}_{ij}}{{g}_{j}}\left( l \right)}\text{ } \\ & \left\{ i=1,...,N,j=1,...,M,M<N \right\} \\\end{align}$ (1)
Let O be the number of synergic elements; N be the dimensionality of the eigenvector; M be the number of samples; u be the N×M matrix of muscle motion samples of limb rehabilitation; Q be the muscle synergy matrix with N×O motion patterns; G be the O×M activation coefficient matrix of muscle synergy; F be the N×M matrix of noises. Then, the muscle motions of limb rehabilitation can be modeled as:
$U=Q\times G+F$ (2)
Formula 2 is a nonnegative matrix. There are two classic multiplicative iteration methods to decompose such a matrix: Kullback-Leibler (KL) multiplicative iteration, and Euclidean distance iteration. The KL multiplicative iteration can be expressed as:
$\underset{Q\text{ }G}{\mathop{min}}\,T\left( U\left\| QG \right. \right)=\sum{_{ij}}\left( {{U}_{ij}}log\frac{{{u}_{ij}}}{{{\left( QG \right)}_{ij}}} \right)-{{U}_{ij}}+{{\left( QG \right)}_{ij}}$ st. Q∈RN×O, H∈RO×M Q, G≥0 (3)
The iterative formula to solve formula 3 can be derived as:
${{Q}_{ij}}\leftarrow {{Q}_{ij}}\frac{\sum{_{ij}}{{G}_{jl}}{{U}_{il}}/{{\left( QG \right)}_{il}}}{\sum{_{O}}{{G}_{jO}}};$
${{G}_{jl}}\leftarrow {{G}_{jl}}\frac{\sum{_{i}}{{Q}_{ij}}{{U}_{il}}/{{\left( QG \right)}_{il}}}{\sum{_{\tau }}{{Q}_{\tau j}}};$ (4)
In Euclidean distance iteration, the muscle motions of limb rehabilitation can be modeled as:
$F=U-QG\text{ }s.t.Q,G\ge 0$ (5)
Formula 5 shows that ||F||2 must be minimized to solve matrices Q and G, while preserving the effective information in the original matrix U. Provided that the noise matrix obeys Gaussian distribution, the maximum likelihood formula can be derived from the training samples of the muscle motions of limb rehabilitation:
$\begin{align} & K\left( Q,G \right)=\prod{_{i,j}}\frac{1}{\sqrt{2\pi }{{\phi }_{ij}}}exp\left( -\frac{F_{ij}^{2}}{2{{\phi }_{ij}}} \right) \\ & =\prod{_{i,j}}\frac{1}{\sqrt{2\pi {{\phi }_{ij}}}}exp\left( -\frac{{{\left( {{U}_{ij}}-{{\left( QG \right)}_{ij}} \right)}^{2}}}{2{{\phi }_{ij}}} \right) \\\end{align}$ (6)
Taking the logarithm of formula 6, the logarithmic likelihood function can be established as:
$K\left( Q,G \right)=\sum{_{ij}ln\frac{1}{\sqrt{2\pi }{{\phi }_{ij}}}-\frac{1}{2{{\phi }_{ij}}}\sum{_{i,j}}}{{\left[ {{U}_{ij}}-{{\left( QG \right)}_{ij}} \right]}^{2}}$ (7)
Ignoring the variance difference between noises, formula (7) is equivalent to:
$ZS\left( Q,G \right)=\frac{1}{2}\sum{_{ij}}{{\left[ {{U}_{ij}}-{{\left( QG \right)}_{ij}} \right]}^{2}}$ (8)
where, (QG)ij can be calculated by:
${{\left( QG \right)}_{ij}}=\sum{_{l}{{Q}_{il}}}{{G}_{lj}}\Rightarrow \frac{\partial {{\left( QG \right)}_{ij}}}{\partial {{Q}_{il}}}={{G}_{kj}}$ (9)
Combining formulas 8 and 9:
$\begin{align} & \frac{{{\partial }_{J}}{{\left( QG \right)}_{ij}}}{\partial {{Q}_{il}}}=\sum{_{j}}\left[ -{{G}_{hj}}\left( {{U}_{ij}}-{{\left( QG \right)}_{ij}} \right) \right] \\ & ={{\left( QG{{G}^{\psi }} \right)}_{il}}-{{\left( U{{G}^{\psi }} \right)}_{il}} \\\end{align}$ (10)
Similarly, we have:
$\frac{{{\partial }_{ZS}}{{\left( QG \right)}_{ij}}}{\partial {{Q}_{il}}}={{\left( {{Q}^{\psi }}QG \right)}_{lj}}-{{\left( {{Q}^{\psi }}U \right)}_{lj}}$ (11)
Through gradient descent, Qil can be iteratively calculated by:
${{Q}_{il}}={{Q}_{il}}-{{\beta }_{1}}\cdot =\left[ {{\left( QG{{G}^{\psi }} \right)}_{il}}-{{\left( U{{G}^{\psi }} \right)}_{il}} \right]$ (12)
Similarly, Gij can be calculated by:
${{G}_{lj}}={{G}_{lj}}-{{\beta }_{2}}\cdot \left[ {{\left( {{Q}^{\psi }}QG \right)}_{lj}}-{{\left( {{Q}^{T}}U \right)}_{lj}} \right]$ (13)
β1 and β2 can be calculated by:
${{\beta }_{1}}=\frac{{{Q}_{il}}}{{{\left( QG{{G}^{\psi }} \right)}_{il}}}\text{ }{{\beta }_{2}}=\frac{{{G}_{lj}}}{{{\left( {{Q}^{\psi }}QG \right)}_{lj}}}$ (14)
Qil and Gij can be iteratively calculated by:
${{Q}_{il}}\leftarrow {{Q}_{il}}\cdot \frac{{{\left( U{{G}^{\psi }} \right)}_{il}}}{{{\left( QG{{G}^{\psi }} \right)}_{il}}}\text{ }{{G}_{lj}}\leftarrow {{G}_{lj}}\cdot \frac{{{\left( {{Q}^{\psi }}U \right)}_{lj}}}{{{\left( {{Q}^{\psi }}QG \right)}_{lj}}}$ (15)
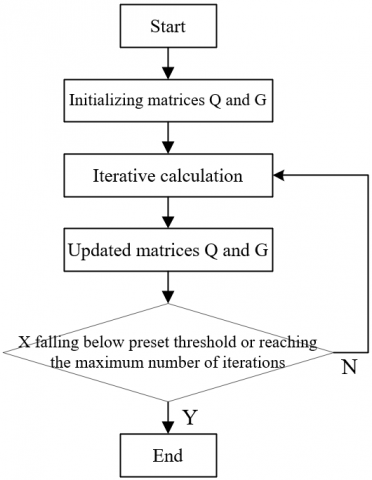
Through the above derivation, it is possible to clarify the muscle synergy process in limb rehabilitation by decomposing the nonnegative matrix (Figure 2).
Figure 2. Muscle synergy extraction through nonnegative matrix decomposition
Through nonnegative matrix decomposition, matrix U was decomposed into matrices Q and G. However, the number of columns in Q and the number of synergic elements O are both uncertain. This is a key factor in solving muscle synergy during limb rehabilitation analysis. Once O is determined, it is easy to determine the Q and G decomposed from U.
The common way to determine the number of synergic elements O is to calculate the data similarity UDA between the reconstructed matrix U'=Q×G of muscle motions in limb rehabilitation and the original matrix U:
$UDA=1-\frac{{{\left( u-u' \right)}^{2}}}{{{u}^{2}}}$ (16)
The closer the U' is to U, the greater the UDA. The inverse is also true.
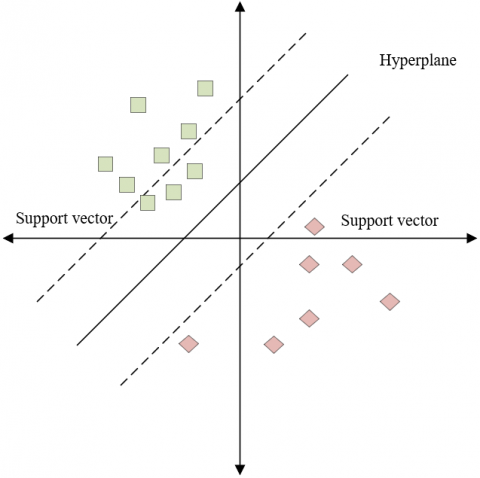
This paper selects the SVM to recognize the pattern of the EMG signal extracted from the limb rehabilitation exercise of patients, and to judge the rehabilitation status. The basic idea is to judge and classify the mode of EMG signal with the help of decision function. Figure 3 shows the principle of the SVM. Suppose there are two mode data (D1 and D2) containing the EMG signal in limb rehabilitation. A training set ψ={(A1, b1)(A2, b2)…(Am,bM)} could be established with the samples extracted from the two mode data, where AM∈ℝn is the sampled EMG data, bM=-1 or 1 is a binary function corresponding to the label of AM. To classify D1 and D2, the decision function e(a) must satisfy:
$\left\{ \begin{align} & e\left( a \right)>0,A\in {{D}_{1}} \\ & e\left( a \right)<0,A\in {{D}_{2}} \\\end{align} \right.$ (17)
$\left\{ \begin{align} & sgn\left( e\left( a \right) \right)=1,A\in {{D}_{1}} \\ & sgn\left( e\left( a \right) \right)=-1,A\in {{D}_{2}} \\\end{align} \right.$ (18)
The solving of e(a) is critical to the correct classification of mode data. Firstly, the mode data sample set {(AM, bM)}mM=1, AM∈Rn, bM∈{1, -1} was given for training, and the data relationship was defined as: If the mode data of the target EMG signal belong to class D1, bM=1; if AM belongs to D2, bM=-1. Then, the authors searched for the classifier that maximizes the distance of the target data point from the hyperplane, and then construct the classification function.
Figure 3. Principle of the SVM
The focus of this research is to explore the muscle synergy mode for limb rehabilitation, and recognize limb motions with eigenvalues. Therefore, the pattern recognition effect must be evaluated. In this paper, the distance measure is chosen, which is often used to measure the interclass separability in pattern recognition. The calculation process is detailed as follows:
Let i be the muscle channel; m be the number of mode data samples; GE and GR be the data samples obtained from EMG signal modes GE and GR, respectively; GEB and GRB be the centroids of the feature data of GE and GR, respectively, with suffix B be the centroid. Firstly, the centroid of the feature set of each EMG mode can be solved by:
$G{{E}_{B}}=\frac{1}{m}\sum\nolimits_{i=1}^{6}{GE\left( i,: \right)}$ (19)
Let ξ be the distance between eigenvectors in the feature space; ξGR-GEB(i) be the distance from the i-th GR EMG signal mode data sample to GEB; ξGR-GEB(i) be the distance between the centroids of GR and GE data samples. Then, the distance from the centroid of an EMG signal mode to any point in the feature space of the other EMG signal mode can be computed by:
${{\xi }_{GR-G{{E}_{B}}}}\left( i \right)=\sqrt{{{\left[ GR\left( i \right)-G{{E}_{B}} \right]}^{2}}},i=1,2,......,m$ (20)
The distance between the centroids of the two EMG signal modes can be calculated by:
${{\xi }_{G{{R}_{B}}-G{{E}_{B}}}}=\sqrt{{{\left[ GR\left( j \right)-G{{E}_{B}} \right]}^{2}}}$ (21)
4.1 Denoising principle
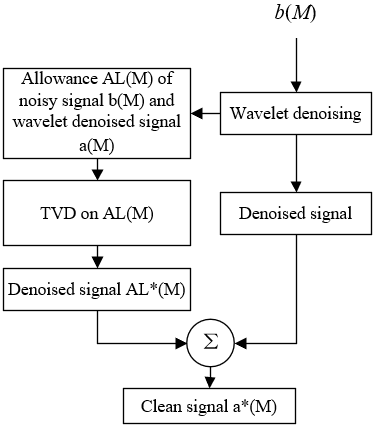
During the EMG signal collection from patient limbs during rehabilitation, the EMG signal can be divided into upper limb EMG signal, lower limb EMG signal, and hand EMG signal, according to the placement of electrodes on the patient body. In actual clinical detection, the noninvasive sEMG signal collection technique is often adopted. However, the collected signal is usually too weak and prone to noise disturbance. The noisy signal will cause errors to the classification of mode data. Therefore, it is important to denoise the EMG signal before pattern recognition and evaluation of rehabilitation status. To ensure the denoising effect, this paper combines wavelet thresholding with TVD (Figure 4).
Figure 4. Flow of proposed combinatory denoising strategy
The total variation of the one-dimensional (1D) EMG signal can be defined as:
$QB\left( a \right)=\sum\limits_{M=1}^{m}{\left| a\left( M+1 \right)-a\left( M \right) \right|}$ (22)
Formula 22 can be rewritten as QB(a)=||ξa|| 1, which is the l1-norm of ξa. Ξ can be expressed as:
$\xi ={{\left( \begin{matrix} -1 & 1 & {} & {} & {} & {} \\ {} & -1 & 1 & {} & {} & {} \\ {} & {} & {} & \ddots & {} & {} \\ {} & {} & {} & {} & -1 & 1 \\\end{matrix} \right)}_{m\times \left( m+1 \right)}}$ (23)
Suppose b= b(M) is a signal with additive noise. Then:
$b=a+Q$ (24)
where, a =a(M)∈ℝm is the clean signal; Q = Q(M)∈ℝm is noising signal.
The proposed combinatory denoising strategy is as follows: First, wavelet thresholding is carried out in three steps:
Step 1. Carry out wavelet decomposition of EMG signal b(M) to obtain detail coefficients and scale coefficients, and set thresholds for the obtained scale coefficients.
Step 2. Estimate the standard deviation ε of the noise based on the detail coefficients. Suppose the EMG signal length is ms. Then, define the optional wavelet threshold as ε·(2logems)0.5. Choose the threshold just greater than the maximum noise amplitude to process the detail coefficients on each scale.
Step 3. Carry out inverse wavelet transform based on ε, and further reconstruct the EMG signal. That is, perform TVD regularization on the denoised signal a*(M).
The TVD consists of three steps:
Step 1. Compute the allowance AL(M) of b(M) and a*(M):
$AL\left( M \right)=b\left( M \right)-{{a}^{*}}\left( M \right)$ (25)
Step 2. Let β be the regularization parameter to adjust weights; ξ be the first-order differential matrix. Denoise AL(M) through TVD regularization:
$\begin{align} & A{{L}^{*}}\left( M \right)=\arg \underset{AL}{\mathop{\min }}\,\frac{1}{2}\left\| AL\left( M \right)-A{{L}^{*}}\left( M \right) \right\|_{2}^{2} \\ & +\beta {{\left\| \xi A{{L}^{*}}\left( M \right) \right\|}_{1}} \\\end{align}$ (26)
Formula 26 shows that the denoised allowance contains a fidelity term and a TVD regularization term. If the latter term does not play a punitive role, β=0; if the latter term dominates the process, β approaches ∞. In the latter case, the TVD regularization term must be very small to reconstruct the EMG signal. However, a small TVD regularization term will dampen the denoising effect, and reduce the fidelity. Therefore, a suitable β value should be selected to optimize the denoising effect.
Step 3. Let a(M) be the noise-free clean EMG signal. Reconstruct the original signal from the denoised signal of wavelet thresholding and that of TVD regularization:
$a\left( M \right)={{a}^{*}}\left( M \right)+A{{L}^{*}}\left( M \right)$ (27)
It is difficult to find the derivative of the TVD term ||ξAL^||1 in the absolute form. To overcome the difficulty, this paper iteratively solves the derivative alternating direction method of multipliers (ADMM). According to the TVD regularization denoising model, formula 26 can be converted into a constraint minimization problem:
$A{{L}^{*}}\left( M \right)=arg\underset{A{{L}^{*}}}{\mathop{min}}\,\frac{1}{2}\left\| AL\left( M \right)-A{{L}^{*}}\left( M \right) \right\|_{2}^{2}+\beta {{\left\| v \right\|}_{1}}$ (28)
The objective function of the optimization problem can be described by:
$\text{ }\xi A{{L}^{*}}\left( M \right)-v=0$ (29)
Let μ=(μ1; μ2; …; μms-1) be the augmented Lagrange multiplier; σ be the penalty parameter. Then, formula 29 can be converted into an unconstrained optimization problem:
$\begin{align} & K\left( A{{L}^{*}}\left( M \right),v,\mu \right)=arg\underset{v,\overset{\wedge }{\mathop{AL}}\,}{\mathop{min}}\,\frac{1}{2}\left\| AL\left( M \right)-A{{L}^{*}}\left( M \right) \right\|_{2}^{2} \\ & +\beta {{\left\| v \right\|}_{1}}+{{\mu }^{\psi }}\left( \xi A{{L}^{*}}\left( M \right)-v \right)+\frac{\sigma }{2}\left\| \xi A{{L}^{*}}\left( M \right)-v \right\|_{2}^{2} \\\end{align}$ (30)
Because it is impossible to directly find the derivative of absolute value, make v=vl and find the derivative of AL* in formula 30:
$\begin{align} & \frac{\partial K}{\partial A{{L}^{*}}\left( M \right)}=-\left( AL\left( M \right)-A{{L}^{*}}\left( M \right) \right)+{{\xi }^{\psi }}{{\mu }_{l}} \\ & -\sigma {{\xi }^{\psi }}\left( \xi A{{L}^{*}}\left( M \right)-{{v}_{l}} \right)=0 \\\end{align}$ (31)
Solving formula 31:
$A{{L}^{*}}_{l+1}\left( M \right)=\frac{AL\left( M \right)-{{\xi }^{\psi }}{{\mu }_{l}}+\sigma {{\xi }^{\psi }}{{v}_{l}}}{HS+\sigma {{\xi }^{\psi }}\xi }$ (32)
Let Φ(∙) be the 1D contraction operator. Combining formula 32 with formula 30 to solve vl+1:
$\begin{align} & {{v}_{l+1}}=\arg \underset{v}{\mathop{\min }}\,\beta {{\left\| v \right\|}_{1}}+\mu _{^{l}}^{\psi }\left( \xi A{{L}^{*}}_{l+1}\left( M \right)-v \right) \\ & +\frac{\sigma }{2}\left\| \xi A{{L}^{*}}_{l}\left( M \right)-v \right\|_{2}^{2}=\arg \underset{v}{\mathop{\min }}\,\beta {{\left\| v \right\|}_{1}} \\ & +\frac{\sigma }{2}\left\| \xi A{{L}^{*}}_{l+1}\left( M \right)-v+\frac{{{\mu }_{l}}}{\sigma } \right\|_{2}^{2} \\ & =\Phi \left( \xi A{{L}^{*}}_{l+1}\left( M \right)+\frac{{{\mu }_{l}}}{\sigma },+\frac{\beta }{\sigma } \right) \\\end{align}$ (33)
4.2 Evaluation of denoising effect
This paper evaluates the denoising effect of EMG signal with root mean square error ERMSE, signal-to-noise ratio ESNR, and Pearson correlation coefficient EP. Let CX(M) be the clean EMG signal before adding any noise; a(M) be the denoised EMG signal. Then, ERMSE can be calculated by:
${{E}_{RMSE}}=\sqrt{\frac{1}{m}\sum\limits_{M=1}^{m}{{{\left( a\left( M \right)-CX\left( M \right) \right)}^{2}}}}$ (34)
The smaller the ERMSE, the better the denoising effect. ESNR can be calculated by:
${{E}_{SNR}}=10{{\log }_{10}}\left( \sum\limits_{M=1}^{m}{C{{X}^{2}}\left( M \right)}/\sum\limits_{M=1}^{m}{{{\left( a\left( M \right)-CX\left( M \right) \right)}^{2}}} \right)$ (35)
The greater the ESNR, the better the denoising effect. The Pearson correlation coefficient EP measures the correlation between two signals. The value range of the coefficient is [-1, 1]. If EP=1, then the two signals are positively correlated; If EP=-1, then the two signals are negatively correlated. Let CX'(M) and a'(M) be the mean of CX(M) and a(M), respectively. Then, EP can be calculated by:
$\gamma =\frac{\sum\nolimits_{M=1}^{m}{\left( CX\left( M \right)-C{X}'\left( M \right) \right)\left( a\left( M \right)-{a}'\left( M \right) \right)}}{\sqrt{\sum\nolimits_{M=1}^{m}{{{\left( CX\left( M \right)-C{X}'\left( M \right) \right)}^{2}}}}\sqrt{\sum\nolimits_{M=1}^{m}{{{\left( a\left( M \right)-{a}'\left( M \right) \right)}^{2}}}}}$ (36)
The greater the EP, the better the denoising effect.
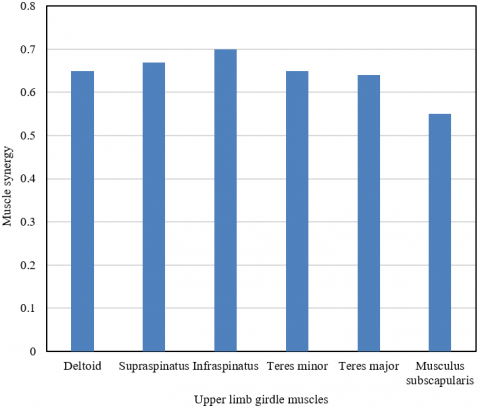
(a) Upper limb girdle muscles
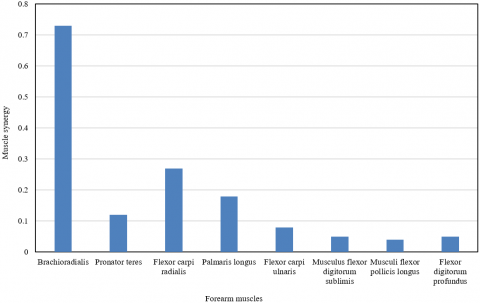
(b) Forearm muscles
Figure 5. Muscle synergy of different motions
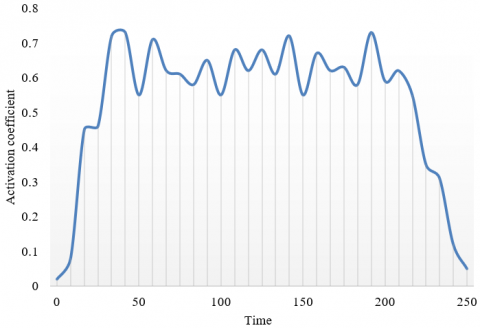
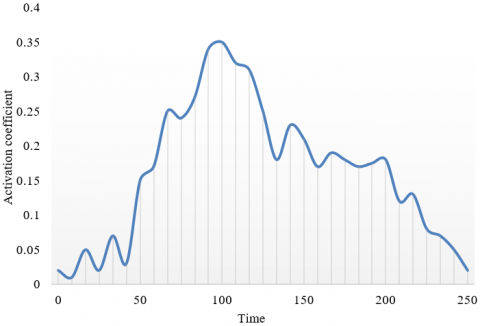
To verify the effectiveness of our algorithm, patient habitation experiments were designed, and the sEMG signals of patients in different motion spaces were preprocessed and decomposed by nonnegative matrix method. Figures 5 and 6 show the processed muscle synergy matrices and activation coefficient matrices, respectively. Figures 5(a) and 5(b) present the muscle synergy of the patients moving their upper limb girdle muscles and forearm muscles, respectively; Figures 6(a) and 6(b) present the activation coefficient changes as the patients stretch their upper limbs and rotate their forearms, respectively.
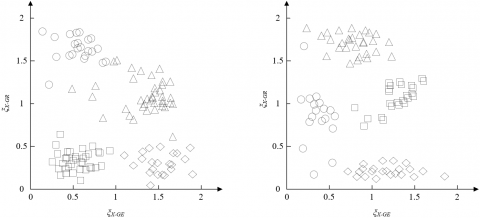
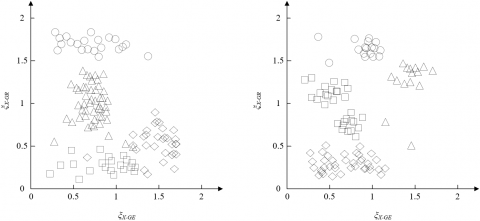
When the body performs various limb motions, each relevant muscle is in a synergistic state. The muscle synergy could activate muscles in a fixed order or any muscle by random. The activated muscle will produce an EMG signal. The number of synergic elements must be suitably determined to fully extract the key EMG information. This number was set to 1 in our experiments. During the rehabilitation, the patients execute the same motions. The eigenvalues of the motions are distributed in the feature space, and differ in the distribution pattern. The difference can reflect the clustering relationship of the motion modes. Figure 7 shows the distribution of features of the same motion of limb rehabilitation in the feature space.
(a) Upper limb stretching
(b) Forearm rotation
Figure 6. Activation coefficient variation of different motions
Figure 7. Distribution of features of the same motion of limb rehabilitation in the feature space
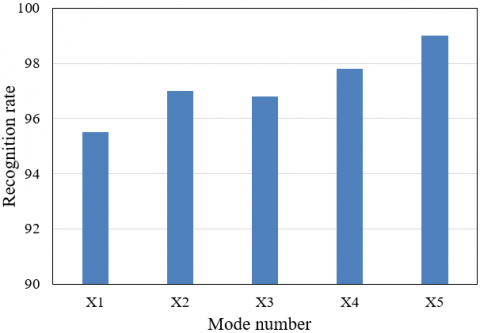
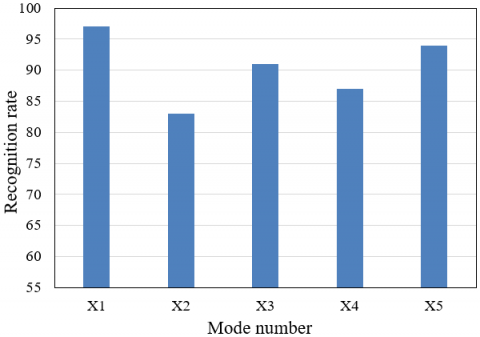
Figure 8. Pattern recognition results of motions in limb rehabilitation
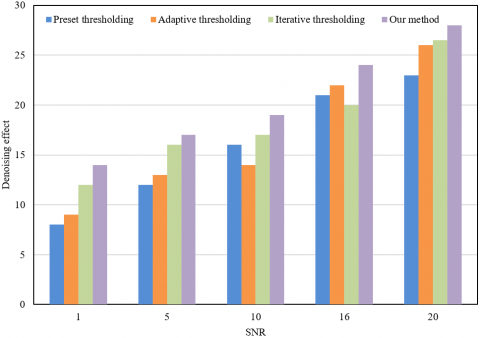
Table 1. Evaluation results on EMG signal denoising by different methods
|
SNR |
Metrics |
Preset thresholding |
Adaptive thresholding |
Iterative thresholding |
Our method |
|
1 |
ESNR |
9.435 |
9.6497 |
10.3821 |
11.3581 |
|
ERMSE |
0.6153 |
0.5634 |
0.5657 |
0.4515 |
|
|
EP |
0.9864 |
0.935 |
0.9536 |
0.9628 |
|
|
2 |
ESNR |
13.3082 |
10.6012 |
11.5652 |
14.4832 |
|
ERMSE |
0.4769 |
0.5120 |
0.4876 |
0.356 |
|
|
EP |
0.9321 |
0.9325 |
0.9548 |
0.9641 |
|
|
3 |
ESNR |
14.7687 |
14.5841 |
16.1025 |
17.4527 |
|
ERMSE |
0.3564 |
0.3784 |
0.2617 |
0.2539 |
|
|
EP |
0.9538 |
0.9353 |
0.9547 |
0.9728 |
|
|
4 |
ESNR |
22.3041 |
18.1842 |
22.4525 |
23.652 |
|
ERMSE |
0.1573 |
0.1865 |
0.1462 |
0.1235 |
|
|
EP |
0.9867 |
0.9837 |
0.9816 |
0.998 |
Further, the eigenvectors of the same motions in different stages of rehabilitation were constructed for each patient based on muscle synergy, the spatial distribution of motion eigenvalues was derived, and the centroid distance between each patient and a healthy subject was calculated. The centroid distances of all patients were collected and averaged, revealing the EMG mode of the same motion in different stages. Figure 7 shows that the same motion in different stages clustered well in space. The distribution pattern indicates a slight shift in the centroid position of the said motion. In the future, even if the eigenvalue samples of the motion in different stages of different subjects are mixed together, the EMG pattern of the motion can be derived from the centroid of motion eigenvalues, as long as the motion is the same. In other words, it is possible to know the stage of rehabilitation of every patient.
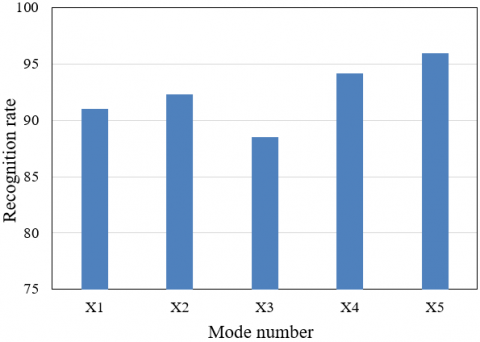
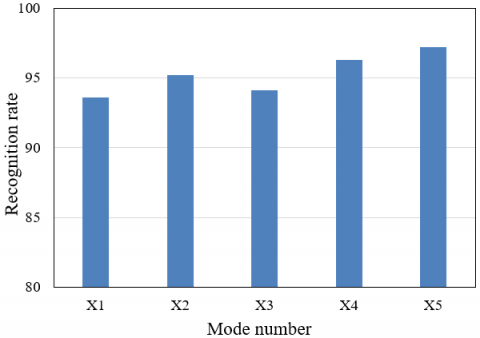
The SVM was coupled with 5-fold orthogonal method to classify the motion pattern and rehabilitation stage of each subject. The recognition rate of the motions was counted. The training set and test set of EMG signal data samples were divided by 5:1. For each subject, 250 samples were randomly selected from the data sample set for training, and 50 for testing. Finally, the pattern recognition rates were obtained for five different motions. Figure 8 shows the recognized stage for each action of each subject. From the recognition rates of all subjects, it can be seen that the recognition rate was higher in the last stage of rehabilitation X5 than the early phases. The recognition rate of the same motion varied among the subjects, but the different was not large. Among all subjects, the recognition rate peaked at 97.64% and minimized at 87.42%. Therefore, the recognition rate of all motions, and the habitation stage judgement of all subjects are both on a satisfactory level.
To verify the effectiveness of the proposed wavelet transform-based EMG signal denoising method, Gaussian white noises were added to the collected sEMG signal to reach different SNRs. Then, the noisy signals were separately processed by the wavelet-based preset thresholding, wavelet-based adaptive thresholding, wavelet-based iterative thresholding, and our method. The denoising effect of each method was evaluated by ERMSE, ESNR and EP. Table 1 and Figure 9 compare the evaluation results. It can be seen that, our method achieved better denoising effect, and stronger robustness than the other three denoising methods. In addition, our method was least disturbed by noise.
Figure 9. SME signal denoising effects of different methods
This paper probes deep into the identification and analysis of limb rehabilitation signal based on wavelet transform. Firstly, the authors detailed the basic flow of sEMG signal generation in motor unit during limb rehabilitation exercise, and presented a limb EMG pattern recognition method. Next, SVM was selected to recognize the pattern of the EMG signal extracted from the limb rehabilitation exercise of patients, and to judge the rehabilitation status. Through experiments, the authors plotted the processed muscle synergy matrices and the activation coefficient matrices, disclosed the distribution of the features of the same motion in limb rehabilitation in the feature space, and judged the EMG pattern and the stage of rehabilitation. Finally, the wavelet thresholding was integrated with TVD to improve the noise removal effect of EMG signals. The EMG signal denoising effects of multiple methods were compared through experiments. The comparison shows that our method achieved the best denoising effect, the highest robustness, and the strongest interference resistance.
This work was supported by the Department of Education project: JJKH20200569KJ.
[1] Meng, H., Wang, J., Lei, C., Zhang, H. (2021). Action recognition and correction by using EMG signal for health sports. Internet Technology Letters, 4(3): e241. https://doi.org/10.1002/itl2.241
[2] Ahmed, T., Islam, M.K. (2021). EMG signal classification for detecting neuromuscular disorders. Journal of Physics: Conference Series, 1921(1): 012043. https://doi.org/10.1088/1742-6596/1921/1/012043
[3] Shin, S., Lee, J.H., Son, S.H. (2016). A survey of approaches for recognizing hand gestures using EMG signal. 2016 IEEE 22nd International Conference on Embedded and Real-Time Computing Systems and Applications (RTCSA), Daegu, Korea (South), pp. 263-263. https://doi.org/10.1109/RTCSA.2016.22
[4] Wu, Q., Mao, J.F., Wei, C.F., Fu, S., Law, R., Ding, L., Yu, B.T., Jia, B., Yang, C.H. (2016). Hybrid BF–PSO and fuzzy support vector machine for diagnosis of fatigue status using EMG signal features. Neurocomputing, 173: 483-500. https://doi.org/10.1016/j.neucom.2015.06.002
[5] Barioul, R., Ghribi, S.F., Kanoun, O. (2016). A low cost signal acquisition board design for myopathy's EMG database construction. In 2016 13th International Multi-Conference on Systems, Signals & Devices (SSD), Leipzig, Germany, pp. 274-279. https://doi.org/10.1109/SSD.2016.7473767
[6] Geman, O., Chiuchisan, I., Covasa, M., Eftaxias, K., Sanei, S., Madeira, J.G.F., Boloy, R.A.M. (2016). Joint EEG-EMG signal processing for identification of the mental tasks in patients with neurological diseases. In 2016 24th European Signal Processing Conference (EUSIPCO), Budapest, Hungary, pp. 1598-1602. https://doi.org/10.1109/EUSIPCO.2016.7760518
[7] Nagasirisha, B., Prasad, V.V.K.D.V. (2021). EMG Signal denoising using adaptive filters through hybrid optimization algorithms. Biomedical Engineering: Applications, Basis and Communications, 33(2): 2150009. https://doi.org/10.4015/S1016237221500095
[8] Nascimento, F.A., Trabuco, M.H., Macchiavello, B., Gusmão, D.B., Costa, M.V. (2021). Improved two-dimensional dynamic S-EMG Signal compression with robust automatic segmentation. Biomedical Signal Processing and Control, 68: 102578. https://doi.org/10.1016/j.bspc.2021.102578
[9] Di Nardo, F., Morbidoni, C., Cucchiarelli, A., Fioretti, S. (2021). Influence of EMG-signal processing and experimental set-up on prediction of gait events by neural network. Biomedical Signal Processing and Control, 63: 102232. https://doi.org/10.1016/j.bspc.2020.102232
[10] Wadud, A., Showrov, M.I.H. (2020). EMG signal classification with effective features for diagnosis. International Conference on Image Processing and Capsule Networks, pp. 629-637. https://doi.org/10.1007/978-3-030-51859-2_57
[11] Abusedra, L.F., Busedra, H.F., Elzawi, M. (2020). Lower limb exoskeleton control using EMG signal analysis. In Proceedings of the 6th International Conference on Engineering & MIS 2020. https://doi.org/10.1145/3410352.3410831
[12] Inam, S., Al Harmain, S., Shafique, S., Afzal, M., Rabail, A., Amin, F., Waqar, M. (2021). A brief review of strategies used for EMG signal classification. 2021 International Conference on Artificial Intelligence (ICAI), Islamabad, Pakistan, pp. 140-145. https://doi.org/10.1109/ICAI52203.2021.9445257
[13] Wawrzyniak, Z.M., Selegrat, M., Hernández, I.G., Dusza, J.J. (2019). Objective EMG signal models comparison for gait diagnostics. Photonics Applications in Astronomy, Communications, Industry, and High-Energy Physics Experiments 2019, 11176: 111762S. https://doi.org/10.1117/12.2536833
[14] Singh, M.S., Pasumarthy, R., Talasila, V. (2019). Time series analysis of surface EMG signal-linear, non linear and chaotic approaches. 2019 Fifth Indian Control Conference (ICC), New Delhi, India, pp. 442-447. https://doi.org/10.1109/INDIANCC.2019.8715550
[15] Jahromi, M.G., Parsaei, H., Zamani, A., Stashuk, D.W. (2018). Cross comparison of motor unit potential features used in EMG signal decomposition. IEEE Transactions on Neural Systems and Rehabilitation Engineering, 26(5): 1017-1025. https://doi.org/10.1109/TNSRE.2018.2817498
[16] Khamis, H., Mohamaddan, S., Komeda, T., Alias, A.A., Tanjong, S.J., Julai, N., Hashim, N.I. (2017). Development of hand grip assistive device control system for old people through electromyography (EMG) signal acquisitions. MATEC Web of Conferences, 87: 02032. https://doi.org/10.1051/matecconf/20178702032
[17] Shyam Prasad, P.M., Swarnkar, R., Hashmi, M.F., Keskar, A.G. (2017). Design and implementation of a speller based on EMG signal. International Journal of Computational Intelligence Systems, 10(1): 266-276. https://dx.doi.org/10.2991/ijcis.2017.10.1.18
[18] Lee, S.S., Jang, J.H., Cho, C.O., Kim, D.J., Moon, G.P., Kim, B., ..., Lee, K.Y. (2017). Endurance capacity of the biceps brachii muscle using the high-to-low ratio between two signal spectral moments of surface EMG signals during isotonic contractions. Journal of Electrical Engineering and Technology, 12(4): 1641-1648. https://doi.org/10.5370/JEET.2017.12.4.1641
[19] Shabani, A., Mahjoob, M.J. (2016). Bio-signal interface for knee rehabilitation robot utilizing EMG signals of thigh muscles. 2016 4th International Conference on Robotics and Mechatronics (ICROM), Tehran, Iran, pp. 228-233. https://doi.org/10.1109/ICRoM.2016.7886851
[20] Johnson, R.E., Kording, K.P., Hargrove, L.J., Sensinger, J.W. (2016). EMG versus torque control of human–machine systems: Equalizing control signal variability does not equalize error or uncertainty. IEEE Transactions on Neural Systems and Rehabilitation Engineering, 25(6): 660-667. https://doi.org/10.1109/TNSRE.2016.2598095
[21] Kurzynski, M., Wolczowski, A. (2019). EMG and MMG signal recognition using ensemble of one-feature classifiers with pruning via clustering method. In 2019 International Conference on Advanced Technologies for Communications (ATC), Hanoi, Vietnam, pp. 38-43. https://doi.org/10.1109/ATC.2019.8924513
[22] Maurya, V.P., Kumar, P., Halder, S. (2019). Optimisation and classification of EMG signal using PSO-ANN. 2019 Devices for Integrated Circuit (DevIC), Kalyani, India, pp. 191-195. https://doi.org/10.1109/DEVIC.2019.8783882
[23] Vasylkiv, Y., Neshati, A., Sakamoto, Y., Gomez, R., Nakamura, K., Irani, P. (2019). Smart home interactions for people with reduced hand mobility using subtle EMG-signal gestures. ITCH, pp. 436-443. https://doi.org/10.3233/978-1-61499-951-5-436
[24] Putra, D.S., Weru, Y.U.W. (2019). Pattern recognition of electromyography (EMG) signal for wrist movement using learning vector quantization (LVQ). IOP Conference Series: Materials Science and Engineering, 506(1): 012020. https://doi.org/10.1088/1757-899x/506/1/012020
[25] Verma, A.R., Singh, Y., Gupta, B. (2018). Adaptive filtering method for EMG signal using bounded range artificial bee colony algorithm. Biomedical Engineering Letters, 8(2): 231-238. https://doi.org/10.1007/s13534-017-0056-x
[26] Makaram, N., Karthick, P.A., Swaminathan, R. (2021). Analysis of dynamics of EMG signal variations in fatiguing contractions of muscles using transition network approach. IEEE Transactions on Instrumentation and Measurement, 70: 1-8. https://doi.org/10.1109/TIM.2021.3063777
[27] Ma, S., Lv, B., Lin, C., Sheng, X., Zhu, X. (2020). EMG signal filtering based on variational mode decomposition and sub-band thresholding. IEEE Journal of Biomedical and Health Informatics, 25(1): 47-58. https://doi.org/10.1109/JBHI.2020.2987528