Muhammet Baykara* | Awf Abdulrahman
© 2021 IIETA. This article is published by IIETA and is licensed under the CC BY 4.0 license (http://creativecommons.org/licenses/by/4.0/).
OPEN ACCESS
Epilepsy is one of the most common chronic disorder which negatively affects the patients' life. The functionality of the brain can be obtained from brain signals and it is vital to analyze and examine the brain signals in seizure detection processes. In this study, we performed machine learning-based and signal processing methods to detect epileptic signals. To do that, we examined three different EEG signals (healthy, ictal, and interictal) with two different classes (healthy ones and epileptic ones). Our proposed method consists of three stages which are preprocessing, feature extraction, and classification. In the preprocessing phase, EEG signals normalized to scale all samples into [0,1] range. After Stockwell Transform was applied and chaotic features and Parseval's Energy collected from each EEG signal. In the last part, EEG signals were classified with ELM (Extreme Learning Machines) with different parameters. Our study shows the best classification accuracy obtained from the Sigmoid activation function with the number of 100 hidden neurons. The highlights of this study are: Stockwell Transform is used; Entropy values are selected based on the adaptive process. Threshold values are determined according to the error rates; ELM classifier algorithm is applied.
adaptive feature, EEG, extreme learning machines, pattern recognition, seizure detection
Epilepsy is a chronic disorder and occurs in the brain which affects people of all ages. Nearly 50 million people all around the suffer from that disease [1]. Epilepsy can be defined as improbable, recurrent, and abnormal neural activity that arises in the cortex [2]. During epileptic seizures, normal brain signals become more unstable and negatively cause patient life. It can be seen in two ways: partial which affects the only part of a body or generalized which influences the entire body [3].
People who have epileptic diseases generally suffer from not only physical conditions but also from psychological statuses comprising depression and anxiety [2]. Epilepsy can be treated in different ways including, operation, anti-epileptic drugs (AED), and Vargus Nerve Stimulator (VNS). AED treatment is affordable and easy since drugs are inexpensive and can be applied in daily medication. It is typically applied in low and middle-income countries and nearly 70% of patients are treated this way [4]. Yet, almost 25% of patients do not respond well to any treatment and seizures cannot be controlled [5]. Because of that developing a better way to analyze the brain signals and treatment is essential.
Electroencephalography (EEG) is generally used to monitor and track brain activity which includes much valuable information about epilepsy. To predict epileptic seizures before and diagnose EEG is a vital procedure [6, 7]. EEG is painless, noninvasive, and cost-efficient and nowadays it can be collected with wearable and portable devices.
EEG signals collected from epileptic patients include two states of abnormal activities called interictal (signals between epileptic seizure) and ictal (epileptic seizure). Figure 1 represents the two states of these signals, where, Ictal signals are the signals that express the onset of epilepsy. At this stage, the epileptic seizure started and continues. Interictal signals are the state before the epileptic seizure begins. At this stage, the epileptic seizure has not yet begun, but the onset of the seizure will occur soon. To detect and predict epilepsy earlier, it is essential to classify the ictal, interictal, and normal signals. EEG signals can be inspected with different techniques. It can be analyzed and examined by experienced neuroscientists to detect epileptic parts of the brain and its type. Although epilepsy can be predicted with this method yet, examining the signal manually is expensive and time-consuming [7, 8]. Besides neuroscientists have different ways to examine thus signals can be evaluated with different inferences. As a result, a computer-based application is needed.
In any other pattern recognition applications selecting and performing feature extraction methods is important for epilepsy detection. There are many ways to create feature vectors including time domain [9], frequency domain [10, 11], energy distribution [12], wavelet-based features [13], and information measurement and chaotic features like entropies [14]. In this study, we applied Norm Entropy, Shannon Entropy, Logarithmic Energy Entropy, Sure Entropy, Threshold Entropy, Multiscale Entropy, Sample Entropy, and Parseval’s Energy to extract features and determine epilepsy earlier including normal, interictal, and ictal signals. We selected these methods to extract features from EEG signals, for one reason that these methods differ from the methods applied to the Bonn data set in the literature.
Figure 1. Ictal and interictal EEG sample
The novelties of this study are ordered as below.
The rest of the paper organizes as follows. In Section 2, we mentioned EEG-based epileptic studies including feature extraction and classifying techniques. Also, we provided the performance and accuracies of discrimination as possible. In Section 3, the dataset used in this study is explained. Their technical information is also given. After we explained the feature extraction methods detailed and classification algorithm which is the Extreme Learning Machine (ELM). In Section 4, we provided the application performed in this study.
In the last section, the classification accuracies were given with a different number of parameters and the results were compared with other studies. The performance of the system is designed based on accuracy, specificity, and sensitivity.
In the study [15], a new approach was proposed to extract features from symplectic geometry decomposition-based features, to detect epileptic seizures from EEG signals. The team adopted simplified eigenvalues obtained from symplectic geometry decomposition as inputs for the Support Vector Machine (SVM) algorithm. These approaches were applied to two reliable EEG datasets (CHB-MIT, and Bonn). The study achieved more than 99.17% performance accuracy for the Bonn data set and 99.620% for the CHB-MIT data set. The study of Akyol [16] proposed a model based on a stacking ensemble approach to detect epileptic seizures, in addition to the DNN model. The Bonn data set was used to measure the efficiency of the proposed model and the deep neural networks model. The proposed model had an average accuracy of 97.17%, and a mean sensitivity of 93.11%, surpassed by the DNN model, which achieved a mean accuracy of 93.25% and a sensitivity of 76.71%. The study of Zhao et al. [17] proposed a one-dimensional deep neural network consisting of three convolutional blocks and three interconnected layers to detect epileptic seizures. This method was tested on the Bonn data set. The proposed method achieved a classification accuracy of 97.63% ∼ 99.52% in binary classification, 96.73% ∼ 98.06% in triple classification, and 93.55% in complex classification. The study of Liu et al. [18] suggested a new approach to detecting epileptic seizures. This approach is based on a combination of Stockwell transform and deep convolutional neural networks (CNN). Initially, they filtered the EEG data obtained from the Epilepsy Center at the University Hospital of Freiburg, Germany, using Discrete wavelet transform with a Db4 wavelet. Then, they applied the Stockwell transform method to obtain a temporal frequency representation of each EEG. Then they used 15 hidden layers of deep convolutional neural networks (CNNs) with false detection rate (FDR) and receiver operating characteristic (ROC) curves. The study had a sensitivity for each section of 97.01%. The study of Geng et al. [19] provided a good method for detecting epileptic seizures, by combining the Stockwell transform with bidirectional long short-term memory (BiLSTM), applied to an EEG dataset collected at the Epilepsy Center at the University Hospital Freiburg, Germany. The study was carried out in three stages: in the first stage, S-convert was applied to the EEG signals, to obtain time-frequency blocks that would be used as inputs in the second stage. In the second stage, time-frequency blocks were introduced into BiLSTM to obtain and classify the feature. In the third stage a moving average filter, threshold judgment, multichannel fusion, and collar technique were used to improve the results obtained. The study had a sensitivity of 98.09% and a specificity of 98.69%. The study of Tzimourta et al. [20] presented a methodology for detecting epileptic seizures based on a discrete wavelet transform (DWT) of five levels and a random forest classifier. Five features using DWT were extracted from each dataset from the University of Bonn dataset and the University Hospital Freiburg database. Then, they applied the random forest classifier to classify the data into ictal and interictal data. The presented methodology had an accuracy of over 95% for both datasets. In the study of Fan et al. [21], an algorithm was proposed to detect epileptic seizures early based on automatic estimation of average synaptic gains, by combining clinical data with a neural mass model. In this study, three indicators associated with excitation/inhibition balance were counted as indicators for early seizure detection: AE / B, A / G, and AE / (B + G). This study was applied to samples of 23 patients suffering from different epileptic seizures (Frontal Lobe Epilepsy (FLE), Temporal Lobe Epilepsy (TLE), and Fronto-Temporal Lobe Epilepsy (FTLE)). This study achieved the best sensitivity performance using the AE / (B + G) index applied to the data of Temporal Lobe Epilepsy patients, where they obtained a sensitivity rate of 92.92%. Time-frequency analysis methods are provided to classify the EEG signals for seizure detection and prediction in the study of Alickovic et al. [22]. EEG databased were obtained from the Epilepsy Center of the University Hospital of Freiburg and Physionet CHB-MIT to compare their method in other databases. They evaluated two classes to estimate called interictal and pre-ictal signals. Their study includes 4 different parts. In the first part, Multiscale Principal Component Analysis (MPCA) was applied to denoise the signals and remove the artifacts. After that, Empirical Mode Decomposition (EMD), Discrete Wavelet Transform (DWT), and Wavelet Packet Decomposition (WPD) were applied into 4 levels to collect sub-signals. After the feature extraction phase, statistical methods were evaluated including, the mean value of coefficients, the average power of coefficients, the standard deviation of coefficients, the ratio of absolute mean values of coefficients, skewness, and kurtosis of each coefficient. In the last part, they used Random Forest (RF), Support Vector Machine (SVM), Multilayer Perceptron (MLP), and K-Nearest Neighbor (k-NN) algorithms to classify the signals based on their states. They compared both databases based on their time-frequency analysis and classification algorithms. At the end of the study, they observed the accuracy at 100% for both EEG databases.
3.1 EEG database
In this study, we applied a publicly available EEG database [23]. The database contains five various datasets which include 2 healthy EEG datasets, 2 interictal EEG datasets, and 1 ictal EEG dataset and indicated as Z, O, N, F, and S. Table 1 shows the information about the datasets.
Table 1. Information about EEG dataset used in this work
|
EEG Dataset Name |
Containing Signals |
Phase |
Number of Signals |
|
Z |
Healthy Signals (Eyes-Open) |
Eyes-Open |
100 |
|
O |
Healthy Signals (Eyes-Closed) |
Eyes-Closed |
100 |
|
N |
Seizure Free Signals (Hippocampal Zone) |
Hippocampal Zone |
100 |
|
F |
Seizure Free Signals (Epileptic Zone) |
Epileptic Zone |
100 |
|
S |
Epileptic Signals |
Seizure |
100 |
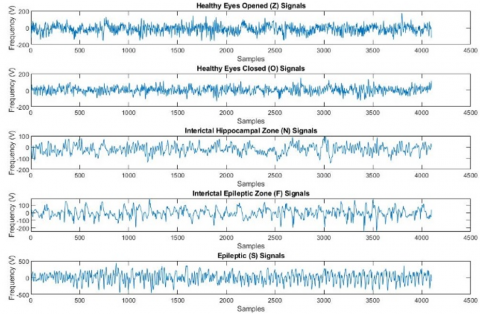
Figure 2. Each type of EEG signal
Figure 3. Block diagram of the proposed method
As shown in Table 1, the dataset is consists of five groups, each dataset contains 100 single-channel EEG signals of 23.6 seconds duration, each of these segments was selected and cropped from multi-channel EEG signals after visual inspection of the artifacts, for example, the data sets Z, and O, are taken from EEG signals performed on five healthy volunteers (seizures-free), the data set Z consists of signals with eyes open, and the data set O is consists of signals with eyes closed. The other three datasets originated from the EEG archive for preoperative diagnosis, as the N and F data sets consist of seizure-free signals collected from the hippocampus and epileptic regions respectively. The last dataset includes epilepsy signals called the S data set. Each signal contains 4,097 samples and the sampling frequency is 173.6. In Figure 2, each type of EEG signaling from this database was shown [24, 25].
3.2 Feature extraction process
In this study, we applied the Stockwell Transform to collect key features from EEG signals. After transforming Parseval’s Energy and chaotic features were performed which are the norm, threshold, Shannon, logarithmic energy, sure, multiscale, and sample entropy. In this section, we explained the feature extraction methods and their parameters if any. Figure 3 shows the workflow of this study.
3.2.1 Stockwell transform
S-Transform is considered as a time-frequency decomposition, and it is closely related to the continuous wavelet transform using the mother wave. This method has been used with success in many applications such as seismic recordings, ground vibrations, gravitational waves, and medical signals, such as EEG, and laser Doppler flow measurement [26]. S-Transform is calculated using Equations shown below [27]:
$W(\tau, d)=h(t) w(t-\tau, d) d t$ (1)
where, d shows the width of the wavelet which is used to calculate resolution. Also, $W(\tau, d)$ represents the mother wavelet in Eq. (1).
$S(\tau, f)=e^{i 2 \pi f t} W(\tau, d)$ (2)
In Eq. (2), $e^{i 2 \pi f \tau}$ identifies the phase factor to calculate the function of the S-Transform by multiplying the mother wavelet.
The width of the wavelet (d) needs to be transformed into a frequency and the S-Transform can be calculated in Eq. (3).
$S(\tau, f)=\int_{-\infty}^{\infty} H(\alpha+f) e^{-\frac{2 \pi^{2}-\alpha^{2}}{f^{2}}} e^{i 2 \pi \alpha \pi} d \alpha$ (3)
(H) represents the Fourier transform while (f) shows the frequency of a signal, and $f \neq 0$. Detailed information about S-Transform can be found [27].
3.2.2 Wavelet entropies
Wavelet-based entropies give information-related attributes of a signal. Entropy is generally applied in non-stationary signals to measure the layout of the signals. In our work, we performed norm entropy, sure entropy, threshold entropy, Shannon entropy, and logarithmic entropy as wavelet entropies and their equations were given below:
a) Norm Entropy (NE)
$E(x)=\sum_{i}\left|x_{i}\right|^{p}$ (4)
p is the power of entropy and generally $p \geq 1$.
b) Sure Entropy (SE)
The sure entropy is a form of a wave that is obtained from Discrete wavelet transform (DWT). It is calculated using Eq. (5) [28]:
$E(x)=n-\left\{\left|x_{i}\right| \leq p\right\}+\sum_{i} \min \left(x_{i}^{2}, p^{2}\right)$ (5)
where, the E is a real number, p is the threshold value, and generally p≥0 and ( $x_{i}^{2}$) is the waveform for the terminal node signals. E is a positive threshold value and must be ≥ 2 [28].
c) Threshold Entropy (ThE)
Threshold Entropy is a method for calculating the number of moments in time when the signal is greater than the p threshold. This method is calculated using Eq. (6) [29].
$E\left(x_{i}\right)=1$ if $\left|x_{i}\right| \geq p$, else 0 (6)
p is the threshold value and generally $p \geq 0$.
d) Shannon Entropy (SHE)
Shannon entropy is an official measure of entropy determined by Claude Shannon. This scale is calculated with Eq. (7) [30]:
$E(x)=-\sum_{i} x_{i}^{2} \log \left(x_{i}^{2}\right)$ (7)
where, $x_{i}^{2}$ is the probability of occurrence of an event. X that can take values {x1...xn} [30].
e) Logarithmic Energy Entropy (LogE)
To compute logarithmic energy entropy, the entropy-based wavelet decomposition provided by Coifman and Wickerhauser is used, where the entropy tells us how much information the signal carries and how random it is. The logarithmic energy entropy can be calculated using Eq. (8) [31]:
$E(x)=\sum_{i} \log \left(x_{i}^{2}\right)$ (8)
f) Multiscale Entropy (MSE)
Since there is a reciprocal relationship between entropy and scale, the multiscale entropy (MSE) method applies to both physiological and physical signals of finite length. If we had a discrete one-dimensional time series (X1, ......, XN), then we would create a consecutive time series (y^((r))), corresponding to the scale factor r. Eq. (9) is applied to calculate each element in the time-scaled series [32]:
$y_{j}^{(r)}=\frac{1}{r} \sum_{i=(j-1)_{r+1}}^{j_{r}} x_{i}, 1 \leq j \leq N / r$ (9)
According to Eq. (9), $x_{i}$ represents the time series which is transformed into large-scaled time series $y_{j}^{(r)}$ by applying scale factor r [32].
g) Sample Entropy (SampE)
Sample entropy calculation requires five different steps [33]:
$t_{m}(i)=\left\{t_{i+1}, t_{i+2}, t_{i+3}, \ldots \ldots, t_{i+m+-1}\right\}, 1$
$\leq N-m+1$ (10)
The m value represents the dimension. In the first step of Sample entropy calculation, time-series t(i) is rearranged by the formula given in Eq. (10).
In the second step, maximum distance is found between two dimensions and the calculation process has given in Eq. (11).
$D\left[t_{m}(i), t_{m}(k)\right]=\max \left(\left|t_{m}(i+w)-t_{m}(k+w)\right|\right)$ (11)
D shows the distance between two different time series ( $t_{m}(i), t_{m}(k)$) with dimension m.
A new time-series $B^{m}(r)$ is calculated based on Eq. (11) since $t_{m}(i), t_{m}(k)$ are used as a summation vector and tolerance respectively for new time series. Eq. (12) and Eq. (13) show the formula.
$B_{i}^{m}(r)=\frac{1}{N-m-1} B_{i}$ (12)
$B_{i}^{m}(r)=\frac{1}{N-m} \sum_{i=1}^{N-m} B_{i}^{m}(r)$ (13)
The new dimension is calculated as m=m+1 and all the process repeated from Equation 10 to Eq. (13) for a new time series $Z^{m}(r)$.
$Z^{m}(r)=\frac{1}{N-m} \sum_{i=1}^{N-m} Z_{i}^{m}(r)$ (14)
Lastly, sample entropy is calculated as follows:
$\operatorname{SampEn}(m, r, N)=-\ln \frac{z^{m}(r)}{B^{m}(r)}$ (15)
3.2.3 Parseval’s Energy (PE)
Parseval's theory is considered a useful theory for evaluating the energy of the signal without knowing its time domain, as this theory refers to the energy of the signal in terms of the Fourier transform. This theory can be calculated with Eq. (16) [34]:
$\operatorname{ParEng}=\frac{\int_{-\infty}^{\infty}|f|^{2}}{l e n g t h(f)}$ (16)
(f) represents the Fourier Transform of a signal.
In this study, different methods were used from the methods used in the literature, and the methods that were used in this study proved that they can be used with EEG signals that have the advantage of being unstable signals. Also, the classifier Extreme Learning Machines (ELM) that was used in this study is a fast-growing classifier of feedforward neural network with one hidden layer, which has the advantage of completing the training process once without the need for repetition (backpropagation).
In our study, we applied ELM (Extreme Learning Machines) to classify the healthy, interictal, and ictal signals. To do that, firstly we performed S-Transform for each epileptic data (healthy, ictal, and interictal) to collect frequency-based signals. Later, we collected 8 different features mentioned above from each frequency. We specified the threshold values for wavelet entropies by applying adaptive learning and determined the best p values based on errors. Lastly, in the feature extraction phase, features were normalized to scale variables within the range of [0,1] to prepare for the classification process. After the feature extraction process we collected, 86x8x400 feature vector for all signals from all datasets. 86 refers to the frequency values which were collected from S-Transform and 8 means feature extraction methods mentioned in the previous section and lastly, 400 specifies the signals including healthy (O-Z), interictal (F), and epileptic (S) signals. We determined the training and testing data by randomly selecting the 100 signals from healthy ones (50 from healthy eyes closed (O) and 50 from healthy eyes opened (Z)) for training and testing and collected an 86x801 dimensional matrix. 86 refers to frequency values and 801 represents the features (100 signals * 8 features for each) and 1 means outputs (1 for healthy signals). The same approach was designed with epileptic and interictal signals also. 100 signals were collected randomly from interictal (F-epileptic zone) and ictal (S) and 86x801 matrix obtained for testing and training. In that case, the output is determined as ‘0’. To classify the EEG signals, we applied ELM and observed the results with different parameters. We used sinus, sigmoid, radial basis, and hardlim as an activation function with a different number of hidden neurons (10, 50, 100, 500, 1000), and the best classification performance was measured with 10-fold cross-validation. Besides, we evaluated our study by finding Accuracy (AC), Sensitivity (SN), and Specificity (SP) values. The block diagram has given in Figure 3.
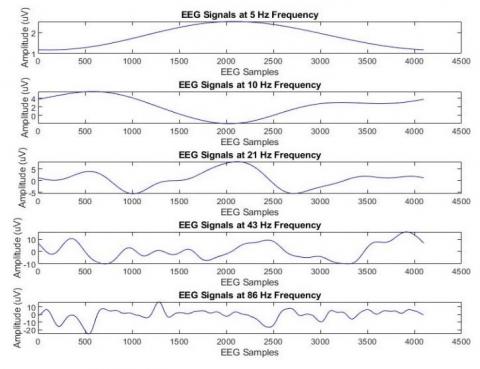
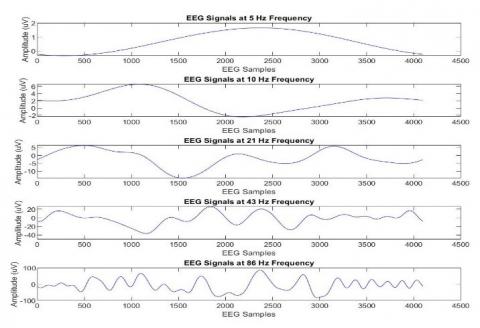
EEG signals were classified with different parameters by ELM. Healthy, interictal, and ictal signals were applied, and their classification accuracy, sensitivity, and specificity were measured. Adaptive parameters were applied for entropies and parameters of ELM were compared. The classification procedure includes three parts: Firstly EEG signals were decomposed by the S-transform method. We applied the minimum frequency parameter as 1 and the maximum frequency parameter as 86 which is half of the sampling rate (173.6) of EEG signals. In this stage, we obtained five frequencies (5 Hz frequency, 10 Hz frequency, 21 Hz frequency, 43 Hz frequency, and 86 Hz frequency), as in Figures 4-7, where S-Transformed EEG signals based on different frequencies were given according to their datasets. After the decomposition process, we applied chaotic features and Parseval’s Energy features on each frequency of a signal. To determine the parameters for entropies (Norm, Sure, and Threshold Entropy) adaptive transaction applied and the best threshold parameters determined based on the error rates, where the best parameters for each entropy are 3.45, 0.84, and 0.84 for Norm entropy, Sure entropy, and Threshold Entropy respectively. Lastly, collected features were fed to ELM classifiers with different classification parameters and a different number of hidden neurons. In this stage, We used five different numbers of hidden neurons (10, 50, 100, 500, 1000 hidden neurons), with four different activation function parameters (Sinus, Sigmoid, Radbasis, and Hardlim), And we used 10-fold cross-validation to obtain classification accuracy. Besides, sensitivity and specificity measures were obtained.
From the results shown in Table 2, it can be observed that the best classification performance (90%) was obtained from the Sigmoid activation function on 100 number hidden neurons, and the worst classification performance (50%) was obtained from the Sinus activation function on 100 number of hidden neurons. Also, we observed that the best activation function is Sigmoid, as it achieved performance accuracy between 65% and 90% with different numbers of hidden neurons. Table 3 shows the optimal threshold values for norm entropy, sure entropy, and threshold.
Table 2. Classification results with different ELM parameters
|
Classifier |
Number of Hidden Neurons |
||||
|
10 |
50 |
100 |
500 |
1000 |
|
|
ELM (Sinus) |
53% |
54% |
50% |
56% |
50% |
|
ELM (Sigmoid) |
67% |
76% |
90% |
89% |
65% |
|
ELM (Radbasis) |
54% |
64% |
67% |
66% |
54% |
|
ELM (Hardlim) |
62% |
61% |
76% |
88% |
87% |
Figure 4. S-transformed healthy (eyes-opened) EEG signals with different frequencies
Figure 5. S-transformed healthy (eyes-closed) EEG signals with different frequencies
Figure 6. S-transformed interictal (epileptic zone) EEG signals with different frequencies
Figure 7. S-transformed epileptic EEG signals with different frequencies
Table 3. The optimal threshold values for norm entropy, sure entropy, and threshold entropy
|
Classifier |
NE Optimal Threshold Value |
SE Optimal Threshold Value |
The Optimal Threshold Value |
|
ELM (Sinus) |
3.45 |
0.84 |
0.84 |
|
ELM (Sigmoid) |
3.45 |
0.84 |
0.84 |
|
ELM (Radbasis) |
3.45 |
0.84 |
0.84 |
|
ELM (Hardlim) |
3.45 |
0.84 |
0.84 |
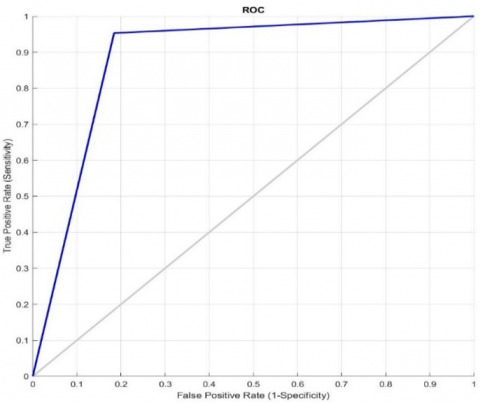
As can be seen in Table 2, different activation functions gave different results. The average accuracy for the Sinus activation function was found as 53% which is the worst performance in the proposed method. Radial basis function increased the average classification accuracy a bit which has found 61%. Sigmoid and Hardlim functions performed nearly the same average accuracy which is 77% and 75% respectively. Best performance measured from Sigmoid function on 100 number of hidden neurons thus we performed ROC curve for that parameter in Figure 8.
Figure 8. ROC for the proposed classifier
Besides, sensitivity and specificity values have been measured. Calculation of sensitivity and specificity has given below:
Sensitivity (SN) = True Positive / (True Positive + False Negative)
Specificity (SP) = True Negative / (True Negative + False Positive)
The results were shown in Table 4.
Table 4. Sensitivity, specificity, and accuracy results
|
Sensitivity (SN) |
Specificity (SP) |
Accuracy (AC) |
|
95% |
82% |
90% |
There are many other feature extraction and classification methods were suggested for seizure detection. Table 5 shows the comparison of the studies mention earlier in this article between applied methods and their classification results including sensitivity and specificity if any.
Table 5. A comparison of the feature extraction techniques and classification results applied by the proposed method and other methods
|
Ref. |
Feature Extraction Method |
Classifier |
Dataset |
SN (%) |
SP (%) |
ACC (%) |
|
[15] |
symplectic geometry decomposition-based features |
SVM |
CHB-MIT |
97.1 |
99.7 |
99.6 |
|
[16] |
Min-max normalization |
DNN, SEA-based DNN |
Interictal, and ictal |
SEA: 93.1 DNN: 76.71 |
SEA: 98.18DNN: 97.26 |
SEA: 97.2 DNN: 93.25 |
|
[17] |
Tunable-Q wavelet transform, Kraskov entropy |
LS-SVM |
Interictal, and ictal |
97 |
99 |
97.75 |
|
[18] |
Multiscale principal component analysis, wavelet packet decomposition, statistical features |
SVM |
Healthy, Interictal, and Ictal |
99.6 |
99.8 |
99.7 |
|
[20] |
Fractional linear prediction, error energy, signal energy |
RBF-SVM |
Interictal, and ictal |
96 |
95 |
95.33 |
|
[21] |
Multifractal detrended fluctuation analysis, multifractal spectral parameters |
SVM |
Healthy, Interictal, and Ictal |
- |
99.7 |
99.6 |
|
[35] |
Local neighbor descriptive pattern, one-dimensional local gradient pattern |
ANN |
Healthy, Interictal, and Ictal |
- |
- |
98.22 |
|
[36] |
Weighted permutation entropy |
SVM |
Healthy, Interictal, and Ictal |
- |
- |
97.5 |
|
[37] |
Emprical mode decomposition, statistical features |
ANN |
Healthy, Interictal, and Ictal |
90 |
93 |
97.7 |
|
[38] |
CEEMDAN |
AdaBoost |
Ictal, inter-ictal, and healthy |
97.6 |
97.3 |
97.6 |
|
This work |
Chaotic features, wavelet entropies, Parseval’s energy |
ELM |
Healthy, Interictal, and Ictal |
95 |
82 |
90 |
In this study, we proposed a method based on an ELM classifier to discriminate epileptic signals. To do that we used publicly available databased which includes five different datasets named Z, O, N, F, and S based on their type. Firstly we applied S-Transform to decompose signals into their frequencies which is 86 Hz. in our work. After we performed wavelet entropy and Parseval’s Energy to collect key features from each frequency of signals. Lastly, we used ELM to classify the interictal, ictal, and epileptic signals by performing different parameters on ELM. We observed that the best average accuracy (90%) calculated from the Sigmoid activation function with 100 hidden neurons. In this study, methods based on machine learning were used to process brain signals for patients with epileptic seizures. This study was conducted in three stages. In the first stage, the S-transform method was used in the pre-processing of EEG signals. The EEG signals were taken from the University of Bonn dataset. In the second stage, features were extracted by applying several techniques, including Norm Entropy, Shannon Entropy, Logarithmic Energy Entropy, Sure Entropy, Threshold Entropy, Multiscale Entropy, Sample Entropy, and Parseval's Energy. In the third and final stage, epileptic seizures (healthy and epileptic ones) were classified using the Extreme Learning Machines (ELM) classifier with different parameters. Our study obtained a classification accuracy of 90% and a sensitivity of 95%. In future studies, it is planned to use convolutional neural networks together with S modulation. Thus, it is thought that more successful results will be obtained.
[1] World Health Organization (WHO). Epilepsy, online link: https://www.who.int/news-room/fact-sheets/detail/epilepsy, accessed on 23 Dec. 2020.
[2] Acharya, U.R., Fujita, H., Sudarshan, V.K., Bhat, S., Koh, J.E. (2015). Application of entropies for automated diagnosis of epilepsy using EEG signals: A review. Knowledge-Based Systems, 88: 85-96. https://doi.org/10.1016/j.knosys.2015.08.004
[3] James, C.J. (1997). Detection of epileptiform activity in the electroencephalogram using artificial neural networks. University of Canterbury. Electrical and Electronic Engineering. http://dx.doi.org/10.26021/2767
[4] Alakus, T.B., Turkoglu, I. (2017). Detection of pre-epileptic seizure by using wavelet packet decomposition and artifical neural networks. In 2017 10th International Conference on Electrical and Electronics Engineering (ELECO), pp. 511-515.
[5] Daibo, M. (2017). Toroidal vector-potential transformer. In 2017 Eleventh International Conference on Sensing Technology (ICST), pp. 1-4. https://doi.org/10.1109/ICSensT.2017.8304422
[6] Jansen, B.H., Cheng, W.K. (1988). Structural EEG analysis: an explorative study. International Journal of Bio-Medical Computing, 23(3-4): 221-237. https://doi.org/10.1016/0020-7101(88)90016-5
[7] Sanei, S., Chambers, J.A. (2013). EEG Signal Processing. John Wiley & Sons.
[8] Shoeb, A.H., Guttag, J.V. (2010). Application of machine learning to epileptic seizure detection. In Proceedings of the 27th International Conference on Machine Learning (ICML-10), pp. 975-982.
[9] Minasyan, G.R., Chatten, J.B., Chatten, M.J., Harner, R. N. (2010). Patient-specific early seizure detection from scalp EEG. Journal of clinical neurophysiology: official publication of the American Electroencephalographic Society, 27(3): 163-178. https://doi.org/10.1097/WNP.0b013e3181e0a9b6
[10] Polat, K., Güneş, S. (2007). Classification of epileptiform EEG using a hybrid system based on decision tree classifier and fast Fourier transform. Applied Mathematics and Computation, 187(2): 1017-1026. https://doi.org/10.1016/j.amc.2006.09.022
[11] Subasi, A. (2007). EEG signal classification using wavelet feature extraction and a mixture of expert model. Expert Systems with Applications, 32(4): 1084-1093. https://doi.org/10.1016/j.eswa.2006.02.005
[12] Philipose, L.E., Alphs, H., Prabhakaran, V., Hillis, A.E. (2007). Testing conclusions from functional imaging of working memory with data from acute stroke. Behavioural Neurology, 18(1): 37-43. https://doi.org/10.1155/2007/396946
[13] Güler, I., Übeyli, E.D. (2005). Adaptive neuro-fuzzy inference system for classification of EEG signals using wavelet coefficients. Journal of Neuroscience Methods, 148(2): 113-121. https://doi.org/10.1016/j.jneumeth.2005.04.013
[14] Yuan, Q., Zhou, W., Li, S., Cai, D. (2011). Epileptic EEG classification based on extreme learning machine and nonlinear features. Epilepsy Research, 96(1-2): 29-38. https://doi.org/10.1016/j.eplepsyres.2011.04.013
[15] Jiang, Y., Chen, W., Li, M. (2020). Symplectic geometry decomposition-based features for automatic epileptic seizure detection. Computers in Biology and Medicine, 116: 103549. https://doi.org/10.1016/j.compbiomed.2019.103549
[16] Akyol, K. (2020). Stacking ensemble based deep neural networks modeling for effective epileptic seizure detection. Expert Systems with Applications, 148: 113239. https://doi.org/10.1016/j.eswa.2020.113239
[17] Zhao, W., Zhao, W., Wang, W., Jiang, X., Zhang, X., Peng, Y. (2020). A novel deep neural network for robust detection of Seizures using EEG signals. Computational and Mathematical Methods in Medicine, 2020: 1-9. https://doi.org/10.1155/2020/9689821
[18] Liu, G., Zhou, W., Geng, M. (2020). Automatic seizure detection based on S-Transform and deep convolutional neural network. International Journal of Neural Systems, 30(4): 1950024. https://doi.org/10.1142/S0129065719500242
[19] Geng, M., Zhou, W., Liu, G., Li, C., Zhang, Y. (2020). Epileptic seizure detection based on stockwell transform and bidirectional long short-term memory. IEEE Transactions on Neural Systems and Rehabilitation Engineering, 28(3): 573-580. https://doi.org/10.1109/TNSRE.2020.2966290
[20] Tzimourta, K.D., Tzallas, A.T., Giannakeas, N., Astrakas, L.G., Tsalikakis, D.G., Angelidis, P., Tsipouras, M.G. (2019). A robust methodology for classification of epileptic seizures in EEG signals. Health and Technology, 9(2): 135-142. https://doi.org/10.1007/s12553-018-0265-z
[21] Fan, X., Gaspard, N., Legros, B., Lucchetti, F., Ercek, R., Nonclercq, A. (2019). Automated epileptic seizure detection based on break of excitation/inhibition balance. Computers in Biology and Medicine, 107: 30-38. https://doi.org/10.1016/j.compbiomed.2019.02.005
[22] Alickovic, E., Kevric, J., Subasi, A. (2018). Performance evaluation of empirical mode decomposition, discrete wavelet transform, and wavelet packed decomposition for automated epileptic seizure detection and prediction. Biomedical Signal Processing and Control, 39: 94-102. https://doi.org/10.1016/j.bspc.2017.07.022
[23] Tatum, W.O., Rubboli, G., Kaplan, P. W., Mirsatari, S. M., Radhakrishnan, K., Gloss, D. (2018). Clinical utility of EEG in diagnosing and monitoring epilepsy in adults. Clinical Neurophysiology, 129(5): 1056-1082. https://doi.org/10.1016/j.clinph.2018.01.019
[24] Gautama, T., Mandic, D.P., Van Hulle, M.M. (2003). Indications of nonlinear structures in brain electrical activity. Physical Review E, 67(4): 046204. https://doi.org/10.1103/PhysRevE.67.046204
[25] Andrzejak, R.G., Lehnertz, K., Mormann, F., Rieke, C., David, P., Elger, C.E. (2001). Indications of nonlinear deterministic and finite-dimensional structures in time series of brain electrical activity: Dependence on recording region and brain state. Physical Review E, 64(6): 061907. https://doi.org/10.1103/PhysRevE.64.061907
[26] Drabycz, S., Stockwell, R.G., Mitchell, J.R. (2009). Image texture characterization using the discrete orthonormal S-transform. Journal of Digital Imaging, 22(6): 696-708. https://doi.org/10.1007/s10278-008-9138-8
[27] Stockwell, R.G., Mansinha, L., Lowe, R.P. (1996). Localization of the complex spectrum: The S transform. IEEE Transactions on Signal Processing, 44(4): 998-1001. https://doi.org/10.1109/78.492555
[28] Avci, D. (2009). An expert system for speaker identification using adaptive wavelet sure entropy. Expert Systems with Applications, 36(3): 6295-6300. https://doi.org/10.1016/j.eswa.2008.07.012
[29] Hosseini, S.A., Naghibi-Sistani, M.B. (2011). Emotion recognition method using entropy analysis of EEG signals. International Journal of Image, Graphics and Signal Processing, 3(5): 30-36. https://doi.org/10.5815/ijigsp.2011.05.05
[30] Maszczyk, T., Duch, W. (2008). Comparison of Shannon, Renyi and Tsallis entropy used in decision trees. In International Conference on Artificial Intelligence and Soft Computing, pp. 643-651. https://doi.org/10.1007/978-3-540-69731-2_62
[31] Brkovic, A., Gajic, D., Gligorijevic, J., Savic-Gajic, I., Georgieva, O., Gennaro, S.D. (2015). Early fault detection and diagnosis in bearings based on logarithmic energy entropy and statistical pattern recognition. In 2nd International Electronic Conference on Entropy and Its Applications, pp. 1-14.
[32] Costa, M., Goldberger, A.L., Peng, C.K. (2005). Multiscale entropy analysis of biological signals. Physical Review E, 71(2): 021906. https://doi.org/10.1103/PhysRevE.71.021906
[33] Song, Y., Liò, P. (2010). A new approach for epileptic seizure detection: Sample entropy based feature extraction and extreme learning machine. Journal of Biomedical Science and Engineering, 3(6): 556. https://doi.org/10.4236/jbise.2010.36078
[34] Boonnak, N., Kamonsantiroj, S., Pipanmaekaporn, L. (2015). Wavelet transform enhancement for drowsiness classification in EEG records using energy coefficient distribution and neural network. International Journal of Machine Learning and Computing, 5(4): 288-293. https://doi.org/10.7763/IJMLC.2015.V5.522
[35] Yu, Z., Zhou, W., Zhang, F., Xu, F., Yuan, S., Leng, Y., Li, Y., Yuan, Q. (2019). Automatic seizure detection based on kernel robust probabilistic collaborative representation. Medical & Biological Engineering & Computing, 57(1): 205-219. https://doi.org/10.1007/s11517-018-1881-5
[36] Sikdar, D., Roy, R., Mahadevappa, M. (2018). Epilepsy and seizure characterisation by multifractal analysis of EEG subbands. Biomedical Signal Processing and Control, 41: 264-270. https://doi.org/10.1016/j.bspc.2017.12.006
[37] Patidar, S., Panigrahi, T. (2017). Detection of epileptic seizure using Kraskov entropy applied on tunable-Q wavelet transform of EEG signals. Biomedical Signal Processing and Control, 34: 74-80. https://doi.org/10.1016/j.bspc.2017.01.001
[38] Hassan, A.R., Subasi, A., Zhang, Y. (2020). Epilepsy seizure detection using complete ensemble empirical mode decomposition with adaptive noise. Knowledge-Based Systems, 191: 105333. https://doi.org/10.1016/j.knosys.2019.105333