Erdal Özbay* | Ahmet Çınar | Feyza Altunbey Özbay
© 2021 IIETA. This article is published by IIETA and is licensed under the CC BY 4.0 license (http://creativecommons.org/licenses/by/4.0/).
OPEN ACCESS
In this paper, we propose a method for classification 3D human activities using the complementarity of CNNs, LSTMs, and DNNs by combining them into one unified architecture called CLDNN. Our approach is based on the prediction of 3D Zernike Moments of some relevant joints of the human body through Kinect using the Kinect Activity Recognition Dataset. KARD includes 18 activities and each activity consists of real-world point clouds that have been carried out 3 times by 10 different subjects. We introduce the potential for the 3D Zernike Moment feature extraction approach via a 3D point cloud for human activity classification, and the ability to be trained and generalized independently from datasets using the Deep Learning methods. The experimental results obtained on datasets with the proposed system has correctly classified 96.1% of the activities. CLDNN has been shown to provide a 5% relative improvement over LSTM, the strongest of the three individual models.
classification, CNN, DNN, LSTM, 3D human activity, 3D Zernike moment
In this study, a novel technique is proposed to the classification of 3D Zernike Moments (ZM) obtained from 3D human activities point cloud by combining deep learning methods into one unified architecture. 3D Human activity classification is one of the popular research topics of recent years such as computer vision, robotics, and machine learning [1]. Especially in the last decade, various solutions related to 3D datasets have been developed with many applications such as healthcare, entertainment and multimedia, surveillance, and robotics realized with sequential depth video frames [2-4].
The activity can be defined as the evolution of human body postures in different spatiotemporal procedures. Human activities are modeled by defining repetitive configurations of their positions, which are achieved by connecting full body parts (head, arm, leg, etc.) as a set of joints [5]. Microsoft Kinect can be preferred as a sensor in the production of real-world data of human joint information for reasons such as competitive cost, reliability, and practicality [1]. The output of the proposed framework is to develop a human activity classification system using real-world data from the sensing infrastructure of unconstrained videos represented as input [6]. The use of 3D action data in activity recognition studies has become widespread as sensor cameras capable of capturing depth video become more accessible and cheaper [7]. In this regard, it is represented by depth information effectively on real-world scenes of objects and human actions [7, 8]. Some uncertain situations such as not being able to be identified by using real data are prevented in determining human movements. Since people use their joints belonging to their skeletons while exhibiting their daily movements, 3D joint information is used directly in extracting human activity information [9, 10]. Thus, the direct use of human skeleton 3D real-world joint position data in human action recognition and classification has been of intense interest for researchers.
Human activity classification studies can be classified into two categories on skeleton-based applications. These are handcrafted feature-based and deep network-based methods. A human activity classification is made by learning 3D ZM features obtained directly from the data using deep network-based methods, unlike handcrafted feature-based methods [11, 12]. Especially in the last few years, high-performance results have been obtained by using methods based on deep learning. Data with 3D skeletal joint information is often given directly to the system as input and produces an action class label as output [13]. While in some deep learning methods, temporal data entry is considered static, temporary sensitive deep learning methods are used where CNNs, LSTMs, and CNNs are trained jointly and combined into a single framework [14]. Therefore, the proposed approach in our paper is unique.
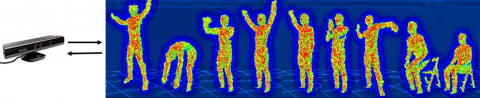
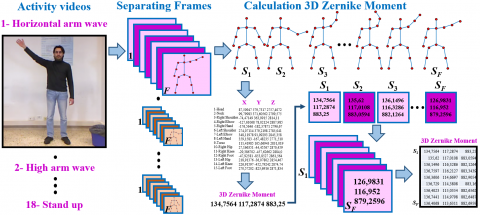
Kinect Activity Recognition Dataset (KARD), a database that has been detected a series of body skeletal joints by Kinect has been subjected to some pretreatment (such as splitting into video frames, decomposing postures). However, methods that perform a classification task from raw 3D skeleton frames face some problems for deep learning systems in end-to-end classification approaches. Because these systems that use 3D skeleton data often need huge amounts of data for training. The processes of obtaining, training, and processing the data cause many disadvantages in terms of cost and performance [15]. For this reason, instead of using real-world data of skeletal joint information, the 3D ZM value of skeletal information obtained from each frame has been calculated from a depth video of human action [16]. The measurement of different human activities using Kinect is illustrated in Figure 1.
Figure 1. Illustration of nine out of eighteen different human activities measurements of KARD
In this article, the 3D human activity classification task is presented as a system that learns the similarity of 3D ZM features between 3D joint sequence data using deep learning methods. In the classification of sequential joint sequence, different 3D joint arrays can be compared, in which 3D ZM features are automatically learned. We argue that classifiers can learn more easily because the Deep Metric Learning (DML) network can be trained with combinations of different joint sequences with 3D ZM results.
In the proposed model, spectral variations of the 3D Zernike Moment input features of the activity joint information are reduced with the CNN layer, and the output is fed with a Siamese LSTM (S-LSTM) layer.
Each CNN, LSTM, and DNN block captures 3D Zernike Moment information of the skeletons about the input representation. For this reason, it has been investigated whether the information obtained with Zernike Moment can be combined in multiple scales to achieve further improvement. Besides, the complementarity between the modeling capabilities of using LSTM and DNN layers together is emphasized. In particular, the transfer of the output of the CNN layer to both LSTM and DNN layers has been investigated. This article discusses a multi-scale CLDNN for the CLDNN architecture created using known additional connections. CLDNN architecture and multi-scale additions are described in section 3.
The article content is organized as follows. Related works are given in section 2. The architecture of the developed system is described in section 3. Section 4 presents the experimental results of the proposed system of the data set. The conclusion is presented in chapter 5.
Especially in the last few decades, various human activity classification studies based on RGB or RGB-D streams have been introduced. Traditional methods have focused on the processing of color images taken with the help of RGB cameras [17]. In some studies, RGB images of the human silhouette have been used as input to the hidden Markov model (HMMs) [18]. In these studies, some analyzes have been implemented by defining human silhouettes with various machine learning algorithms to classify them into different postures. In the methods based on RGB data, the required silhouette feature prevents real-time use due to the complexity of time in the production process such as image normalization, background removal, etc. Besides, they have poor applicability in situations with limited conditions, such as complex background or low lighting.
In some studies, approaches that do not require segmentation have been proposed by analyzing the appearance of salient points in both space and time. The relevance of the salient points represented is classified by machine classifiers such as KNN or SVM in each image sequence [19]. While temporal scales can produce good results in distinguish actions at different speeds in classifications made using invariant features, they cause errors in different actions at the same time cost rate [20].
Some researchers have used the capabilities of wearable sensors in human activity recognition studies. Using such sensors in the recognition of human movements provides more precise information [21]. However, portable video sensors are preferred because they produce similarly precise results without the need to wear and maintain any electronic equipment. In terms of these issues, the KARD dataset, in which Kinect was used to collect transparent observations about 3D human behavior, was accepted as a dataset in our study [22]. The data contained in human activity recognition studies, in particular using Kinect, are modeled in a series of kinematic joints of the human body, and recognition processes are performed by interactions between actions, joints, and subsets. The authors used data mining technique to discover the most discriminatory and represent the action as a combination of actions, due to the large number of possible actions that can be taken in human movements [23].
In some studies, researchers have proposed a posture-based approach in which prominent 3D points of human postures are represented by projecting and sampling depth maps on orthogonal planes [24]. The defined postures are associated with a node of an action graph created to model the dynamics of the subsequent actions. Although this technique produces noisy results due to the low-resolution levels of the sensors used, 3D projections produced with depth maps still yield more efficient results than 2D silhouettes. In this respect, more interpolation processes are needed in repairing corrupted projections, which leads to unnecessary increases in recognition time.
In histogram-based approaches, human postures are divided into n bins according to the 3D global coordinate system and are assigned to each area at 12 different joint uncertainty levels. The linear discriminant analysis (LDA) method is used to reduce the dimensions of the property space from n to C-1 for C classes and the generated properties are clustered in K-word strings numbers. Human activities are represented by word sequences and are recognized by discrete HMM classifiers. According to the approach, using a complex model in which joints are represented, the dimensions of feature vectors are reduced through LDA. In real-time applications where some feature spaces contain appropriate clusters, it is stated that using LDA does not contribute to increasing system performance in reducing this area [22].
In another approach used for gesture recognition, spherical angular representation is used. In this approach, nine different joints are represented by a pair of spherical angles. When defining poses, a multiclass classifier is defined. Using the decision tree, nodes are associated with the leaves in which key poses of different poses are represented. The difficulty of this method is that it is not possible to define and train the key sequence because it cannot be obtained from dynamic environments [25].
Some researchers have focused on the restructuring of the valid movement from noisy and missing poses obtained using Kinect. Here, the unidentified poses are kinematically corrected through similar valid poses in a database. Although this approach has improved improvements in undefined poses, its accuracy has not been established, since it is assumed that similar poses are always present in the database [26].
Approaches to using only depth information in obtaining silhouette are more practical because body appearance variations are more robust compared to RGB and depth information intensities are unchanged. By creating a body pose codebook, the researchers train the system using codes similar to the pose codeword of the human body. The common problem with these approaches is the routine background removal process or subjecting users to a remote background positioning [27].
In some studies, a hybrid method has been developed that integrates optical flow with transferable two-stream CNN to increase accuracy in human action recognition for reliable human-robot collaboration [28]. Besides, human action recognition from skeletal data supported by the Graph Convolutional Network (GCN), which has the ability to model powerful non-Euclidean data, has attracted a lot of attention [29].
In another study that addressed the problem of complex activity recognition, it was emphasized that system performance can be increased by using grayscale data together with depth information. It has been observed that the experimental results produced from this approach have significantly improved recognition and localization accuracy, but have a process lacking time cost analysis. In this respect, it is not possible to comment on the suitability of real-time applications [30]. Besides, there are studies in which both color and depth information are used together for activity recognition. In one of them, using the Kinect sensor, a data set called RGBD-HuDaAct was created containing 12 different activities performed by 30 different subjects at a distance of about 3m. In this approach, the results obtained with the multimodal feature, in which color and depth information are combined, are compared with single-mode approaches. However, neither an evaluation in terms of time-cost nor a comparison with other approaches have been made [31].
In the 3D human action classification problem, the system introduces a DML method that learns the similarity metric between the two joint arrays using 3D ZM data obtained from 3D skeletal joint information. Thus, the learned metrics are used to compare two different 3D joint arrays to classify different sequences. The most important advantages of the approach are to reduce the data by using a single 3D ZM value obtained from all joints in each frame instead of using all skeletal information for the collecting data. The other advantage is that it is easier to learn the similarity metric in smaller datasets than learning a classifier since it can be trained with different combinations of existing arrays with the DML network [32].
3.1 KARD-Dataset
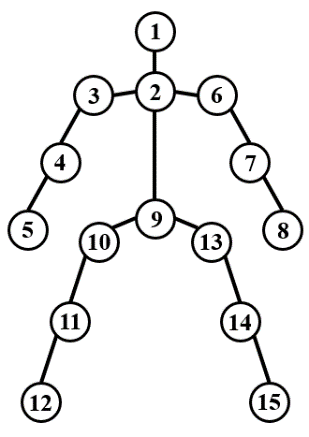
KARD dataset, which has produced by making use of Kinect’s abilities and paying attention to the accuracy of the basic truth, has been used in the proposed system. In the dataset, 18 different human actions have been evaluated as an activity. These are horizontal arm wave, high arm wave, two hand wave, catch cap, high throw, draw x, draw tick, toss paper, forward kick, side kick, take umbrella, bend, hand clap, walk, phone call, drink, sit down, and stand up. This dataset containing human movements is useful in evaluating simple sequences with complex actions in which different parts of the body interact with each other to reveal the distinction between classes of activity [33]. Fifteen different joints detected during the measurement of human activities using Kinect are shown in Figure 2.
Figure 2. Fifteen different detected joints of the human through Kinect
The video, prepared for each of the 18 activities, has repeated three times, between 20 and 30 years old, between 150 and 185 cm height, nine males and one female, 10 different individuals in total. Video users have asked to do their actions by naming them (e.g. Catch Cap) without specifying how they would do the action with the aim of naturalness. The dataset has captured from a scene with a desk, phone, coat rack, and a waste bin in the office with a Kinect sensor at a distance of 2 to 3 meters from the subject. The dataset consists of 540 sequences (18 activities x 3 repetitions x 10 subjects) in total. Each of these is an average of one hour of videos at a resolution of 640x480 pixels at 30 fps. In each sequence, besides RGB and depth images, real-world and screen coordinates are included in the list of detected joints.
Each file in the KARD is consisting 15xF (x, y, z) real-world data lines, containing head, neck, right shoulder, right elbow, right hand, left shoulder, left elbow, left hand, torso, right hip, right knee, right foot, left hip, left knee, and left foot respectively. Here F is the number of frames in the motion video for this sequence, and each line reports real-world coordinates (x, y, z) data in realworld.txt file.
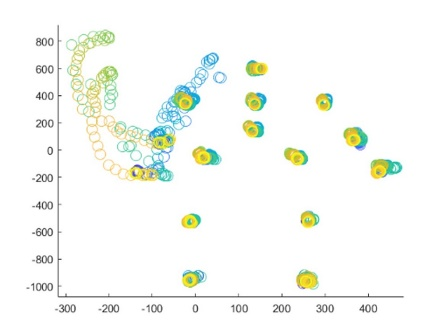
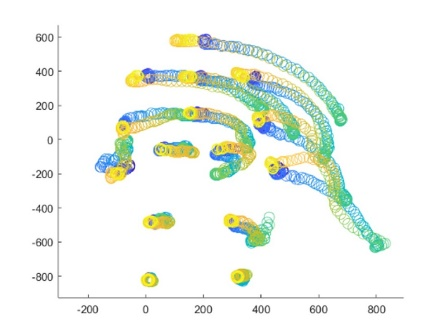
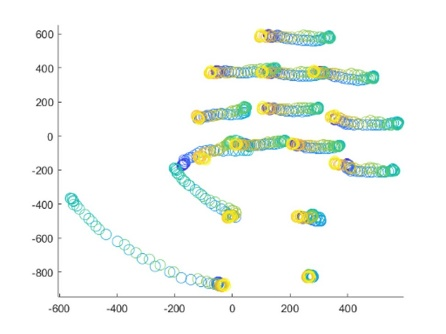
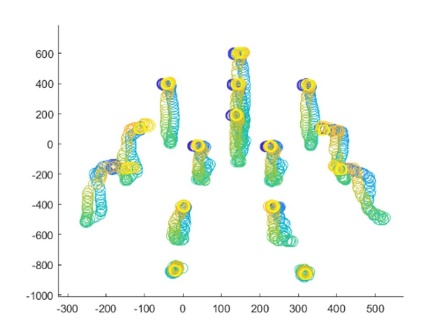
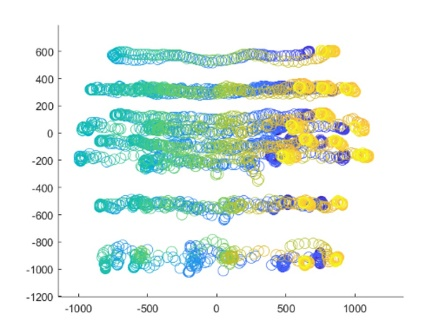
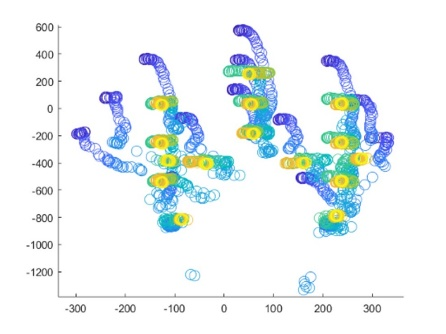
The real-world data of 15 joints within each frame in each activity of the data set is separated frame by frame for calculating the 3D ZM before the classification phase of the KARD data set. Figure 3 shows the circular plotting of each frame consisting of 15 lines separated from a subject during a sequence activity.
|
a) horizontal arm wave |
b) high arm wave |
c) two hand wave |
|
d) catch cap |
e) high throw |
f) draw x |
|
g) draw tick |
h) toss paper |
i) forward kick |
|
j) side kick |
k) take umbrella |
l) bend |
|
m) hand clap |
n) walk |
o) phone call |
|
p) drink |
q) sit down |
r) stand up |
Figure 3. Circular plot representation from 18 activity (a-r) frames consisting of a subject in a sequence of real-word motion data
Figure 4. Illustration of the 3D ZM calculation of all skeletal joint connections in each frame in the KARD dataset
3.2 3D Zernike moment computation
In the KARD data set, the calculation of the 3D ZMs by decomposing all frames containing 15 lines skeletal information in each motion video is shown in the flow diagram in Figure 4.
The 3D ZM calculation step has been applied to the entire KARD data set. After each frame containing 15 lines of skeleton joint information from the activity videos has been separated, a single 3D ZM value has been computed for those frames. The ZM calculation process can be summarized as follows briefly. Three-dimensional Zernike polynomials on point cloud during the calculation of classical ZM are defined as Zl,m,n, orthogonal polynomials [34];
$Z_{l, m, n}(\Re)=R_{l, m}(r) \boldsymbol{Y}_{m, n}(\theta, \phi)$, (1)
where, l ϵ [0, Max], m ϵ [0, l], and n ϵ [-m, m]. The (l - m) must be selected from integers with positive values. The maximum order is defined as a max-term during the calculation operations. $R_{l, m}(r)$ and $\boldsymbol{Y}_{m, n}(\theta, \phi)$ are referred to as radial functions and spherical harmonics with a real numerical value. As described in Eq. (2), 3D Zernike can be expanded using the polynomials defined in a unit ball of any function $f(\mathfrak{R})$;
$f(\Re)=\sum_{l=0}^{\infty} \sum_{m=0}^{l} \sum_{n=-m}^{m} \Omega_{l, m, n} Z_{l, m, n}(\Re)$. (2)
$\Omega$, which is the coefficient of expansion in Eq. (2), represents 3D Zernike Moment. Then the complex conjugate of polynomials as in Eq. (3) is generated.
$\Omega_{l, m, n}=\int_{0}^{1} \int_{0}^{2 \pi} \int_{0}^{\pi} \overline{Z_{l, m, n}(\Re)} f(\Re)\left(r^{2} \sin \theta d r d \theta d \phi\right)$. (3)
The transformation between 3D spherical and cartesian coordinates is formulated with 3D Zernike polynomials as follows;
$\left[\begin{array}{l}x \\ y \\ z\end{array}\right]=\left[\begin{array}{c}r \sin \theta \sin \phi \\ r \sin \theta \cos \phi \\ r \cos \phi\end{array}\right]$. (4)
3D Zernike polynomials are defined as follows;
$Z_{l, m, n}(X)=\sum_{v=0}^{k} Q_{k, m, v}|X|^{2 v} e_{m, n}(X)$, (5)
where, $k=(l-m) / 2$, is an integer value in the interval of $0 \leq v \leq k$. So the coefficient of $Q_{k, m, v}$ is defined as;
$\begin{aligned} Q_{k, m, v}=& \frac{(-1)^{k}}{2^{2 k}} \sqrt{\frac{2 m+4 k+3}{3}}\left(\begin{array}{c}2 k \\ k\end{array}\right)(-1)^{v} \\ & \frac{\left(\begin{array}{c}k \\ v\end{array}\right)\left(\begin{array}{c}2(k+m+v)+1 \\ 2 k\end{array}\right)}{\left(\begin{array}{c}k+m+v \\ k\end{array}\right)} \end{aligned}$ (6)
The formulas given above implements the calculation of 3D ZMs with very fast and low complexity using voxels of point clouds. 3D ZMs are expressed as the mathematical calculation of 3D monomial terms over digital point cloud voxels. The 3D ZM calculation of the point clouds of the original data in the real-world.txt format for each activity in the data set is performed in less than one second. In this respect, the 3D ZM feature extraction step calculated in milliseconds has no additional cost to the classification process [35]. 3D Zernike descriptors are generally used to compare to similar structures and the vectors, whereas the independent 3D ZM is used for feature computation in object classification. The definition of a set of suitable features for the high accuracy classification of the 3D point cloud is an issue that directly affects success [36].
In this study, it is thought that in the activity classification problem, higher performance will be obtained by preferring the classification of 3D ZM features from skeleton information instead of directly classifying 3D point clouds of skeletal joint information. In this regard, instead of using the skeleton joint information found in the entire data set, it is purified from the data crowd by using the 3D ZM obtained from the frame containing the 15-line skeleton joint information. Thus, the data is reduced by 1 in 15 in the first place. The 3D ZM calculation process has been completed in the Matlab R2019b environment in a very short time regardless of its inclusion in the time-cost computation process [37].
3.3 LSTM-based DML Module
In this paper, a Deep Metric Learning (DML) approach is proposed in the human activity classification problem, using deep learning methods, learning the similarity metric between the two joint sequence data via 3D ZM properties from skeletal joint information [32]. The classification process can be completed by using the auto-learned metric in the comparison of each subsequent two different sequences of joints. Here the DML network is advantageous because learning a similarity metric with small datasets is more practical than learning a classifier since it can be trained with different sequences available with various combinations.
This is the first known study using DML for a 3D human activity classification problem using 3D ZM feature extraction over skeletal joint information. Although manual systems using similarity metrics for activity classification have been proposed, the deep-learning-based metric learning approach with feature extraction has not been addressed yet [38]. This study is stunning, considering that DML systems are widely used especially in redefinition and biometric identification problems [39].
The proposed DML network uses an LSTM structure where the parameters are repeated in parallel within the same network in the form of the Siamese. S-LSTM architecture is used in networks in the human activity classification system since temporary sequence information can be learned efficiently with LSTM [4]. In this respect, the architecture is named Siamese-LSTM (S-LSTM) because a pair of LSTMs are repeated in parallel to be a copy of each other.
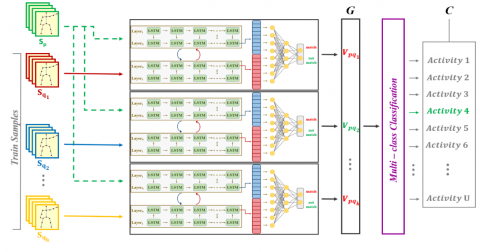
The proposed classification system consists of two modules, where 3D Zernike Moment values obtained from skeleton joint information are learned. The first one S-LSTM is used to calculate the similarity metric between activity pairs as shown in Figure 5. The second is the multi-class classification (McC) used for real activity classification as shown in Figure 6. In the proposed DML approach, since there is no fixed number of classes in the classification, the S-LSTM module is not restricted to the initial activity classes for the training set. In the first module, only similarities between activity sequences are learned. With this module, activity pairs with many different data sets can be trained. Therefore, the system can be generalized as learning the similarity with the data sets in a much larger scope with the proposed method shows higher performance compared to learning from a single group. Therefore, the S-LSTM module has an important place in the classification system in terms of its effect on recognition accuracy.
The main goal in the implemented system is to find as many accurate activity classes as accurate as possible, in response to the given 3D skeleton frame sequences. Besides, it is emphasized that learning the similarity metric provides an advantage with the S-LSTM method, where the proposed 3D action pairs are input to the system and the similarity between them is learned.
The classification system we propose consists of two consecutive modules. The first of these, Siamese-LSTM, is used in the similarity metric calculation between action pairs. Second, multi-class classification performer (MCC) is used in real action classification.
In the implemented DML approach, it is not limited to the first action classes in the training set, since there is no classification for a fixed number of classes in the S-LSTM module. On the contrary, the similarities between this module and action sequences are learned.
In this respect, in our proposed S-LSTM module, multiple action pairs with different data sets can be trained. This situation causes our method to be more generalizable. Because learning the similarity in multiple different data sets is expected to perform better than learning this information from a single set. With this expectation, it is obvious that the S-LSTM module in our system contributes significantly to the recognition accuracy. Besides, it is emphasized that the system can use any LSTM or RNN based network structures within the S-LSTM DML module. This makes the proposed system more modular and generalizable.
The S-LSTM module shown in Figure 5 takes the two 3D activity sequences Sp = {sp1, sp2, sp3, … spT} and Sq = {sq1, sq2, sq3, … sqR}. Here T and R are the total number of frames in each sequence. spt= {jt1, jt2, jt3,… jtN}p is a single skeleton frame; where N is called the total number of 3D joints in a single frame at time t. jtn={Zxn, Zyn, Zzn} $\epsilon$ R3 is the 3D Zernike Moment values obtained from the real coordinate data of the single joint jtn. Here T and R can take different values in each activity sequence. For this reason, LSTM cells are used in the metric learning system. One sequence is taken as input in two LSTM networks. As the output vector, Op $\epsilon$ RM and Oq $\epsilon$ RM are produced respectively. The vector sizes here are fixed regardless of the number of frames (T and R) of the input sequences.
Figure 5. Illustration of the S-LSTM-based DML module
Figure 6. Multi-class classification module
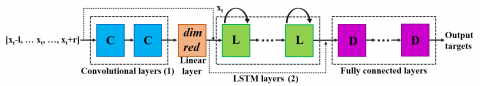
Figure 7. CLDNN architecture
LSTM blocks are modeled with the L (Sp, Sq) $\epsilon$ R2M function which returns a vector that is a combination of Op and Oq vectors. The extracted L (Sp, Sq) has deep similarity features to the input sequences. This vector is supported by a multi-layer perceptron (MLP) and a hot vector V $\epsilon$ R2 is produced that assigns one of the labels (match or not match).
$D\left(L\left(S_{p}, S_{q}\right)\right)=V_{p q}$, (7)
In this case, D is an MLP model that operates in two hidden layers.
$V_{p q}=\operatorname{Softmax}\left(b^{3}+W^{3} \operatorname{Re}\left(b^{2}+W^{2} \operatorname{Re}\left(b+W L\left(S_{p}, S_{q}\right)\right)\right)\right)$ (8)
In Eq. (8); the b’s are bias terms. W’s are network weights. Re (ReLU) is a rectified linear activation function that is used in neural networks because the gradient value of the sigmoid or hyperbolic tangent activation drops excessively in the extreme regions and training becomes impossible. Both the ReLU function itself and its derivative are monotone functions. Any negative value is returned by ReLU as zero. Converting all negative values to 0 prevents the model from being properly trained. Therefore, the model cannot be trained with negative values.
Both the ReLU function itself and its derivative are monotone functions. Although rare, 3D Zernike Moment values of some activities in the data set can be negatively calculated. In this case, any negative value is returned by ReLU as zero. Converting all negative values to 0 prevents the model from being properly trained. Therefore, the model cannot be trained with negative values.
As shown in Figure 6, the accuracy of the multi-class classification module largely depends on the effectiveness of the D module. In this respect, it has an important place in the classification.
As mentioned, the implemented 3D activity recognition system ultimately produces an action class label. The generated S-LSTM model has a 2D match-no match output vector that does not have a class label assignment. The McC module shown in Figure 6 presents the results of the comparison between test action $S_{p}$ and other training sequences $S_{q_{1}}, S_{q_{2}} \ldots S_{q_{k}}$ using k training sequences.
$G \in R^{2 k}$ is considered as the S-LSTM model results obtained from the concatenation of $V_{p q_{1}}, V_{p q_{2}}, \ldots V_{p q_{k}}$ vectors. McC is fed from the G vector as input. The output of this module is a hot vector of CÎRu, which will have U number of activity class labels.
Although in the S-LSTM module, which is the first module, activity pairs need to be given as input and trained with match-no match output labels, the second module, McC, must eventually be trained with activity class labels. In this method, although the activity sequence pairs from different datasets can be trained using S-LSTM, the McC module has been trained with a single dataset with specific activity class labels.
The training process is carried out separately with two independent modules, S-LSTM, and McC training. In the S-LSTM training process, a labeling issue has occurred because the number of possible “no match” pairs is greater than the number of “match” pairs. In order to compensate for this balance problem, in the S-LSTM training, the ratio of match / no match pairs is kept at 1 / U level for any dataset of the U number of activity classes. However, there is no such problem of label imbalance in the McC module. Because, as the output, the activity labels are expected to be relatively overlapping with the activity classes. Moreover, it should be noted that the number of training samples in the McC module is considerably less than the number of training samples in the S-LSTM module.
3.4 CLDNN architecture
Figure 7 shows that from the left to the right, the xt frame surrounded by the contextual vectors l and r are given as input to the network. This input expressed as [ xt-l , …, xt+r ], is a 45-dimensional filter bank with a 3D ZM feature obtained from skeleton joint information of 15 lines within each xt frame. Each CNN layer given in Figure 7 is inspired by the architecture proposed by Sainath et al. [40]. In this regard, the input is passed through several convolutional layers. There are 2 different convolutional layers in architecture, each containing 256 feature maps. The first convolutional layer uses a 9x9 frequency-time filter, the second convolutional layer uses a 4x3 filter. These used filters have been shared across the entire time-frequency space. The pooling procedure uses the non-overlapping max-pooling strategy to perform frequency pooling only, proposed by Sainath et al. [41]. Pooling size has been determined as 3 in the first layer, however, no pooling has been made for the second layer.
The number of dimensions in the last layer of CNN is increasing due to the growth of the number of feature-maps x time x frequency context. Therefore, in order to reduce the feature dimension, a linear layer has added before the LSTM layer as shown in Figure 7. They have found that the addition of the linear layer before the LSTM following the CNN layer allowed a reduction for parameters without loss inaccuracy [42]. According to the experience gained from our experiments, it has been determined that the number of outputs from the linear layer will be 256 with a suitable dimension reduction.
The CNN output is passed to the appropriate LSTM layers after the frequency modeling. A multiple S-LSTM layers with 512 units of projection layer have been used for dimension reduction [43]. Moreover, the output state label is delayed 5 frames to better estimate the current frame with the information about the next frames. The CNN outputs with the contextual frames l and r are then passed to the LSTM. It is set to r = 0 to prevent the future context from seeing more than 5 frames in CLDNNs. Because increasing this value causes growth in LSTM's decoding latency. Finally, outputs of LSTM layers are transferred to fully connected DNN layers by using temporal modeling. Each fully connected layer consists of 1024 hidden units. In producing a high-order feature representation, it is appropriate to prefer higher layers that can be easily separated into a large number of different classes to be distinguished [44].
The proposed method has been tested on two internationally recognized KARD and Florence Action 3D datasets to compare experimental results [45]. In order to better evaluate the effective performance of the method, the results of S-LSTM and MCC modules have been compared separately. Also, the results obtained using the direct real-world skeletal joint information and their 3D Zernike Moment features have been compared for both datasets. Training and experimental procedures have implemented using TensorFlow on a PC with NVidia GeForce GT 650M GPU board, 2.3GHz, and 8GB RAM.
In the proposed system, 3D human activities for both data sets can be classified by deep metric learning and similarities can be found between them. In this regard, the results of deep metric learning accuracies are shown with an increasing number of epochs for both modules used. Firstly, the results obtained using the real-world skeletal joint information of the datasets are given in Figures 8 and 9.
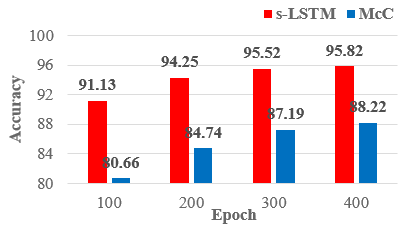
Then, the experimental results implemented using 3D Zernike Moment features obtained from skeleton joint information for two separate datasets are given in Figures 10 and 11.
Figure 8. Accuracy comparison of S-LSTM and McC Modules for the KARD dataset using the real-world skeletal joint information
Figure 9. Accuracy comparison of S-LSTM and McC Modules for the Florence Action 3D dataset using the real-world skeletal joint information
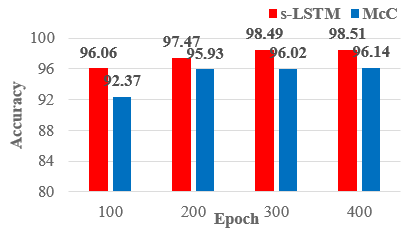
Figure 10. Accuracy comparison of S-LSTM and McC Modules for the KARD dataset using the 3D Zernike Moment features
Figure 11. Accuracy comparison of S-LSTM and McC Modules for the Florence Action 3D dataset using 3D Zernike Moment features
As evidenced by experimental results, the performance of S-LSTM and McC modules increases with an increasing set of epoch numbers. In the experimental results, the accuracy results obtained with 3D Zernike Moment feature extractions in both modules for both datasets reached higher values compared to the training done directly with skeletal joint information. The max accuracy rate obtained for the KARD dataset is 90.79 for the S-LSTM module while using real-world skeletal joint information, and it increases to 98.51 while using 3D Zernike Moment features. Similarly, in this dataset, the accuracy value of 82.69 for the McC module has increased to 96.14 when 3D Zernike Moment features have been used. When similar situations have been evaluated for the Florence Action 3D dataset, the maximum accuracy rate obtained for the S-LSTM module increased from 88.13 (with skeletal information) to 95.82 while using 3D Zernike Moment features. Similarly, in this dataset, the accuracy value of 80.28 for the McC module has increased to 88.22 when 3D Zernike Moment features have been used. In general, there is an increase in performances according to the increasing number of epochs for both modules. However, this increasing rate is higher in the McC module compared to the S-LSTM module. The proper training of S-LSTM with robustly established LSTM blocks has led to a significant improvement in system performance. In this respect, it is thought that the LSTM method will make important contributions in classifications made using multiple datasets in similar studies. Used for training datasets{(75,200,2) LSTM, (200,200,2) LSTM, (400,1) CONCAT, (400,300) FC, (300, 150) ReLU-FC, (300,50) ReLU-FC, (50,2) ReLU-FC } have trained 400 epochs for all subjects in model architecture.
The performance of the method has also been evaluated using several state-of-the-art classification methods [37]. As shown in Table 1, both the LSTM module and the 3D Zernike Moment feature extraction make a significant positive contribution to the system performance applied in the proposed method compared to state-of-the-art classification algorithms. Our dataset used in experimental results consists of 2160 action samples obtained from three repetitions of 18 different action types from 10 people. These activities (1-Horizontal arm wave 2-High arm wave 3-Two hand wave 4-Catch Cap 5-High throw 6-Draw X 7-Draw Tick 8-Toss Paper 9-Forward Kick 10-Side Kick 11-Take Umbrella 12-Bend 13-Hand Clap 14-Walk 15-Phone Call 16-Drink 17-Sit down 18-Stand up) have obtained by means of the Kinect sensor in a closed environment respectively.
Table 1. Results of state-of-the-art classification methods on Florence Action 3D and KARD datasets
|
Methods |
Florence Action 3D |
KARD |
||
|
Joint |
3D ZM |
Joint |
3D ZM |
|
|
SVM |
21.0% |
43.3% |
45.7% |
0,50% |
|
Softmax |
55.5% |
68.4% |
72.2% |
75.9% |
|
1-Layer LSTM |
69.3% |
81.2% |
82.9% |
90.1% |
|
2-Layer LSTM |
65.1% |
76.3% |
84.8% |
93.2% |
|
Multi-part Bag-of-Poses [45] |
73.9% |
76.2% |
83.6% |
91.9% |
|
Riemannian Manifold [46] |
78.4% |
80.9% |
86.1% |
94.7% |
|
Latent Variables [47] |
80.7% |
75.9% |
87.6% |
69.9% |
|
Lie Group [48] |
81.8% |
74.9% |
85.3% |
69.0% |
|
Feature Combinations [49] |
85.0% |
87.8% |
90.4% |
94.9% |
|
S-LSTM DML (Proposed) |
80.3% |
88.2% |
82.7% |
96.1% |
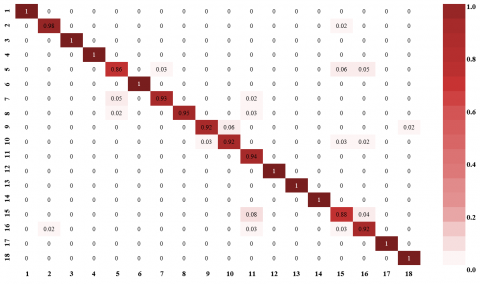
Figure 12. Confusion matrix of KARD dataset with S-LSTM DML method
According to the experimental results, the proposed method correctly classified 96.1% of the activities. As seen in Table 1, the proposed method stands out with a significant difference (FA3D-88.2% and KARD-96.1%) in the classification of both data lists compared to state-of-the-art classification methods. On the other hand, it could not reach the best results (FA3D-80.3% and KARD-82.7%) among state-of-the-art classification methods in the classifications made using the skeletal joint information directly.
The confusion matrix of the proposed method applied to the KARD dataset is given in Figure 12. Looking at the behavior of the method in this dataset, the High throw action (5th action) is mostly confused with the Phone Call and Drink actions (actions 15 and 16) according to the confusion matrix. Similarly, the Phone Call action (15th action) has most confused with the Take Umbrella and Drink (actions 11 and 16).
As shown in Figure 7, the CNN + LSTM and LSTM + DNN models have been combined. The features obtained have first transferred to a CNN, then temporal modeling has applied with an LSTM, and finally, the produced output has fed with two fully connected layers. Table 2 shows the classification error rates of activities for both datasets using 3D Zernike Moment features in the LSTM, CNN + LSTM, LSTM + DNN, and CLDNN models, respectively. According to the results shown in Table 2, it can be said that the gains from combining the LSTM layer with the CNN and DNN layers are complementary. In this respect, it was observed that the activity classification error rate results obtained with CLDNN for Florence Action 3D and KARD data provided a relative improvement of 5% compared to the LSTM model.
Table 2. Results of the classification error rate of activities
|
Methods |
Activity Error Rate (3D ZM) % |
|
|
Florence Action 3D |
KARD |
|
|
LSTM |
11.8 |
3.9 |
|
CNN + LSTM |
11.5 |
3.8 |
|
LSTM + DNN |
11.4 |
3.8 |
|
CLDNN |
11.2 |
3.7 |
This paper introduces a new deep metric learning module using 3D Zernike Moment for 3D Human activities classification system. In this module, the real skeleton data has been simplified with 3D Zernike Moment features and trained by making the training data set larger using action sequence pairs. This approach is the authority, as the acquisition of training data is very important in 3D activity recognition systems. Since the applied metric learning system does not require training on a single dataset, it can be used modularly and portable for different applications. The experimental results performed on two different data sets emphasize that both the use of 3D Zernike Moment features instead of real skeleton information and the S-LSTM DML module instead of state-of-the-art recognition systems are at a comparable level. It is complementary in terms of the gains from combining CNN and DNN layers with LSTM. A unified CNN, LSTM, and DNN architecture called CLDNN provide a 5% improvement in activity classification error rates compared to implementing individual modules. In the future, we plan to work on the efficiency of using more advanced LSTM blocks with a large number of data sets.
[1] Chen, C., Jafari, R., Kehtarnavaz, N. (2017). A survey of depth and inertial sensor fusion for human action recognition. Multimedia Tools and Applications, 76(3): 4405-4425. https://doi.org/10.1007/s11042-015-3177-1
[2] Uddin, M.Z. (2017). Human activity recognition using segmented body part and body joint features with hidden Markov models. Multimedia Tools and Applications, 76(11): 13585-13614. https://doi.org/10.1007/s11042-016-3742-2
[3] Ge, W., Collins, R.T., Ruback, R.B. (2012). Vision-based analysis of small groups in pedestrian crowds. IEEE Transactions on Pattern Analysis and Machine Intelligence, 34(5): 1003-1016. https://doi.org/10.1109/TPAMI.2011.176
[4] Yucer, S., Akgul, Y.S. (2018). 3D human action recognition with Siamese-LSTM based deep metric learning. Journal of Image and Graphics, 6(1): 21-26. https://doi.org/10.18178/joig.6.1.21-26
[5] Uddin, M.Z., Kim, T.S. (2015). 3-D body joint-specific HMM-based approach for human activity recognition from stereo posture image sequence. Multimedia Tools and Applications, 74(24): 11207-11222. https://doi.org/10.1007/s11042-014-2225-6
[6] Liang, Y.M., Shih, S.W., Shih, A.C.C. (2013). Human action segmentation and classification based on the Isomap algorithm. Multimedia Tools and Applications, 62(3): 561-580. https://doi.org/10.1007/s11042-011-0858-2
[7] Tang, S., Wang, X., Lv, X., Han, T.X., Keller, J., He, Z., Lao, S. (2012). Histogram of oriented normal vectors for object recognition with a depth sensor. In Asian Conference on Computer Vision, 525-538. Springer, Berlin, Heidelberg. https://doi.org/10.1007/978-3-642-37444-9_41
[8] Ozbay, E., Cinar, A. (2013). 3D reconstruction technique with kinect and point cloud computing. Global Journal on Technology, 3.
[9] Presti, L.L., La Cascia, M. (2016). 3D skeleton-based human action classification: A survey. Pattern Recognition, 53: 130-147. https://doi.org/10.1016/j.patcog.2015.11.019
[10] Ozbay, E., Cinar, A., Guler, Z. (2018). A hybrid method for skeleton extraction on Kinect sensor data: Combination of L1-Median and Laplacian shrinking algorithms. Measurement, 125: 535-544. https://doi.org/10.1016/j.measurement.2018.05.029
[11] Du, Y., Wang, W., Wang, L. (2015). Hierarchical recurrent neural network for skeleton based action recognition. 2015 IEEE Conference on Computer Vision and Pattern Recognition (CVPR), pp. 1110-1118. https://doi.org/10.1109/CVPR.2015.7298714
[12] Du, Y., Fu, Y., Wang, L. (2016). Representation learning of temporal dynamics for skeleton-based action recognition. IEEE Transactions on Image Processing, 25(7): 3010-3022. https://doi.org/10.1109/TIP.2016.2552404
[13] Veeriah, V., Zhuang, N., Qi, G.J. (2015). Differential recurrent neural networks for action recognition. 2015 IEEE International Conference on Computer Vision (ICCV), pp. 4041-4049. https://doi.org/10.1109/ICCV.2015.460
[14] Zhang, P., Lan, C., Xing, J., Zeng, W., Xue, J., Zheng, N. (2017). View adaptive recurrent neural networks for high performance human action recognition from skeleton data. 2017 IEEE International Conference on Computer Vision (ICCV), pp. 2136-2145. https://doi.org/10.1109/ICCV.2017.233
[15] Kumaran, N., Vadivel, A., Kumar, S.S. (2018). Recognition of human actions using CNN-GWO: A novel modeling of CNN for enhancement of classification performance. Multimedia Tools and Applications, 77(18): 23115-23147. https://doi.org/10.1007/s11042-017-5591-z
[16] Liu, Z., Zhang, C., Tian, Y. (2016). 3D-based deep convolutional neural network for action recognition with depth sequences. Image and Vision Computing, 55: 93-100. https://doi.org/10.1016/j.imavis.2016.04.004
[17] Niebles, J.C., Fei-Fei, L. (2007). A hierarchical model of shape and appearance for human action classification. In 2007 IEEE Conference on Computer Vision and Pattern Recognition, pp. 1-8. https://doi.org/10.1109/CVPR.2007.383132
[18] Yamato, J., Ohya, J., Ishii, K. (1992). Recognizing human action in time-sequential images using hidden Markov model. In CVPR, 92: 379-385. https://doi.org/10.1109/CVPR.1992.223161
[19] Oikonomopoulos, A., Patras, I., Pantic, M. (2005). spatiotemporal salient points for visual recognition of human actions. IEEE Transactions on Systems, Man, and Cybernetics, Part B (Cybernetics), 36(3): 710-719. https://doi.org/10.1109/TSMCB.2005.861864
[20] Willems, G., Tuytelaars, T., Van Gool, L. (2008). An efficient dense and scale-invariant spatio-temporal interest point detector. In European conference on computer vision, 650-663. Springer, Berlin. https://doi.org/10.1007/978-3-540-88688-4_48
[21] Preece, S.J., Goulermas, J.Y., Kenney, L.P., Howard, D., Meijer, K., Crompton, R. (2009). Activity identification using body-mounted sensors—a review of classification techniques. Physiological Measurement, 30(4): R1. https://doi.org/10.1088/0967-3334/30/4/R01
[22] Cottone, P., Re, G.L., Maida, G., Morana, M. (2013). Motion sensors for activity recognition in an ambient-intelligence scenario. 2013 IEEE International Conference on Pervasive Computing and Communications Workshops (PERCOM Workshops), pp. 646-651 https://doi.org/10.1109/PerComW.2013.6529573
[23] Wang, J., Liu, Z., Wu, Y., Yuan, J. (2013). Learning actionlet ensemble for 3D human action recognition. IEEE Transactions on Pattern Analysis and Machine Intelligence, 36(5): 914-927. https://doi.org/10.1109/TPAMI.2013.198
[24] Li, W., Zhang, Z., Liu, Z. (2010, June). Action recognition based on a bag of 3d points. 2010 IEEE Computer Society Conference on Computer Vision and Pattern Recognition-Workshops, pp. 9-14. https://doi.org/10.1109/CVPRW.2010.5543273
[25] Miranda, L., Vieira, T., Martínez, D., Lewiner, T., Vieira, A.W., Campos, M.F. (2014). Online gesture recognition from pose kernel learning and decision forests. Pattern Recognition Letters, 39: 65-73. https://doi.org/10.1016/j.patrec.2013.10.005
[26] Shum, H.P., Ho, E.S., Jiang, Y., Takagi, S. (2013). Real-time posture reconstruction for microsoft kinect. IEEE Transactions on Cybernetics, 43(5): 1357-1369. https://doi.org/10.1109/TCYB.2013.2275945
[27] Gupta, R., Chia, A.Y.S., Rajan, D. (2013). Human activities recognition using depth images. In Proceedings of the 21st ACM international conference on Multimedia, pp. 283-292. https://doi.org/10.1145/2502081.2502099
[28] Xiong, Q., Zhang, J., Wang, P., Liu, D., Gao, R.X. (2020). Transferable two-stream convolutional neural network for human action recognition. Journal of Manufacturing Systems, 56: 605-614. https://doi.org/10.1016/j.jmsy.2020.04.007
[29] Peng, W., Hong, X., Chen, H., Zhao, G. (2020). Learning graph convolutional network for skeleton-based human action recognition by neural searching. In Proceedings of the AAAI Conference on Artificial Intelligence, 34(3): 2669-2676. https://doi.org/10.1609/aaai.v34i03.5652
[30] Ni, B., Pei, Y., Moulin, P., Yan, S. (2013). Multilevel depth and image fusion for human activity detection. IEEE Transactions on Cybernetics, 43(5): 1383-1394. https://doi.org/10.1109/TCYB.2013.2276433
[31] Ni, B., Wang, G., Moulin, P. (2011). Rgbd-hudaact: A color-depth video database for human daily activity recognition. In 2011 IEEE International Conference on Computer Vision Workshops (ICCV Workshops), pp. 1147-1153. https://doi.org/10.1109/ICCVW.2011.6130379
[32] Yi, D., Lei, Z., Liao, S., Li, S.Z. (2014). Deep metric learning for person re-identification. In 2014 22nd International Conference on Pattern Recognition, pp. 34-39. https://doi.org/10.1109/ICPR.2014.16
[33] KARD Dataset: [Online] Available: https://data.mendeley.com/datasets/k28dtm7tr6/1, accessed on 10 Sep. 2020.
[34] Grandison, S., Roberts, C., Morris, R.J. (2009). The application of 3D Zernike Moments for the description of “model-free” molecular structure, functional motion, and structural reliability. Journal of Computational Biology, 16(3): 487-500. https://doi.org/10.1089/cmb.2008.0083
[35] Hosny, K.M., Hafez, M.A. (2012). An algorithm for fast computation of 3D Zernike Moments for volumetric images. Mathematical Problems in Engineering, 2012: 1-17. https://doi.org/10.1155/2012/353406
[36] Behley, J., Steinhage, V., Cremers, A.B. (2012). Performance of histogram descriptors for the classification of 3D laser range data in urban environments. In 2012 IEEE International Conference on Robotics and Automation, pp. 4391-4398. https://doi.org/10.1109/ICRA.2012.6225003
[37] Özbay, E., Çınar, A. (2019). A Comparative study of object classification methods using 3D Zernike moment on 3D point clouds. Traitement du Signal, 36(6): 549-555. https://doi.org/10.18280/ts.360610
[38] Wang, P., Yuan, C., Hu, W., Li, B., Zhang, Y. (2016). Graph based skeleton motion representation and similarity measurement for action recognition. In European Conference on Computer Vision, pp. 370-385. https://doi.org/10.1007/978-3-319-46478-7_23
[39] Chopra, S., Hadsell, R., LeCun, Y. (2005). Learning a similarity metric discriminatively, with application to face verification. In 2005 IEEE Computer Society Conference on Computer Vision and Pattern Recognition (CVPR'05), pp. 539-546. https://doi.org/10.1109/CVPR.2005.202
[40] Sainath, T.N., Mohamed, A.R., Kingsbury, B., Ramabhadran, B. (2013). Deep convolutional neural networks for LVCSR. 2013 IEEE International Conference on Acoustics, Speech and Signal Processing, pp. 8614-8618. https://doi.org/10.1109/ICASSP.2013.6639347
[41] Sainath, T.N., Kingsbury, B., Mohamed, A.R., Dahl, G. E., Saon, G., Soltau, H., Ramabhadran, B. (2013). Improvements to deep convolutional neural networks for LVCSR. In 2013 IEEE Workshop on Automatic Speech Recognition and Understanding, pp. 315-320. https://doi.org/10.1109/ASRU.2013.6707749
[42] Sainath, T.N., Peddinti, V., Kingsbury, B., Fousek, P., Ramabhadran, B., Nahamoo, D. (2014). Deep scattering spectra with deep neural networks for LVCSR tasks. In Fifteenth Annual Conference of the International Speech Communication Association. https://doi.org/10.1109/ICASSP.2014.6853588
[43] Zia, T., Zahid, U. (2014). Long short-term memory recurrent neural network architectures for large scale acoustic modeling. International Journal of Speech Technology, 22: 21-30. https://doi.org/10.1007/s10772-018-09573-7
[44] Mohamed, A.R., Hinton, G., Penn, G. (2012). Understanding how deep belief networks perform acoustic modelling. In 2012 IEEE International Conference on Acoustics, Speech and Signal Processing (ICASSP), pp. 4273-4276. https://doi.org/10.1109/ICASSP.2012.6288863.
[45] Seidenari, L., Varano, V., Berretti, S., Bimbo, A., Pala, P. (2013). Recognizing actions from depth cameras as weakly aligned multi-part bag-of-poses. 2013 IEEE Conference on Computer Vision and Pattern Recognition Workshops, pp. 479-485. https://doi.org/10.1109/CVPRW.2013.77
[46] Devanne, M., Wannous, H., Berretti, S., Pala, P., Daoudi, M., Del Bimbo, A. (2014). 3-d human action recognition by shape analysis of motion trajectories on Riemannian manifold. IEEE Transactions on Cybernetics, 45(7): 1340-1352. https://doi.org/10.1109/TCYB.2014.2350774
[47] Anirudh, R., Turaga, P., Su, J., Srivastava, A. (2015). Elastic functional coding of human actions: From vector-fields to latent variables. In Proceedings of the IEEE Conference on Computer Vision and Pattern Recognition, pp. 3147-3155. https://doi.org/10.1109/CVPR.2015.7298934
[48] Vemulapalli, R., Arrate, F., Chellappa, R. (2014). Human action recognition by representing 3d skeletons as points in a lie group. In Proceedings of the IEEE Conference on Computer Vision and Pattern Recognition, pp. 588-595. https://doi.org/10.1109/CVPR.2014.82
[49] Luvizon, D.C., Tabia, H., Picard, D. (2017). Learning features combination for human action recognition from skeleton sequences. Pattern Recognition Letters, 99: 13-20. https://doi.org/10.1016/j.patrec.2017.02.001