Jiayin Pei | Peng Shan*
© 2019 IIETA. This article is published by IIETA and is licensed under the CC BY 4.0 license (http://creativecommons.org/licenses/by/4.0/).
OPEN ACCESS
In classroom teaching, the teachers should adjust the teaching strategy and improve the teaching effect based on the expression and learning state of each student. This paper mainly develops a micro-expression recognition algorithm for students in classroom learning, based on convolutional neural network (CNN) and automatic face detection. Specifically, the multi-task deep convolution network (DNN) was adopted to detect the landmark points of human face, and a hybrid DNN was designed to extract the optical-flow features of micro-expression. The extracted features were improved through redundancy removal and dimensionality reduction. The rationality of our algorithm was proved through a comparative experiment on real-world databases and an application in classroom teaching. The research results provide a new direction for applying deep learning in face recognition.
convolutional neural network (CNN), micro-expression recognition, deep learning, face detection, classroom learning
The progress of computer image processing and artificial intelligence (AI) is a blessing to classroom teaching. The classroom learning state of students can now be tracked and monitored in real time with the monitoring camera system, making it possible to evaluate classroom teaching from multiple dimensions [1].
Many studies [2-5] have shown that positive and negative emotions respectively promote and suppress cognitive and memory processes. In classroom teaching, the happy and interested students are more active and efficient in learning, while those with negative moods like confusion, fidgety and disgust are slow and inefficient in learning. Therefore, the teachers should pay attention to the emotional changes of students in classroom teaching, and help them to keep positive emotions as much as possible.
For many various reasons, it is difficult for teachers to fully consider the emotional state of students in classroom teaching. To overcome the difficulty, the monitoring system should be implemented to record the learning state of students, recognize their emotional changes automatically, and identify their exact emotional state. In this way, the teaching progress can be adjusted in time to relieve the bad mood of students, and the teaching contents can be arranged flexibly as per their emotional state, thus improving the overall learning efficiency.
Micro-expression refers to any fast expression that lasts only 1/25-1/5 of a second [6]. Such an expression often reveals the real emotion that one may try to suppress or hide. To improve classroom teaching, this paper proposes a novel micro-expression recognition algorithm that can recognize the expression of students in classroom accurately.
Early studies on the automatic recognition of micro-expression mainly focus on the differentiation between micro-expression and macro-expression. For example, Sariyanidi et al. [7] found that the associated completed local binary pattern from three orthogonal planes (CLPB-TOP) operator achieved a higher recognition accuracy than the LPB-TOP. Borza et al. [8] extracted Gabor features from each frame of image in the video, and then recognized micro-expression by gentle support vector machine (SVM), which automatically segments the image sequence.
Using the active shape model, Li and Guan [9] located the landmark points of human face in the following steps: the human face was segmented into 12 regions by facial action coding system; each region was preprocessed and subjected to the extraction of image sequence features by gradient histogram; the k-means clustering (KMC) was performed and the cluster annotation was established; finally, micro-expression was identified by gradient histogram and weighted voting.
Lung [10] put forward the Riesz wavelet function recognition method for micro-expression. Considering the short duration and small action amplitude of micro-expression, Li et al. [11] enhanced the small action amplitude by Eulerian video magnification before performing micro-expression recognition.
He et al. [12] identified micro-expression in the light of action units. First, a set of fine facial positioning rules was defined. Then, the face position was determined by the rules. After that, the mouth corner was positioned on the face. At last, the tracking learning detection (TLD) was adopted to track and identify the motions of micro-expression. Wang et al. [13] proposed a strategy called the main directional mean optical flow feature, in which the main directional video features are extracted, and combined with the mean optical flow feature to extract the features of some blocks in face images.
In recent years, deep learning [14] has been increasingly applied in image retrieval, face recognition, and expression recognition. The deep learning methods are generally based on neural networks [15] like convolutional neural network (CNN), recurrent neural network (RNN) and deep neural network (DNN). Kim et al. [16] combined the CNN with the RNN into a small-scale spatiotemporal feature learning method to recognize the micro-expression in videos. Jain et al. [17] integrated SVM classifier with linear kernel and deep belief network (DBN), and successfully applied the integrated approach to recognize various facial features.
Some scholars have introduced image processing and expression recognition into the evaluation of classroom teaching. For instance, Zhao [18] developed an emotion computing model for facial expression recognition in classroom, which relies on a tree classifier to recognize the facial expressions of students. D’Mello [19] observed the emotional changes of students, using the auto tutor system, and concluded that the six basic emotions proposed by Ekman cannot be fully applied to teaching evaluation. Tong et al. [20] set up a 3D emotional space model based on the facial expression recognition in classroom, and evaluated the degrees of fatigue, interest and pleasure of students according to the performance in each dimension. Huang and Huang [21] recognized the expression of various faces through feature extraction and classification: the emotional state of students was analyzed in the light of their learning state, level and effect, and an emotional model was created for the students based on the emotion evaluation indices.
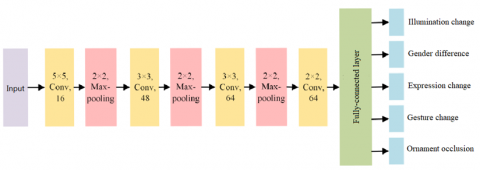
Facial landmark location is a key prerequisite of the analysis on facial micro-expression. With the aid of facial landmark, it is easy to enhance the facial features, obtain rich information of facial features, and extract the position change of landmark points. The location of facial landmark is affected by various factors, such as gesture change, ornament occlusion, illumination change and expression change. These influencing factors should be fully considered to detect facial landmark. This paper presents a facial landmark location model (Figure 1) based on multi-task learning and three deep convolutional networks (DCNs): P-Net, R-Net and O-Net.
Figure 1. Facial landmark location model based on multi-task learning and three DCNs
As shown in Figure 1, the proposed facial landmark location model contains several convolutional layers and max-pooling layers, plus one fully-connected layer. The input of the model is the original face image, and the output is the detected locations of face landmark points and the influencing factors (e.g. gender difference and ornament occlusion). The convolutional layers either use 5×5 or 3×3 kernels. After convolution, the rectified linear unit (ReLU) was adopted as the activation function. The fully-connected layer mainly outputs the detected locations of face landmark points and the influencing factors.
In the model, a task $\mathrm{X}_{\mathrm{i}}^{\mathrm{t}}$ and its labels $\mathrm{y}_{\mathrm{i}}^{\mathrm{t}}$ are described as $\left(\mathrm{x}_{\mathrm{i}}^{\mathrm{t}}, \mathrm{y}_{\mathrm{i}}^{\mathrm{t}}\right)$, where $\mathrm{t}=\{1,2, \ldots, \mathrm{T}\}$ and $\mathrm{i}=\{1, \ldots, \mathrm{N}\}$. The task set T includes five related tasks, whose labels are denoted as $\left\{y_{i}^{1}, y_{i}^{2}, y_{i}^{3}, y_{i}^{4}, y_{i}^{5}\right\}$. Then, the main objective of the facial landmark location model is to minimize the cost function below:
$\arg \cdot \min \sum_{t=1}^{T} \sum_{i=1}^{N} \operatorname{Loss}\left(y_{i}^{t}, f\left(x_{i}^{t}, w^{t}\right)\right)$ (1)
where, Loss $(\cdot)$ is the cost function; $f(\cdot)$ is the calculation of task target $\mathrm{x}_{\mathrm{i}}^{\mathrm{t}}$ by weight coefficient $\mathbf{w}^{\mathrm{t}}$.
In model training, the information of related tasks is learned at the same time. Therefore, the face landmark points detected for the current task will be influenced by the related tasks. Here, three tasks are selected to train the proposed model, namely, face detection, boundary box regression and facial landmark location.
For face detection, the learning process can be considered as binary classification problem. For each task $\mathrm{x}_{\mathrm{i}}^{\mathrm{t}}$, the cross-entropy loss was introduced:
$\mathrm{F}_{\mathrm{i}}^{\mathrm{d}}=-\left(\mathrm{y}_{\mathrm{i}}^{\mathrm{d}} \log \left(\mathrm{p}_{\mathrm{i}}\right)+\left(1-\mathrm{y}_{\mathrm{i}}^{\mathrm{d}}\right)\left(1-\log \left(\mathrm{p}_{\mathrm{i}}\right)\right)\right)$ (2)
where, Pi is the probability of face; $\mathrm{y}_{\mathrm{i}}^{\mathrm{d}} \in\{0,1\}$ is the real label.
For boundary box regression, the deviation of each candidate window from the nearest true value should be predicted. For each task $\mathrm{x}_{\mathrm{i}}^{\mathrm{t}}$, the Euclidean loss was introduced:
$\mathrm{F}_{\mathrm{i}}^{\mathrm{b}}=\left\|\hat{y}_{\mathrm{i}}^{\mathrm{b}}-\mathrm{y}_{\mathrm{i}}^{\mathrm{b}}\right\|^{2}$ (3)
where, $\hat{\mathrm{y}}_{\mathrm{i}}^{\mathrm{b}}$ is the regression objective obtained by the model; $\mathrm{y}_{\mathrm{i}}^{\mathrm{b}}$ are the real coordinates.
For facial landmark location, the detection process is a regression problem. For each task $\mathrm{x}_{\mathrm{i}}^{\mathrm{t}}$, the minimum Euclidean loss was introduced:
$\mathrm{F}_{\mathrm{i}}^{1}=\left\|\hat{y}_{\mathrm{i}}^{1}-\mathrm{y}_{\mathrm{i}}^{\mathrm{I}}\right\|^{2}$ (4)
where, $\hat{\mathrm{y}}_{\mathrm{i}}^{\mathrm{l}}$ are the coordinates of landmark point obtained by the model; $\mathrm{y}_{\mathrm{i}}^{1}$ are the real coordinates of the i-th task.
Through the training, the positions of five landmark points were detected, including left eye, right eye, nose, left mouth corner and right mouth corner.
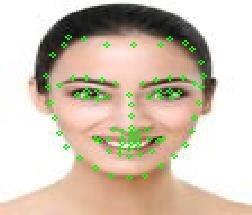
In this paper, the multi-task facial landmark database [22] is used to train the facial landmark location model. This database contains more than 12,000 labeled face images. Each face was divided into 32 regions using 68 landmark points (Figure 2). The 32 regions (Figure 3) were taken as the facial regions of interests (ROIs), which contain the landmark features of muscle movement of micro-expression.
Figure 2. The 68 landmark points
Figure 3. The 32 regions
The optical-flow features can identify the motion of each pixel based on the real-time changes of the pixel and its neighbors in the image sequence. This algorithm provides a desirable tool to describe the motion of facial muscle in micro-expression.
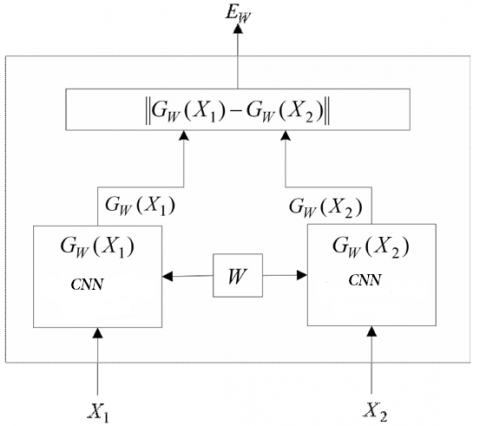
In this paper, the optical-flow features are extracted by a DNN that couples two CNNs, namely, FlowNetS and FlowNetC. In the FlowNetS, an image is inputted to extract the optical-flow feature. In the FlowNetC (Figure 4), two images of identical structure are inputted X1 and X2, and combined in the correlation layer. If the two images fall in the same class, the output Y will be 1; otherwise, the output Y will be 0.
There are numerous feature vectors in each video. If the original features of each ROI are directly used, the video will have an excessively large feature dimension. Since the micro-expression is weak in intensity, the extremely large feature dimension must contain many redundant features. Therefore, the redundant features were reduced as follows to improve the extraction of optical-flow feature.
Figure 4. Structure of FlowNetC
For a video frame sequence, the optical-flow features between the first frame f1 and any other frame fi can be defined as:
$\left[\mathrm{a}_{\mathrm{x}}^{\mathrm{i}}, \mathrm{b}_{\mathrm{y}}^{\mathrm{i}}\right]$ (5)
where, i=1,..., n is the serial number of each frame; x and y are the coordinates of a pixel in a frame; a and be are the horizontal and vertical components of the optical-flow feature vector, respectively.
Then, an optical-flow feature can be expressed in polar coordinates ($\rho_{i}, \theta_{i}$), where $\mathbf{p}_{\mathbf{i}}$ and $\theta_{i}$ are the value and direction of the optical-flow feature vector, respectively. According to our facial landmark location model, the face in each frame was divided into 32 regions, k=1,..., 32.
The set of optical-flow features of all positions $\mathrm{I} \in \mathrm{R}_{\mathrm{i}}^{\mathrm{k}}$ on a frame can be expressed as $\mathrm{U}_{\mathrm{i}}^{\mathrm{k}}(\mathrm{l})=\left(\rho_{\mathrm{i}}^{\mathrm{k}}(\mathrm{l}), \theta_{\mathrm{i}}^{\mathrm{k}}(1)\right)$. Meanwhile, the direction $\theta_{i}^{k}(1)$ based on optical-flow feature was encoded in eight directions. For the encoded features, only the direction with the largest proportion in the direction-based coding was selected. The optical-flow features in the direction with the largest proportion were selected and averaged, while the optical-flow features in other directions in the direction-based coding were eliminated. The calculation in each region can be expressed as:
$\overline{\mathrm{U}}_{\mathrm{i}}^{\mathrm{k}}=\frac{1}{\left|\mathrm{s}_{\max }\right|} \sum_{\mathrm{U}_{\mathrm{i}}^{\mathrm{k}}(\mathrm{I}) \in \mathrm{S}_{\max }} \mathrm{U}_{\mathrm{i}}^{\mathrm{k}}(1)$ (6)
where, Smax is the vector set with the largest proportion in the direction-based coding.
Considering the lack of specific proportion of each feature, the specific proportion information of Smax was added in each region. Thus, the feature of ROI $\mathrm{R}_{\mathrm{i}}^{\mathrm{k}}$ can be expressed as a feature vector $W_{i}^{k}=\left(\bar{U}_{i}^{k}, \rho_{i}^{k}\right)$. Then, the features of the i-th frame can be defined as:
$\varphi_{\mathrm{i}}=\left(\mathrm{W}_{\mathrm{i}}^{1}, \mathrm{W}_{\mathrm{i}}^{2}, \ldots, \mathrm{W}_{\mathrm{i}}^{32}\right)$ (7)
The optical-flow features extracted from each frame were taken as the features of the micro-expression video. Based on the improved optical-flow features, the micro-expression recognition algorithm can be implemented in the following steps:
Step 1: Cut the face image from the database, and input it into the face landmark location model to detect the landmark points. Three color channels are reserved for each input image.
Step 2: Save the 68 facial landmark points output by the model, and discard the other outputs. Then, divide the face into 32 ROIs based on the positions of the 68 landmark points.
Step 3: Combine the first frame f1 and any other frame fi of the micro-expression video into a pair, in which each frame contains three color channels. Input the frame pairs into the FlowNet, compare them with the first frame, and predict the optical-flow features of each frame.
Step 4: After obtaining the optical-flow features, select the features in each ROI, and calculate the features of each frame by the improved algorithm of optical-flow features, yielding the optical flow features of each video.
Step 5: Recognize the micro-expression by the SVM with polynomial kernel function.
Our micro-expression recognition algorithm was verified through experiments on two video micro-expression databases: Spontaneous Micro-Expression Database (SMIC) and the CASMEII. The former database contains 164 micro-expression videos of 16 subjects. The micro-expressions in this database fall into four classes: positive, negative, surprise and others. Meanwhile, the CASMEII contains 247 micro-expression videos of 26 subjects. The micro-expressions in this database are divided into five categories: happiness, surprise, disgust, repression and others.
First, our micro-expression recognition algorithm, which is based on improved optical-flow features, was compared with the algorithm based on original optical-flow features, in terms of the recognition rates with different coding number in the two databases.
Table 1. The recognition rates with different coding number in SMIC
|
|
N=4 |
N=5 |
N=6 |
N=7 |
N=8 |
N=9 |
N=10 |
|
Original feature |
51.27% |
51.38% |
52.18% |
51.16% |
52.01% |
51.35% |
51.13% |
|
Improved feature |
56.87% |
56.88% |
56.62% |
56.56% |
59.11% |
58.36% |
56.71% |
|
|
N=4 |
N=5 |
N=6 |
N=7 |
N=8 |
N=9 |
N=10 |
|
Original feature |
51.83% |
52.29% |
53.05% |
53.51% |
52.96% |
52.58% |
51.98% |
|
Improved feature |
57.71% |
57.59% |
57.60% |
57.63% |
59.37% |
58.16% |
57.21% |
As shown in Table 1 and Table 2, the best recognition rates of the micro-expression recognition algorithm based on improved optical-flow features in the two databases were 59.11% and 59.37%, respectively. The results are obviously superior to those of the algorithm based on original optical-flow features. Therefore, micro-expression recognition algorithm based on improved optical-flow features has better recognition ability than the algorithm based on original optical-flow features in both two databases.
Of course, the recognition rate alone cannot fully demonstrate the recognition performance. Thus, the confusion matrices of our algorithm on the two databases were obtained (Tables 3 and 4). The confusion matrix can clearly reveal the recognition condition of each type of micro-expression.
As shown in Tables 3 and 4, the proposed algorithm achieved great improvement in the aspects of happiness, disgust and surprise.
Table 3. The confusion matrix on SMIC
|
Label |
Prediction |
||||
|
|
Positive |
Negative |
Surprise |
Others |
|
|
Positive |
45.86 |
0 |
3.86 |
42.09 |
|
|
Negative |
3.18 |
47.92 |
0 |
47.19 |
|
|
Surprise |
11.12 |
0 |
0 |
40.54 |
|
|
Others |
7.18 |
16.18 |
2.96 |
56.72 |
|
Table 4. The confusion matrix on CASMEII
|
Label |
Prediction |
|||||
|
|
Happiness |
Surprise |
Disgust |
Repression |
Others |
|
|
Happiness |
68.72 |
0 |
3.15 |
0 |
27.23 |
|
|
Surprise |
10.87 |
59.62 |
0 |
0 |
28.87 |
|
|
Disgust |
1.62 |
0 |
56.73 |
0 |
43.46 |
|
|
Repression |
0 |
0 |
0 |
77.79 |
11.98 |
|
|
Others |
7.05 |
3.15 |
18.87 |
2.08 |
69.17 |
|
Table 5. Comparative results between mainstream micro-expression recognition algorithms and our algorithm
|
Algorithm |
Accuracy |
|
LBP-TOP [23] |
40.09% |
|
CNN-LSTM [24] |
62.19% |
|
STRCN-A [25] |
56.82% |
|
ELRCN-SE [26] |
48.21% |
|
CLBP-TOP (S+M) [27] |
45.92% |
|
Our algorithm |
58.39% |
Taking CASMEII as the experimental dataset, our algorithm was then compared with several mainstream micro-expression recognition algorithms. The comparative results are shown in Table 5. It can be seen that our algorithm correctly recognized 58.39% of all micro-expressions, more than most of the contrastive algorithms. The good performance is attributable to the fact that the optical-flow features extracted from the ROIs contain more useful information than those extracted directly by the CNN.
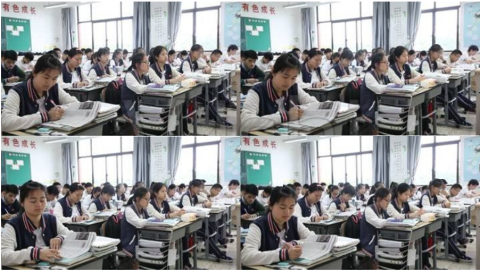
The proposed algorithm was applied to identify the micro-expressions of students in classroom, and evaluate how concentrated they are in class. To capture the facial changes of students, a high-definition camera was adopted. The video frames thus collected are shown in Figure 5.
Figure 5. Sample of collection results
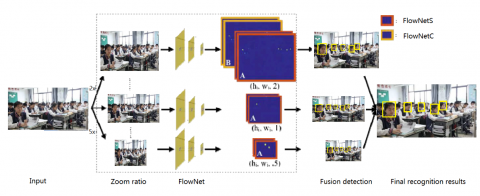
During face detection, the video was decomposed into frames to extract effective images. Once a valid image was obtained, the proposed micro-expression recognition algorithm based on improved optical-flow features was applied to recognize the facial expressions of students. The structure of facial expression recognition model is explained in Figure 6. The detected facial expressions are presented in Figure 7.
Figure 6. Structure of facial expression recognition model
Figure 7. The detected facial expressions
Based on micro-expressions in classroom, the 3D learning state space was combined with emotional dimension theory, and the emotions were divided into pleasure dimension, interest dimension and arousal dimension. Thus, the classroom learning state is divided into 11 dimensions (Table 6).
Table 6. Classroom learning state
|
Emotional dimension |
Facial expression |
|
Pleasure dimension |
Angry |
|
Confused |
|
|
Sad |
|
|
Disgust |
|
|
Contempt |
|
|
Surprise |
|
|
Happy |
|
|
Fear |
|
|
Neutral |
|
|
Arousal dimension |
Arousal |
|
Interest dimension |
Valence |
The course score was calculated by the evaluation method. Then, the concentration of students can be rated. According to the scores, the classroom state was divided into four levels: strongly unconcentrated, unconcentrated, concentrated and strongly concentrated.
To verify the rationality of our method, a 10min long classroom video of students was selected and decomposed into images at the interval of one frame. Five students were chosen for tracking analysis, and the score rated by our model on students’ concentration was compared with the scores rated by four experienced teachers. The two types of scores are listed in Table 7. The results show that the model score is positively correlated with the teacher scores, indicating the rationality of our model in the zoning of students’ concentration.
Table 7. Teacher scores and model score
|
Student |
Teacher A |
Teacher B |
Teacher C |
Teacher D |
Model score |
|
Student 1 |
66 |
68 |
69 |
72 |
68 |
|
Student 2 |
69 |
72 |
70 |
73 |
70 |
|
Student 3 |
68 |
66 |
67 |
69 |
66 |
|
Student 4 |
69 |
70 |
70 |
72 |
69 |
This paper mainly designs a micro-expression recognition algorithm for students in classroom learning based on the CNN. First, the multi-task DNN was used to detect the landmark points on human face. The detection accuracy is guaranteed by the multi-task DNN, because the network considers the various factors that may affect the location of the landmark points. Based on the detected landmark points, the face image was divided into multiple ROIs according to the muscle motion of micro-expression. In these ROIs, the optical-flow features were extracted by a hybrid DNN. The redundant features were removed and the dimension was reduced to improve the optical-flow features, making the facial micro-expression recognition more accurate. The effectiveness of our model was verified through the application in the actual classroom.
This paper is supported by National Natural Science Foundation of China (Grant No.: 71871106), Jiangsu Provincial Social Science Foundation (Grant No.: 18GLD014), the Fundamental Research Funds for the Central Universities (Grant No.: 2019JDZD06) and Chinese University Research Foundation for Young Scholars (Grant No.: JUSRP11882).
[1] Tseng, C.H., Chen, Y.H. (2018). A camera-based attention level assessment tool designed for classroom usage. Journal of Supercomputing, 74(11): 5889-5902. http://dx.doi.org/10.1007/s11227-017-2122-7
[2] Saneiro, M., Santos, O.C., Salmeron-Majadas, S., Boticario, J.G. (2014). Towards emotion detection in educational scenarios from facial expressions and body movements through multimodal approaches. The Scientific World Journal, 2014: 1-14. http://dx.doi.org/10.1155/2014/484873
[3] Katzir, M., Eyal, T., Meiran, N., Kessler, Y. (2010). Imagined positive emotions and inhibitory control: The differentiated effect of pride versus happiness. Journal of Experimental Psychology: Learning, Memory, and Cognition, 36(5): 1314-1320. https://doi.org/10.1037/a0020120
[4] Ong, A.D., Burrow, A.L., Fuller-Rowell, T.E. (2012). Positive emotions and the social broadening effects of Barack Obama. Cultural Diversity and Ethnic Minority Psychology, 18(4): 424-428. https://doi.org/10.1037/a0029758
[5] Miljković, D., Rijavec, M. (2009). The significance of positive emotions in education. Napredak: Časopis za Pedagogijsku Teoriju i Praksu, 150(3-4): 488-506. https://hrcak.srce.hr/82831
[6] Yan, W.J., Li, X., Wang, S.J., Zhao, G., Liu, Y.J., Chen, Y.H., Fu, X. (2014). CASME II: An improved spontaneous micro-expression database and the baseline evaluation. Plos One, 9(1): e86041. https://doi.org/10.1371/journal.pone.0086041
[7] Sariyanidi, E., Gunes, H., Cavallaro, A. (2017). Learning bases of activity for facial expression recognition. IEEE Transactions on Image Processing, 26(4): 1965-1978. https://doi.org/10.1109/TIP.2017.2662237
[8] Borza, D., Danescu, R., Itu, R., Darabant, A. (2017). High-speed video system for micro-expression detection and recognition. Sensors, 17(12): 2913-2929. https://doi.org/10.3390/s17122913
[9] Li, Y.L., Guan, Y.P. (2015). Human face orientation based non-wearable and natural human-computer interaction. Acta Electronica Sinica, 43(8): 1583-1588. https://doi.org/10.3969/j.issn.0372-2112.2015.08.017
[10] Lung, S.Y. (2008). Feature extracted from wavelet decomposition using biorthogonal Riesz basis for text-independent speaker recognition. Pattern Recognition, 41(10): 3068-3070. https://doi.org/10.1016/j.patcog.2008.03.020
[11] Li, X., Hong, X., Moilanen, A., Huang, X., Pfister, T., Zhao, G., Pietikäinen, M. (2017). Towards reading hidden emotions: A comparative study of spontaneous micro-expression spotting and recognition methods. IEEE Transactions on Affective Computing, 9(4): 563-577. https://doi.org/10.1109/TAFFC.2017.2667642
[12] He, J., Hu, J.F., Lu, X., Zheng, W.S. (2017). Multi-task mid-level feature learning for micro-expression recognition. Pattern Recognition, 66: 44-52. https://doi.org/10.1016/j.patcog.2016.11.029
[13] Wang, S.J., Wu, S., Qian, X., Li, J., Fu, X. (2017). A main directional maximal difference analysis for spotting facial movements from long-term videos. Neurocomputing, 230: 382-389. https://doi.org/10.1016/j.neucom.2016.12.034
[14] Dung, N.M., Kim, D., Ro, S. (2018). A video smoke detection algorithm based on cascade classification and deep learning. KSII Transactions on Internet and Information Systems, 12(12): 6018-6033. https://doi.org/10.3837/tiis.2018.12.022
[15] Tripathy, R.K., Bilionis, I. (2018). Deep UQ: Learning deep neural network surrogate models for high dimensional uncertainty quantification. Journal of Computational Physics, 375: 565-588. https://doi.org/10.1016/j.jcp.2018.08.036
[16] Kim, D.H., Baddar, W.J., Jang, J., Ro, Y.M. (2017). Multi-objective based spatio-temporal feature representation learning robust to expression intensity variations for facial expression recognition. IEEE Transactions on Affective Computing, 10(2): 223-236. https://doi.org/10.1109/TAFFC.2017.2695999
[17] Jain, D.K., Zhang, Z., & Huang, K. (2018). Random walk-based feature learning for micro-expression recognition. Pattern Recognition Letters, 115: 92-100. https://doi.org/10.1016/j.patrec.2018.02.004
[18] Zhao, Y. (2017). Research on the diversified evaluation index system and evaluation model of physical education teaching in colleges and universities. Journal of Computational and Theoretical Nanoscience, 14(1): 99-103. https://doi.org/10.1166/jctn.2017.6132
[19] D’Mello, S. (2012). Monitoring affective trajectories during complex learning. Encyclopedia of the Sciences of Learning, 2325-2328. https://doi.org/10.1007/978-1-4419-1428-6_849
[20] Tong, Y., Chen, J., Ji, Q. (2008). A unified probabilistic framework for spontaneous facial action modeling and understanding. IEEE Transactions on Pattern Analysis and Machine Intelligence, 32(2): 258-273. https://doi.org/10.1109/TPAMI.2008.293
[21] Huang, C.L., Huang, Y.M. (1997). Facial expression recognition using model-based feature extraction and action parameters classification. Journal of Visual Communication and Image Representation, 8(3): 278-290. https://doi.org/10.1006/jvci.1997.0359
[22] Bian, P., Xie, Z., Jin, Y. (2018). Multi-task feature learning-based improved supervised descent method for facial landmark detection. Signal, Image and Video Processing, 12(1): 17-24. https://doi.org/10.1007/s11760-017-1125-4
[23] Guo, Y., Zhao, G., Zhou, Z., Pietikäinen, M. (2013). Video texture synthesis with multi-frame LBP-TOP and diffeomorphic growth model. IEEE Transactions on Image Processing, 22(10): 3879-3891. https://doi.org/10.1109/TIP.2013.2263148
[24] Huang, C.J., Kuo, P.H. (2018). A deep CNN-LSTM model for particulate matter (PM2. 5) forecasting in smart cities. Sensors, 18(7): 2220-2232. https://doi.org/10.3390/s18072220
[25] Peng, M., Wang, C., Chen, T., Liu, G., Fu, X. (2017). Dual temporal scale convolutional neural network for micro-expression recognition. Frontiers in Psychology, 8: 1745-1757. https://doi.org/10.3389/fpsyg.2017.01745
[26] Huang, X., Zhao, G., Hong, X., Zheng, W., Pietikäinen, M. (2016). Spontaneous facial micro-expression analysis using spatiotemporal completed local quantized patterns. Neurocomputing, 175: 564-578. https://doi.org/10.1016/j.neucom.2015.10.096
[27] Holden, E., Calvo, G., Collins, M., Bell, A., Reid, J., Scott, E.M., Nolan, A.M. (2014). Evaluation of facial expression in acute pain in cats. Journal of Small Animal Practice, 55(12): 615-621. https://doi.org/10.1111/jsap.12283