Muhammad K. Asy’ari![]() | Azizah L. Nugraha | Alfin Sahrin
| Azizah L. Nugraha | Alfin Sahrin![]() | Tajuddin A. Rafi | Katherin Indriawati
| Tajuddin A. Rafi | Katherin Indriawati![]() | Ali Musyafa*
| Ali Musyafa*![]()
© 2023 IIETA. This article is published by IIETA and is licensed under the CC BY 4.0 license (http://creativecommons.org/licenses/by/4.0/).
OPEN ACCESS
The prediction of the general national electricity plan has stated that Indonesia's electricity needs in 2038 will increase to 1,000 TWh or the equivalent of 3.3 MWh per capita. If this trend continues, then by 2050, per capita energy consumption is expected to reach 7.7 MWh or 2,600 TWh. This prediction is important because it is to prepare power plant infrastructure throughout the region for the coming period.By applying and adding learning algorithms based on Convolutional Neural Networks (CNN) to developing solar power plants, CNN-based Forecast can increase accuracy by up to 30% and has the ability to train models up to 2 times faster than currently available algorithms. This new algorithm can more accurately detect leading demand indicators, such as pre-order information, increased product demand, price changes, and promotional spikes, to build more accurate forecasts.That before the discovery of CNN there was no algorithm that provided the most accurate estimates for all types of data. Traditional statistical models have been useful in predicting the demand for products that have regular demand patterns, such as summer or winter electricity production. However, statistical models cannot provide accurate forecasts for more complex scenarios, such as frequent changes in energy prices, differences between regional versus national demand, products with different selling speeds, and additions of new products.As for CNN, it is appropriate to predict the power from the panel, with a MAPE performance value of 18.7633%, MAE of 0.0176 and RMSE of 0.0466 so that the prediction system built has fulfilled the prediction of the targeted system.
CNN, correlation coefficient, solar panel, electric power prediction, ambient temperature
Solar panels can generate electricity depending on the intensity of sunlight. In addition, temperature, humidity and other environmental parameters affect the energy conversion process. Commercial solar panels are widely available in the market. The price depends on the selling capacity of diesel and materials that determine the performance of the generator. Monocrystalline and polycrystalline based solar panels are made of semiconductor materials. Taking into account the environmental parameters on solar panels will then be evaluated. The results show that monocrystalline outperforms polycrystalline. Monocrystalline output voltage, current and power are higher than polycrystalline. Monocrystalline solar panels are also more stable against environmental changes. This is how efficiency stability is concerned. To design a reliable prediction system, a relatively new and AI-based methodology, namely CNN, is needed. Currently Forecast with CNN can improve accuracy by up to 30% and train models up to 2X faster than currently supported algorithms.
Indonesia is committed to achieving net zero emissions. In this case, Indonesia has announced that it will meet the maximum net zero emission in 2060. The Indonesian government promises that the amount of CO2 will be reduced through the National Determined Contribution (NDC). This ambitious commitment needs the contribution of the energy sector. Indonesia officially launched the Energy Transition Mechanism (ETM) Country Platform during the last G20 Summit. The government said, a platform that creates an accelerated transformation while remaining fair and affordable in the energy sector. In addition to ETM, commitment to energy transition is realized through policy revitalization to create the right investment climate for the upstream industry. By increasing the ability to produce the right energy mix in Indonesia. A successful transition for Indonesia will definitely require coordination between policy, technology, science and capital. Fossil energy is a source of energy that comes from dead organisms that have been buried in the ground for thousands of years. Fossil energy consists of petroleum, natural gas, and coal [1].
Fossil energy itself has several weaknesses, including limited amounts as an energy source [2]. In addition, burning fossil energy will produce greenhouse gases, such as CO2, CH4, and N2O and water vapor, which can cause global warming [3]. Therefore, we need alternative sources of energy that are more environmentally friendly to reduce human dependence on fossil energy. Currently, energy needs are dominated by electrical energy. This is supported by data from the Indonesian Ministry of Energy and Mineral Resources, that in 2016 Indonesia's electricity consumption has reached 956 kWh per capita. Meanwhile, in 2018 electricity consumption in Indonesia has increased to 1,064 kWh per capita and as of September 2021 it has increased again to 1,203 kWh per capita [4]. The ever-increasing consumption of electricity triggers the urgency of using large amounts of power plants, of which 63% of the world's power plants use fossil fuels [3].
In dealing with environmental damage caused by fossil energy, the Government of the Republic of Indonesia is committed to achieving Net Zero Emissions (NZE) which is achieved through increasing the use of new renewable energy, one of which is solar energy [5]. Solar energy is one of the most important sources of renewable energy due to its availability, environmental friendliness and low cost [2]. Currently, several uses of solar energy are being developed and solar panels are of concern to scientists in the world because of their rapid development. In its use, solar panel systems pay more attention to the distribution network, the effect of PV degradation on the stability of the distribution system, power leakage and reliability [6]. There is a challenge to maintain the performance of solar panels based on standard test conditions (STC) amid changing environmental conditions [7]. Increasing the urgency of designing a solar panel output power prediction system.
Several previous studies have been proposed, with various methods such as Long Short-Term Memory, Random Forest Trees, Artificial Neural Networks, Support Vector Regression and Convolutional Neural Networks. This research will design a monocrystalline solar panel electric power production prediction system using the CNN artificial neural network method. Correlation values are also calculated using the Pearson's method to determine the relationship between quantitative variables in the form of meteorological variables and output variables in the production of solar panel electricity [8]. The prediction system that has been created will be evaluated for performance using the Mean Absolute Error (MAE), Mean Absolute Percentage Error (MAPE), and Root Mean Square Error (RMSE).
2.1 Solar electricity
Excessive radiation contact on the panel can increase the temperature of the solar panel and reduce the production of electric power due to a decrease in the electric current that is produced by the solar panel. Efforts to maintain electricity production according to the panel temperature setpoint can be controlled by providing sufficient wind and maintenance, so that photovoltaic reliability is maintained. Solar power is a power plant that utilizes solar energy to be used as electrical energy using direct media using solar panels and indirectly by concentrating solar energy [9-11]. Solar panels or solar panels are able to convert sunlight into electric current. Solar energy is used as an energy source because it has unlimited sustainable properties [12, 13]. Therefore, electricity with solar power is an alternative energy that is sustainable and can be used as the main energy.
2.1.1 Solar panels
Solar panels are semiconductor devices that convert light energy (photons) into DC (direct current) electricity or direct current using crystalline silicon (Si) semiconductor materials [14-16]. Solar panels are a combination of photo and voltaic which means light and voltage [14]. The silicon cells will be installed in series in a panel made of stainless aluminum and protected by plastic glass or self-cleaning material.
The sun emits light with different wavelengths from 250 nm to 2500 nm in the form of ultra violet (UV), infrared and visible light. Not all rays can directly reach the earth because the atmosphere reduces the light spectrum that enters the earth [17, 18]. The amount of current generated from the solar panel depends on the amount of light energy (photons) that reaches the solar panel and depends on the area of the solar panel. In order for the efficiency of solar panels to be high, photons must be absorbed as much as possible, then reduce reflections and increase the conductivity of solar panel materials [19-21].
2.1.2 Working principles of solar panels
Solar panels work using the p-n junction principle which is found in p and n type semiconductors. In the atomic structure, the n-type semiconductor has an excess of electrons (negative charge) and the p-type has an excess of holes (positive charge). The difference in charge at the p-n junction is known as the depletion region [22-24]. When the p-n junction is exposed to sunlight, the electrons will bounce through the photon gap to the conduction band and leave the proton. Because it is influenced by intrinsic potentials and junctions which cause electrons and protons to move in opposite directions and generate voltages that produce electrical energy in Figure 1 [22, 25, 26].
Figure 1. Structure of layer solar panel [13]
The solar panel module generates electrical power depending on the total incident solar radiation on the surface of the GT solar panel [27-29]. The equation for the solar panel module to generate power is calculated according to the following Eq. (1).
YPV is the capacity of the solar panel module (power output under STC conditions), fPV is the reduction factor of the solar panel power introduced by considering the additional factors affecting the solar panel (lossess, shading, dust) and G(T,STC) is the incident radiation on standard test conditions (STC) [27-29].
$P_{P V}=Y_{P V} f_{P V}\left(\frac{\bar{G}_T}{\bar{G}_{T, S T C}}\right)$ (1)
The solar panel current (I_ph) is directly proportional to the amount of radiation G and temperature T (Revati & Natarajan, 2020), where the equation for the current of the solar panel module can be modeled mathematically as Eq. (2).
$I_{p h}=\left\lceil I_{s c \left(T_{r e f}\right)}+K_i\left(T-T_{r e f}\right) \times \frac{G}{G_{r e f}}\right\rceil$ (2)
Isc(Tref) is the short circuit current of the solar panel at the reference temperature (Tref). Gref is the radiation provided by the solar panel supplier. T is the temperature in degrees Kelvin. Ki is the current constant which can be seen in the following Eq. (3).
$K_i=\frac{I_{s c(T)} \quad-I_{s c\left(T_{r e f}\right)}}{T-T_{r e f}}$ (3)
2.1.3 Solar radiation
Solar radiation plays an important role in the energy produced by solar panels. The recommended average value of solar radiation outside the Earth's atmosphere is 13661 W/m2 which is used as the solar constant [30-32]. The total energy that reaches the earth's surface is the solar constant minus the radiation due to atmospheric absorption and reflection before reaching the earth. Solar radiation that reaches the earth is called direct radiation and scattered radiation emitted by dust, gas molecules and water vapor in the atmosphere is called diffuse radiation [22, 33, 34]. Direct and scattered radiation measurements from the sun can be carried out using the RK900-11 weather station.
Weather station RK900-11 is a civil integrated weather station developed by Hunan Rika Electronic Tech Co. This weather station can measure several meteorological parameters at once, namely solar irradiation, ambient temperature, environmental humidity, wind speed, wind direction, air pressure, and rainfall [34, 35].
2.1.4 Photovoltaic panel
Monocrystalline is a type of silicon-based solar panel that is widely used with an efficiency of up to 17% -18%. High efficiency is achieved because monocrystalline produces the highest electrical power per unit area among other types. This type has the characteristic black color because it comes from pure silicon. The distinctive feature of this type is that it has an octagonal shape (rectangle but all four blades are cut). The weakness of monocrystalline is that it does not work well when placed in areas with little sun exposure which causes its efficiency to drop. The advantage is that at high sun intensity it can increase its efficiency and work better than other types and is suitable for relatively narrow land [14, 36].
2.1.5 Factors influencing solar panel performance
The solar panels work by utilizing photon energy. This can be understood when light is considered as a particle with energy emitted by light with the speed of light (c) and a certain wavelength which is formulated in the following Eq. (4) [30].
$\lambda . E=h . c$ (4)
where:
$h$ = konstanta Plancks $\left(6,62 \cdot 10^{-34} \mathrm{~J} \cdot \mathrm{s}\right)$
c = Speed of light in a vacuum $\left(3.10^8\right)$
E = Energy
λ = the wavelength of light
In solar panels, there are other factors that affect the output power generated by solar panels, namely the temperature of the solar panel module, humidity or humidity, and wind speed.
2.2 Temperature
The temperature of the solar panel module has an important role to calculate and predict the characteristics of the resulting current and voltage. In general, solar panel modules under normal conditions have a temperature of 25℃. However, the effect of increasing temperature will reduce the voltage value linearly. Each increase in the temperature of the solar module by 1℃ from 25℃ will result in a 0.5% reduction in the power generated. To calculate the amount of power that is reduced due to an increase in temperature, the following formula can be used Eqs. (5)-(6). [21, 36].
$f_{\text {temp }}=\left[1+\alpha_P\left(T_c-T_{c, S T C}\right)\right]$ (5)
$T_c=T_a+I_T\left(\frac{T_{c, N O C T}\quad-T_{a, N O C T}}{I_{T, N O C T}}\right)\quad \left(1-\frac{\eta_c}{\tau \alpha}\right)$ (6)
where:
Ta = ambient temperature (℃)
Tc,NOCT = normal operating temperature of the panel (℃)
Ta,NOCT = ambient temperature under normal conditions (20℃)
IT,NOCT = amount of sunlight irradiation under normal conditions (0.8 kW/m2)
2.3 Performance evaluation matrix
In doing the calculation, there are several ways to calculate the performance level of the model. This method is used according to the type and form of existing data in Eq. (7).
$M A P E=\left(\sum_{i=1}^N\left|\frac{y(i)-y^{\prime}(i)}{y(i)}\right|\right) / N$ (7)
Mean Absolute Percentage Error (MAPE)/ Symmetrical MAPE. Is the absolute average of the percentage error obtained from predictions made previously. MAPE can be calculated using the following Eq. (7), In this equation y(i) is the actual power data value and y'(i) is the forecast value in period t, and N is the amount of data forecast. The lower the MAPE value, the better the performance of the prediction model used, and there are several MAPE values that can be used as a benchmark for the performance measurement of the predictive model as shown in the Table 1.
Table 1. MAPE value range
|
Range |
MAPE Description |
|
<10% |
Very good predictive model competency |
|
10-20% |
Competence of good prediction models |
|
20-50% |
Competence of predictive models is feasible |
|
>50% |
Poor prediction model competency |
2.3.1 Mean Absolute Error (MAE)
Is the average difference between the actual data value and the absolute predicted value. MAE can be calculated using the following Eq. (8).
$M A E=\left(\sum_{i=1}^N\left|y(i)-y^{\prime}(i)\right|\right) / N$ (8)
In this equation y(i) is the actual power data value and y'(i) is the forecast value in period t, and N is the amount of data forecast. The smaller the MAE value, the better the prediction performance of the model. In this study, the largest MAE tolerance limit was determined, namely 0.5 [32].
2.3.2 Root Mean Square Error (RMSE)
Is the average difference between the actual data value and the predicted value squared. RMSE can be calculated using the following Eq. (9).
$R M S E=\sqrt{\frac{\left(\sum_{i=1}^N\quad\left[y(i)-y^{\prime}(i)\right]\quad^2\right)}{N-1}}$ (9)
In this equation y(i) is the actual power data value and y'(i) is the forecast value in period t, and N is the amount of data forecast. The smaller the RMSE value, the better the prediction performance of the model. In this study, the largest RMSE tolerance limit was determined, namely 1.1 in Table 2 [32].
Table 2. Specifications for monocrystalline solar panels
|
Description |
Monocrystalline |
|
Size |
1480×670×35mm |
|
Output Voltage |
22.1V |
|
Output Current |
8.69A |
|
Maximum Power |
150W |
2.3.3 Relationship the value Pearson
The following table interprets the relationship from the value of Pearson's correlation coefficient in Table 3 [31].
Teble 3. Relationship between Pearson correlation coefficient
|
Coeficien Interval |
Relationship |
|
0.800-1.000 |
very strong |
|
0.600-0.799 |
strong |
|
0.400-0.599 |
moderate |
|
0.200-0.399 |
weak |
|
0.000-0.199 |
very weak |
From the experiment it is known that an increase in the temperature of the panel will result in a decrease in the open circuit voltage (Voc) and the power generated by the solar panel decreases. temperature rise in solar panels also affects the efficiency of solar panel electricity. This is because Indonesia's position is on the equator and as a tropical country which causes the sun's rays to be quite large. the performance of solar panels is influenced by several dominant factors, namely solar radiation, so that the temperature of solar panels which increases due to solar radiation is selected for research. Data transformation is one of the basic steps in the data preprocessing section. When we first learn about feature scaling techniques, we are dealing with the terms scale, standardization, and normalization. Normalization is one of the most frequently used data preparation techniques. In ANN and data mining, this process helps us change the values of the numeric columns in the dataset to use a common scale. If we have ever dealt with databases, we are probably familiar with the term "data normalization". One of the challenges in databases is the existence of attributes with different units, ranges, and scales.
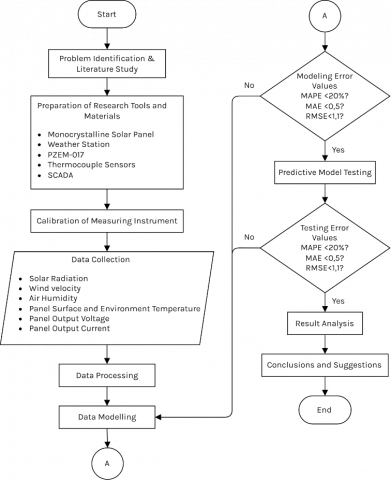
The choice of the method for predicting electrical energy needs uses the Artificial Neural Network method because the ANN method can be applied to non-linear and Multi-input-multi-output systems with much smaller errors compared to the Regression method where predictions are made with this method is one of the statistical methods used to predict autoregressive (AR) models with stationary data. With a limited number of input output connections.This research was conducted with the help of Microsoft Excel software and also MATLAB 2023a. The following is a flow chart (flowchart) of this study on Figure 2.
Figure 2. Flowchart of the research
3.1 Problem identification and literature study
Problem identification is obtained by conducting literature studies from reputable journals that focus on problems, methodology, and conclusions from journals to support the success of the research to be carried out. Problem Identification and Literature Study, Problem identification is obtained by conducting literature studies from reputable journals that focus on problems, methodology, and conclusions from journals to support the success of the research to be carried out.
3.1.1 Preparation of research tools and materials
The tools and materials consist of a monocrystalline solar panel with a capacity of 150Wp, a temperature sensor in the form of a K-type thermocouple as a panel surface temperature measuring instrument which is then connected to the Autonics TM-series TM4 temperature controller as a gateway, a weather station as a measuring instrument for environmental condition variables in the form of solar irradiation, ambient temperature, wind speed, and ambient air humidity, and measurement of current, voltage, and output power from solar panels using the PZEM-017 sensor [37]. The temperature controller instrument, weather station, and PZEM-017 will be connected in parallel with Modbus RS485 so that they can interact with Haiwell's data acquisition to obtain the desired data on Figure 3.
Figure 3. Block diagram of photovoltaic system
3.2 Data collection
Data collection was carried out at 08.15 to 18.15 WIB with intervals of each measurement for 5 minutes [38]. Data collection was carried out for 32 days, so that there were 32 groups of data that would be divided to train the model and test the model. These data were collected in Microsoft Excel software.
Data Processing, Data that has been taken in csv format is processed using the help of Microsoft Excel software to correct empty data by removing or filling in zeros. Data is also normalized with a range of 0-1 with the aim of eliminating or reducing data redundancies. Pearson's correlation test was carried out on each variable to determine the influence of changes in wind speed, temperature, and humidity on the production of electricity generated by solar panels.
3.2.1 Modeling of solar panel electricity production prediction system
Models or algorithms are created using machine learning to obtain power production results from solar panels. The data is divided into 3 consisting of 65% for training data, 15% of the total data for validation data and the remaining 20% for testing data. The architecture used is CNN-1D.
3.2.2 Prediction model testing and validation
Evaluation is carried out to determine the accuracy value of the prediction system that has been made. The use of MAPE, MAE, and RMSE evaluations has a maximum error threshold of 20%, 0.5 and 1.1, respectively. If the model has a MAPE value of > 20%, MAE > 0.5, and RMSE > 1.1, then modeling will be carried out again.
3.2.3 Analysis and discussion and conclusion
An analysis was carried out regarding the effect of changes in wind speed, temperature, and air humidity on the electricity production generated as well as the performance evaluation value of the prediction system. The process of drawing conclusions and giving suggestions on the research carried out to be continued in the process of preparing the report.
3.3 Data acquisition
To evaluate the final model which checks whether the model can generalize well, we usually divide the original dataset into training, test, and validation sets. Training set The training set is usually the largest — in terms of size — the set created from the original dataset and used for the fid model. In other words, the data points included in the training set are used to learn the desired model parameters. In the context of supervised learning, all training examples must include predictor variables (i.e., features) as well as the corresponding output variables (i.e., labels). During the training phase, you can use the correct labels to get training accuracy. It is then compared to the accuracy of the test to evaluate whether the model has been overfitted. Now the validation data set is useful for hyper parameter tuning and model selection. The validation examples included in this set will be used to find the optimal hyperparameter values of the model under consideration. Tests are used to evaluate the performance of these models and ensure that they generalize well to new, unseen data points. At this point, you should also compare test accuracy with training accuracy to ensure that the model is not overfitted. This is the case when the two accuracies are "close enough". When training accuracy significantly outperforms test accuracy, then there is a high probability of overfitting.
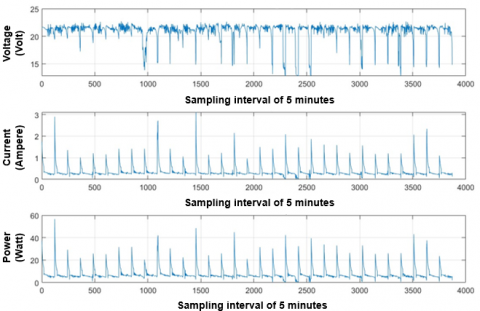
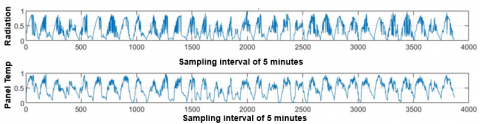
Data on measurements of irradiation and panel temperature as input for CNN as well as data for measuring voltage, current and panel output power were taken on March 13-April 13 2023 (32 days) at 08.15 to 18.15 WIB. Data is taken at intervals of every 5 minutes. 65% of the data (21 days) is used for training input, 15% of the data (5 days) as validation and 20% of the data (6 days) is used as a comparison of prediction results with measurements on Figures 4 and 5.
Figure 4. Irradiation data, and panel temperature for 32 days
Figure 5. PV voltage, current and power output for 32 days
Figure 6. Results of normalization of panel temperature and irradiation data for 32 days
Figure 7. Results of normalization of PV voltage, current, and power output data for 32 days
3.4 Data processing
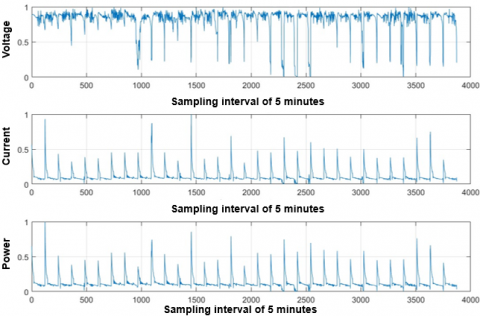
Data that has been obtained for 32 days is then processed first to facilitate learning of artificial neural networks, so data normalization is carried out on input and output data. The following is a visualization of the converted data in the data normalization process with a scale of 0-1 on Figures 6 and 7.
The normalized data is divided into 3 parts. The following is a visualization of the data division on Figure 8.
Period in 2023
Figure 8. Distribution of training, validation, and testing data
3.5 Correlation coefficient between input and output variables
Pearson's correlation coefficient is calculated with data from 2 battery conditions, namely the overall data where the battery in the absorption phase is also float and the filtered data is only when the battery is in float condition. Scatter graph visualization between variables using the overall data can be seen as follows on Figures 9 and 10.
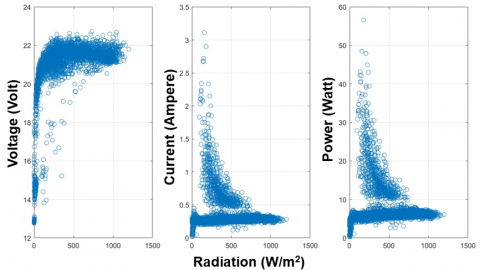
Figure 9. The relationship between solar radiation and voltage, current and power
Figure 10. Relationship between panel temperature and voltage, current and power
The method of classifying and knowing cross validation uses the K-Nearest Neighbor (KNN). K-nearest neighbors or knn is an algorithm that functions to classify a data based on learning data (train data sets), taken from k nearest neighbors (nearest neighbors). Where k is the number of nearest neighbors. Included in supervised learning, where the results of the new query instance are classified based on the majority of the proximity of the categories in the K-NN. The steps of the K-NN Algorithm are as follows: Determining the k parameter (number of closest neighbours), Calculating the square of the euclidean distance of the object to the given training data, Sorting result no. 2 in ascending order (in order from high to low value), Collecting category Y (Classification of nearest neighbors based on k values) and using the nearest neighbor category with the most majority, object categories can be predicted.
The intensity of solar radiation and ambient temperature affect the voltage and current generated by solar panels. The lower the intensity of solar radiation, the current and voltage generated by the panel will decrease. The high and low ambient temperatures around solar panels have contributed to changes in solar cells. From the test results in Cepu using monochrystalline silicon solar panels, if there is an increase in temperature, the electric voltage generated by the solar panel will decrease. Measurement of stage I at an increase in radiation of 1 Watt/m2 increases the voltage by 0.4371 volts, decreases the current by 0.1143 amperes and decreases the power by 0.0830 Watts. As for the panel temperature increase of 1 degree Celsius, the voltage produced by the panel increases by 0.4418 Volts, the current decreases by 0.2040 amperes, the power decreases by 0.1713 watts. In previous research several other process variables were tried, such as air humidity, wind speed, it turned out that the correlation value was relatively small. So in this report the effects of temperature and radiation are studied further. The intensity of solar radiation is a source of energy that is converted by solar cells into electrical energy, the amount of change in the intensity of solar radiation that arrives at the surface of the earth every hour/day; determine the relationship between the intensity of solar radiation with the temperature of the panel; determine the effect of changes in solar radiation intensity and panel temperature on the output power and efficiency of solar cells. The effect of changes in radiation intensity on the power and efficiency of solar cells is directly proportional.
4.1 Correlation coefficient
The results of the correlation coefficient values are obtained in the following Tables 4 and 5.
Table 4. Correlation value of each variable throughout the data for Coefficient Correlation Pearson’s
|
Process Variabel |
Voltage (V) |
Curent (A) |
Power (W) |
|
Radiation (Watt/m2) |
0.4371 |
-0.1143 |
-0.0833 |
|
Panel Temperature(ded.C) |
0.4418 |
-0.2040 |
-0.1713 |
Pearson's correlation coefficient is calculated for each input variable with output variables in the form of voltage, current, and power from the PV. The greatest correlation coefficient value was found in the relationship between ambient temperature and voltage of 0.5754 on float condition data. The value of the correlation coefficient of radiation with current increases with the float condition data compared to the overall data because the current is affected by the battery condition, the fuller the battery the smaller the current flows causing a decrease in panel efficiency.
Table 5. Correlation value of each variable throughout battery Float Charge Coefficient Correlation Pearson’s
|
Process Variabel |
Voltage (V) |
Curent (A) |
Power (W) |
|
Radiation (Watt/m2) |
0.4522 |
0.4510 |
0.5297 |
|
Panel Temperature(ded.C) |
0.4603 |
0.4858 |
0.5465 |
4.2 CNN training and validation process
Several parameters are used in each CNN-1D architecture to be used. Beginning with the creation of the input layer matrix data with window size 9, that is, a lot of data is used to predict 1 data afterwards and many variables are entered, namely power, irradiation, wind speed, air humidity, ambient temperature, panel temperature, and time. Then proceed to the convolution layer as the basic operation of CNN shown by Eq. (9) where the kernel is 5×1 with 1 stride or it can be called the number of steps the kernel moves and uses the default 'casual' padding from the software. The weight on the convolution layer follows the parameters used, namely 5×9×64 with a bias of 1×64. After the convolutional layer, there is an excitation layer as a non-linearity mapping layer with the aim of increasing (nonlinear) expression in the entire network.
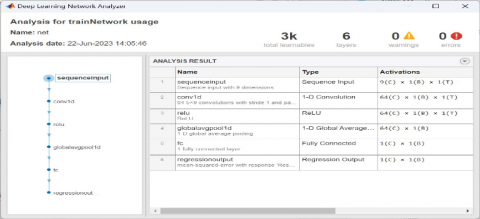
Figure 11. Arsitekture parameters on CNN
In this layer Re Lu is used to improve nonlinear expressions in the created network. Furthermore, the pooling layer uses 1-D global average pooling to average all prediction results together. Ends with a fully-connected layer as the "classifier" throughout the convolutional neural network. All neurons between the two layers have a weight to reconnect, use a weight of 1×64 according to the number of num filters and strides of the convolution layer with a bias of 1×1. In programming, 1 additional layer is added in the form of regression output to calculate the performance evaluation value, namely Mean Absolute Percentage Error (MAPE), Mean Absolute Error (MAE), and Root Mean Square Error (RMSE) 0n Figures 11 and 12.
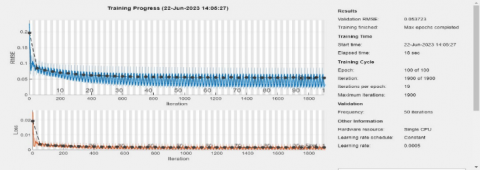
Figure 12. CNN prediction training and validation results
In training using the performance parameter Root Mean Square Error (RMSE) which has a value of 0.0537 below the maximum tolerance of 1.1 indicates the prediction system already has good performance.
4.3 CNN prediction results
After data training, the data is predicted using predictive data input in the form of irradiation, wind speed, air humidity, ambient temperature, and panel temperature with 20% of the total data. While the target is PV output power data of 20% of the total data. The prediction results can be seen in Figure 13. From the prediction results it can be seen that the predicted PV output power (red color) is close to the actual power (blue color). CNN is suitable for reading patterns from training, with the MAPE performance parameter value being 18.7633. MAE is 0.0176 and RMSE is 0.0466 on Figure 13.
Time Period 2023
Figure 13. Power production farcases by CNN
With the increasing number of electricity customers and the demand for electrical energy changing and increasing every year. To predict short-term electrical energy needs, this study uses the Artificial Neural Network convolution method. This research implies benefits for stakeholders to take action on the supply of electrical energy. With the discovery of the forcase method for certain locations, duplication of this method can be applied to solar power plant infrastructure planning in all corners of Indonesia. So that the efficiency of designer labor can be saved and the speed of calculations can be carried out more quickly and accurately. Distribution of new renewable energy generation can be well planned. Besides the success of the energy transition program, it is also the implementation of emission reduction programs.the relationship between ambient temperature and voltage of 0.5754 on float condition data. The value of the radiation correlation coefficient with current increases with the float condition data compared to the overall data because the current is affected by the battery condition, the fuller the battery the smaller the current flows causing a decrease in panel efficiency.The design results of the PV output power prediction system are close to the actual power, with a RMSE performance value of 0.0537. Meanwhile, CNN has correctly predicted the power from the panel, with a MAPE performance value of 18.7633%. MAE is 0.0176 and RMSE is 0.0466 so that the prediction system is interpreted to be good at making predictions.
The authors gratefully acknowledge financial support from the Institut Teknologi Sepuluh Nopember for this work, under project scheme of the Publication Writing and IPR Incentive Program (PPHKI) 2023.
|
CNN |
convolutional neural network |
|
E |
energy |
|
I |
current |
|
MAPE |
Mean Absolute Percentage Error |
|
MAE |
Mean Absolute Error |
|
P |
power |
|
PV |
photovoltaic |
|
REF |
reference |
|
RMSE |
root Mean Square Error |
|
SCIS |
short circuit current of the solar panel |
|
T |
the temperature in degrees Kelvin |
|
STC |
standard test conditions |
|
UV |
ultra violet |
|
Greek Symbols |
|
|
$h$ |
Plancks Constanta $\left(6,62 \cdot 10^{-34} \mathrm{~J} \cdot \mathrm{s}\right)$ |
|
c |
Speed of light in a vacuum $\left(3.10^8\right)$ |
|
λ |
the wavelength of light |
|
Subscripts |
|
|
a |
ambient (temperature ℃) |
|
NOCT |
normal operating temperature |
[1] Zou, C., Zhao, Q., Zhang, G., Xiong, B. (2016). Energy revolution: From a fossil energy era to a new energy era. Natural Gas Industry B, 3(1): 1-11. https://doi.org/10.1016/j.ngib.2016.02.001
[2] Irfan, M., Elavarasan, R.M., Hao, Y., Feng, M., Sailan, D. (2021). An assessment of consumers’ willingness to utilize solar energy in China: End-users’ perspective. Journal of Cleaner Production, 292: 126008. https://doi.org/10.1016/j.jclepro.2021.126008
[3] González-Torres, M., Pérez-Lombard, L., Coronel, J.F., Maestre, I.R., Yan, D. (2022). A review on buildings energy information: Trends, end-uses, fuels and drivers. Energy Reports, 8: 626-637. https://doi.org/10.1016/j.egyr.2021.11.280
[4] ESDM. (2021). Kuartal III 2021, Konsumsi Listrik Per Kapita Meningkat Capai 1.109 kWh. Directorate General of Electricity. https://www.esdm.go.id/en/berita-unit/directorate-general-of-electricity/kuartal-iii-2021-konsumsi-listrik-per-kapita-meningkat-capai-1109-kwh, accessed on July 14, 2023
[5] Aprilianto, R.A., Ariefianto, R.M. (2021). Peluang dan tantangan menuju Net Zero Emission (NZE) menggunakan Variable Renewable Energy (VRE) pada sistem ketenagalistrikan di Indonesia. Jurnal Paradigma, 2(2): 1-13.
[6] Al-Maghalseh, M. (2018). Experimental study to investigate the effect of dust, wind speed and temperature on the PV module performance. Jordan Journal of Mechanical and Industrial Engineering, 12(2): 123-129.
[7] Master, G.M. (2005). Renewable and efficient electric power systems. John Wiley & Sons.
[8] Zhong, J., Liu, L., Sun, Q., Wang, X. (2018). Prediction of photovoltaic power generation based on general regression and back propagation neural network. Energy Procedia, 152: 1224-1229. https://doi.org/10.1016/j.egypro.2018.09.173
[9] Armaroli, N., Balzani, V. (2016). Solar electricity and solar fuels: Status and perspectives in the context of the energy transition. Chemistry - A European Journal, 22(1): 32-57. https://doi.org/10.1002/chem.201503580
[10] Agga, A., Abbou, A., Labbadi, M., El Houm, Y. (2021). Convolutional neural network (CNN) extended architectures for photovoltaic power production forecasting. 2021 9th International Conference on Smart Grid and Clean Energy Technologies, ICSGCE 2021, 2021, Sarawak, Malaysia, pp. 104-108. https://doi.org/10.1109/ICSGCE52779.2021.9621717
[11] Al-Ghussain, L. (2018). Global warming: Review on driving forces and mitigation. Environmental Progress & Sustainable Energy, 33(3): 676-680. https://doi.org/10.1002/ep
[12] Gong, J., Li, C., Wasielewski, M.R. (2019). Advances in solar energy conversion. Chemical Society Reviews, 48(7): 1862-1864. https://doi.org/10.1039/c9cs90020a
[13] Aprillia, H., Yang, H.T., Huang, C.M. (2020). Short-term photovoltaic power forecasting using a convolutional neural network-salp swarm algorithm. Energies, 13(8): 1879. https://doi.org/10.3390/en13081879
[14] Sampaio, P.G.V., González, M.O.A. (2017). Photovoltaic solar energy: Conceptual framework. Renewable and Sustainable Energy Reviews, 74: 590-601. https://doi.org/10.1016/j.rser.2017.02.081
[15] Balat, M. (2007). Status of fossil energy resources: A global perspective. Energy Sources, Part B: Economics, Planning and Policy, 2(1): 31-47. https://doi.org/10.1080/15567240500400895
[16] Bhattacharya, T., Chakraborty, A.K., Pal, K. (2014). Effects of ambient temperature and wind speed on performance of monocrystalline solar photovoltaic module in Tripura, India. Journal of Solar Energy, 2014: 1-5. https://doi.org/10.1155/2014/817078
[17] Myori, D.E., Mukhaiyar, R., Fitri, E. (2019). Sistem tracking cahaya matahari pada photovoltaic. INVOTEK: Jurnal Inovasi Vokasional dan Teknologi, 19(1): 9-16. https://doi.org/10.24036/invotek.v19i1.548
[18] Halim, S., Wibisono, A.M. (2000). Penerapan jaringan saraf tiruan untuk peramalan. Jurnal Teknik Industri, 2(2): 106-114.
[19] Moot, T., Werner, J., Eperon, G.E., Zhu, K., Berry, J.J., McGehee, M.D., Luther, J.M. (2020). Choose your own adventure: Fabrication of monolithic all-perovskite tandem photovoltaics. Advanced Materials, 32(50): 1-22. https://doi.org/10.1002/adma.202003312
[20] Kober, T., Schiffer, H.W., Densing, M., Panos, E. (2020). Global energy perspectives to 2060 - WEC’s World Energy Scenarios 2019. Energy Strategy Reviews, 31: 100523. https://doi.org/10.1016/j.esr.2020.100523
[21] Kumar Panjwani, M., Bukshsh Narejo, G. (2014). Effect of humidity on the efficiency of solar cell (photovoltaic). International Journal of Engineering Research and General Science, 2(4): 499-503.
[22] Al-Waeli, A.H.A., Kazem, H.A., Chaichan, M.T., Sopian, K. (2019). Photovoltaic/Thermal (PV/T) Systems: Principles, Design, and Applications. Springer: Cham, Switzerland.
[23] Osaretin, C.A., Edeko, F.O. (2015). Design and implementation of a solar charge controller with variable output. Journal of Electrical and Electronic Engineering, 12(2): 1-12.
[24] Perraki, V. (2013). Temperature dependence on the photovoltaic properties of selected thin-film modules. International Journal of Renewable and Sustainable Energy, 2(4): 140. https://doi.org/10.11648/j.ijrse.20130204.12
[25] Revati, D., Natarajan, E. (2020). I-V and P-V characteristics analysis of a photovoltaic module by different methods using Matlab software. Materials Today: Proceedings, 33: 261-269. https://doi.org/10.1016/j.matpr.2020.04.043
[26] Subbaraj, P., Kannapiran, B. (2010). Artificial neural network approach for fault detection in pneumatic valve in cooler water spray system. International Journal of Computer Applications, 9(7): 43-52. https://doi.org/10.5120/1395-1881
[27] Hassan, Q., Jaszczur, M., Przenzak, E. (2017). Mathematical model for the power generation from arbitrarily oriented photovoltaic panel. E3S Web of Conferences, 14: 01028. https://doi.org/10.1051/e3sconf/20171401028
[28] Sun, J., Zuo, Y., Sun, R., Zhou, L. (2021). Research on the conversion efficiency and preparation technology of monocrystalline silicon cells based on statistical distribution. Sustainable Energy Technologies and Assessments, 47: 101482. https://doi.org/10.1016/j.seta.2021.101482
[29] Tovar, M., Robles, M., Rashid, F. (2020). PV power prediction, using CNN-LSTM hybrid neural network model. Case of study: Temixco-Morelos, México. Energies, 13(24): 1-15. https://doi.org/10.3390/en13246512
[30] Almorox, J., Voyant, C., Bailek, N., Kuriqi, A., Arnaldo, J.A. (2021). Total solar irradiance’s effect on the performance of empirical models for estimating global solar radiation: An empirical-based review. Energy, 236: 121486. https://doi.org/10.1016/j.energy.2021.121486
[31] Wahyuni, T.S., Purwanto, K.K. (2020). Students’ conceptual understanding on acid-base titration and its relationship with drawing skills on a titration curve. Journal of Physics: Conference Series, 1440(1). https://doi.org/10.1088/1742-6596/1440/1/012018
[32] Wang, K., Qi, X., Liu, H. (2019). A comparison of day-ahead photovoltaic power forecasting models based on deep learning neural network. Applied Energy, 251: 113315. https://doi.org/10.1016/j.apenergy.2019.113315
[33] Wu, Z., Pan, F., Li, D., He, H., Zhang, T., Yang, S. (2022). Prediction of photovoltaic power by the informer model based on convolutional neural network. Sustainability, 14(20): 1-16. https://doi.org/10.3390/su142013022
[34] Yang, F., Cheng, Y., Yao, X. (2019). Influencing factors of energy technical innovation in China: Evidence from fossil energy and renewable energy. Journal of Cleaner Production, 232: 57-66. https://doi.org/10.1016/j.jclepro.2019.05.270
[35] Rika (2015). RK900-11 Automatic Weather Instrument Ultrasonic Weather Station. https://www.rikasensor.com/rk900-11-ultrasonic-automatic-weather-instrument.html, accessed on July 14, 2023.
[36] Ben Zohra, M., Riad, A., Alhamany, A. (2022). Optimizing the conception of hybrid PV/PCM by optimizing the heat transfer at the contact interface and by integrating two types of PCM. Results in Engineering, 16: 100614. https://doi.org/10.1016/j.rineng.2022.100614
[37] Kazem, H.A., Chaichan, M.T. (2016). Effect of environmental variables on photovoltaic performance-based on experimental studies. International Journal of Civil, Mechanical, and Energy Science, 2(4): 1-8.
[38] Musyafa', A. (2020). Energi masa lalu, energi masa kini dan energi masa depan. Surabaya: CV. Revka Prima Media.