OPEN ACCESS
This paper aims to disclose the details on the generation and trapping of microbubbles in water induced by self-focused femtosecond laser. For this purpose, high-speed cameras and a high-frequency ultrasonic imager were adopted to monitor the entire process of microbubble generation and trapping. The experimental results show that a single microbubble generated in laser-induced optical breakdown (LIOB) can be trapped stably in water by a self-focused femtosecond laser. Furthermore, the author discussed the physical features of microbubbles generated and trapped by the said femtosecond laser. The research results lay a solid basis for the application of microbubbles in targeted therapy at the molecular level.
femtosecond laser, microbubble, self-focusing, laser-induced optical breakdown (LIOB), high-speed camera, high-frequency ultrasonic imager
Since its birth in the 1960s, the femtosecond laser, i.e. the laser whose pulse width belongs to the order of femtosecond, has been applied more widely in physics, chemistry and biology than long-pulse laser or continuous-wave laser, thanks to its ultra-short pulse and ultra-high energy density (Li et al., 2007; Deng et al., 2012).
Unlike low-energy laser, the femtosecond laser and other high-energy lasers have nonlinear effects in optical absorption media, especially transparent media, when the laser energy surpasses a certain threshold. These effects include the self-focusing, self-phase modulation and the group velocity dispersion (GVD) of white light ultra-continuous spectrum. The focused laser can ionize the medium in a very short period of time, forming a plasma of 1,018/cm3~102/cm3 free electron concentration. In this case, the optical medium will undergo changes to the absorption coefficient, causing the nonlinear absorption of laser energy (Vogel et al., 2005; Vogel, 1997; Vogel and Venugopalan, 2003). This nonlinear energy absorption process, known as the laser-induced optical breakdown (LIOB), has been observed in both air and liquid (Lauterborn and Ebeling, 1972).
Previous experiments and numerical simulations on femtosecond laser in air have shown that the refocusing is attributable to the dynamic transformation of laser energy over the transverse beam section, and that the laser may be subjected to filamentation and multiple refocusing as it passes through different parts of the beam cross-section (Deng et al., 2013). Recent years has seen a growing interest in the propagation and filamentation control of femtosecond laser in transparent media like liquid. Under the nonlinear interaction between laser and water, the high-temperature and high-pressure plasma expands rapidly, such that the ions move behind the free electrons, with a certain delay, to produce a shockwave. The shockwave starts at a supersonic speed of 5,000m/sec and gradually attenuated to the broadband after expansion (Venugopalan et al., 2002; Juhasz et al., 1999). The shockwave exists for less than 1 millisecond in liquid, creating a pressure up to 100kbar (10GPa).
The high-temperature and high-pressure plasma often causes the cavitation in the liquid. The liquid in the focal area of the laser tends to vaporize first into the expanding saturated steam (Zysset et al., 1989). The line degree of the focal area, i.e. the initial diameter of the cavity, falls between 30 and 50μm. After several contractions and rebounds, the bubbles in the focal area will eventually collapse, creating multiple sound waves. The collapse will also bring about a jet flow if the cavity is surrounded by a solid wall surface. The strength of the jet flow can be described by a dimensionless matrix γ =d / Rmax, where d is the distance between the cavity centre and the solid wall surface (hereinafter referred to as the “cavity-wall distance”) and Rmax is the maximum radius of the cavity (Schaffer et al., 2002). The previous studies have shown that the collapse radius of bubbles is positively correlated with cavity radius and cavity-wall distance, and negatively with the sound pressure (Chen et al., 2014), and disclosed the relationship between the liquid depth and the cavity parameters (e.g. lifespan, maximum transverse width, maximum longitudinal length, maximum volume) at different levels of laser energy (Li et al., 2015).
Despite the previous studies, it is difficult to determine the exact mechanism of the LIOB in liquid, not to mention the selection criteria of physical parameters of microbubbles, owing to the amorphicity of water, the highly random aggregation degree of water molecules, and the fluctuating local potential energy of quasi-free electrons. To solve the difficulties, this paper investigates the microbubble generation and trapping induced by self-focused femtosecond laser, with the aid of high-speed cameras and high-frequency ultrasonic imager. The research findings lay the basis for the application of microbubbles in targeted therapy at the molecular level.
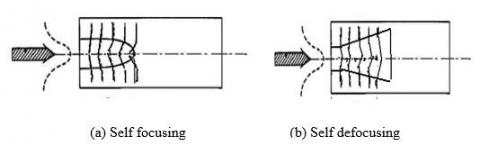
For a single-mode Gaussian laser beam propagating in Kerr medium, the refractive index obeys the non-uniform distribution along the radial direction, due to the transverse distribution of the Gaussian type laser and the intensity difference between the centre and the edge of the beam. The laser beam is focused or defocused by the Kerr medium, which serves as a lens. The relationship between the change of refractive index Δn and the laser intensity I can be expressed as:
$n=n_{0}+\Delta n=n_{0}+n_{2} I$ (1)
where n2 is the nonlinear refractive index. If n2 is greater than zero, then the laser beam is self-focusing (positive lens effect); if n2 is smaller than zero, then the laser beam is self-defocusing (negative lens effect). The two situations are illustrated in Figure 1 below.
Figure 1. Self-focusing and self-defocusing
In the case of self-focusing, the intensity of the Gaussian beam along the radial direction of the medium decreases gradually from the axis to the edge, and the refractive index declines gradually according to Δn = n2I. The propagation path of the beam can be viewed as a graded-index waveguide (with a gradual refractive index transition between core and cladding), which serves like a self-focusing lens (Figure 2).
Figure 2. Beam convergence of self-focusing lens
Then, the maximum numerical aperture at the end of the graded-index waveguide can be expressed as:
$N A=n_{0} \sin \theta_{s}=\sqrt{n^{2}(0)-n^{2}(R)} \approx \sqrt{2 n_{0}[n(0)-n(R)]}$ (2)
where n0 is the linear refractive index of the medium; θs is the maximum convergent angle; n(0) is the refractive index on the central axis (n(0) = n0 + Δn); n(R) is the refractive index of the edge, where the optical field is approximately zero. Then, n(R) must be equal to n0. Thus, we have:
$n_{0} \sin \theta_{s} \approx \sqrt{2 n_{0} \Delta n}$ (3)
The convergent angle is so small as to consider $\sin \theta_{s}^{2} \approx \theta_{s}^{2}$. Thus, the relationship between the self-focusing angle and the laser-induced nonlinear refractive index can be expressed as:
$\theta_{s}^{2}=\frac{2 \Delta n}{n_{0}}$ (4)
If the incident plane of the medium is at the waist position of the Gaussian beam (Figure 3), then the diffraction angle of the Gaussian laser is roughly equal to that of the Gaussian laser.
$\theta_{d}=\frac{\lambda}{\pi a n}=\frac{2}{k a}$ (5)
where k is the wave vector; a is the waist radius. Then, the square ratio between the self-focusing angle and the laser diffraction angle can be expressed as:
$\frac{\theta_{s}^{2}}{\theta_{d}^{2}}=\frac{1}{2}\left(\frac{\Delta n / n_{0}}{1 / k^{2} a^{2}}\right)$ (6)
Thus, the self-focusing has two competing effects: the beam convergence caused by Δn and the beam diffraction. The light intensity is positively correlated with the diffraction effect, and negatively with the convergence effect.
Figure 3. Diffraction of Gaussian laser
In our experiment, a femtosecond laser is expanded and shaped through a focusing lens, and then enters a container filled with water. Then, the laser energy was increased to a pre-set threshold to induce optical breakdown of water, creating and trapping microbubbles. This dynamic process was simultaneously recorded by optical imaging and ultrasonic imaging. The structure of the experimental device is presented in Figure 4 below.
The regenerative amplified Titanium: sapphire laser (Coherent, Reg A) was adopted as the light source, and the laser was outputted as parallel beams after plastic beam expansion. The laser action time was controlled by a high-speed shutter (UniBlitz, LS6T2). After being generated, the laser passed through a focusing lens (f-number: 15) before entering a self-made container filled with deionized water (resistance: 18.0M). The laser propagation was recoded in real time by high-speed cameras and a high-frequency ultrasonic imager (Visual Sonics Inc., Vevo770). In addition to the high-speed cameras, the optical imaging system consists of a metal halide light source (Fiberscope, MS-100), an infrared filter (Schott, BG40), and a long focal length microscope (Questar, QM100).
Since the photosensitive units in the optical imaging system are sensitive to infrared light, the infrared filter was adopted to eliminate the infrared light reflected by the microbubbles, thus enhancing the contrast and clarity of the optical image. Two high-speed cameras were employed, including a high-speed camera (FASTCAM, SA1) and an ultra-high-speed camera (Specialised Imaging, SIM). The high-speed shutter, high-speed camera and high-frequency ultrasonic imager were triggered by an 80MHz signal generator (Agilent, 33250A) to realize synchronous operation.
At the beginning of the experiment, the femtosecond laser was initialized as the output state, the high-speed shutter was closed, and the high-speed cameras and the high-frequency ultrasonic imager were kept in the initial state. Then, the signal generator emitted a square wave signal. When the signal edge rose, the high-speed cameras and high-frequency ultrasonic imager were turned on, and started to record the signal synchronously. When the signal edge dropped, the high-speed shutter was initialized, allowing the laser to hit the target area. In this way, the optical and ultrasonic signals were recorded synchronously before the LIOB took place in the water. The lead amount depends on the square wave signal width of the signal generator. The experimental system can record the entire LIOB process.
Figure 4. Experimental device
4.1. Optical images of microbubbles
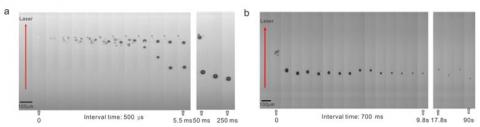
The microbubble generation and trapping triggered by the self-focused femtosecond laser (700mW) in water (Yang et al., 2009) were readily observed in our experiment (Figure 5). There are two sets of parameters for the high-speed cameras: (a) frame rate = 20,000fps, the shutter speed = 1/60,000sec, and resolution = 65*512; (b) frame rate = 250fps, the shutter speed = 1/25,000sec, and resolution = 65*512. Considering the requirements for high time resolution and long time scale, the frame rate was set to 20,000fps and 250fps, respectively. As shown in Figure 5(a), the self-focusing of high-intensity femtosecond laser led to optical breakdown in water, accompanied by the emission of white light. Then, the water was vaporized, forming numerous microbubbles. One of the microbubbles was trapped stably by the laser at about 10ms after the LIOB. After about 250ms after the LIOB, all bubbles except for the trapped one floated away under buoyancy. As shown in Figure 5(b), the bubble size increased rapidly and then decreased slowly until converging to a stable value, and the trapped microbubble moved against the laser, i.e. moved downwards, until stopping at a certain position with a reduced size.
Figure 5. Optical images of the LIOB, microbubble generation, trapping and size variation under a vertically directed self-focusing femtosecond laser
Notes: Red arrow: laser direction; scale: 100μm; white dot: laser focus at t=0.
4.2. Dynamics of microbubble size
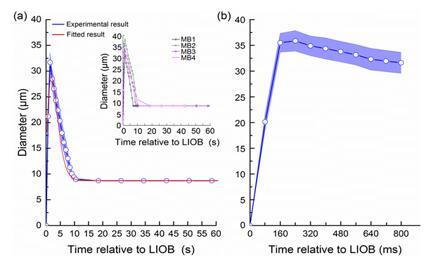
In our experiment, the bubble diameter was adopted to describe the growth of microbubbles. This parameter was measured by the high-speed camera at the rate of 250fps. Figure 6(a) shows the time variation in the diameter of trapped microbubbles, where t=0 refers to the LIOB time point. The microbubble growth after the LIOB can be divided into three phases. In the first phase, the microbubbles grew at a relatively fast rate (mean velocity: 22.6μm/s) for about 1.4s, before reaching the size of 31.68 ± 1.92μm (n=10). In the second phase, the microbubbles continued to shrink at a slower rate from t=1.4s to t=10s. In the third phase, the microbubble size stabilised at 8.68 ±0.16μm (n=10) till the end of the experiment. The growth process can be fitted as a nonlinear equation of the microbubble diameter:
$D=D_{0}+\frac{A}{w} \sqrt{\frac{t_{c}}{t}} I_{1}\left(\frac{2 \sqrt{t_{c} t}}{w}\right) e^{\frac{-t-t_{c}}{w}}$
where $D_{0}, t_{c}$, w and A are all constants. It is clear that the fitting results (red curve in Figure 6(a)) agree well with the experimental result (R2 = 0.97). Meanwhile, the time variations in the size (diameter) of microbubbles MB1, MB2, MB3 and MB4 in repeated experiments are also presented in Figure 6(a). It can be seen that the microbubbles differed in growth speed but shared similar growth trends. As shown in Figure 6(b), the microbubble diameters quickly increased to about 30μm in less than 160ms. The size variations of the microbubbles are explained in details below.
After being generated in the LIOB, the microbubbles changed over time in size. The initial increase is obviously the result of the thermal effect of femtosecond laser: the energy-dense laser produced high-temperature and high-pressure plasma, which acted on water molecules with its powerful kinetic and thermal energies. With the expansion of the gas inside, the microbubbles grew drastically in diameter and moved away from the laser focus. Then, the energy density of the femtosecond laser around the bubbles decreased rapidly, dragging down the thermal effect. In addition, most of the laser energy was reflected fully, failing to act on the bubbles. As the gas in each bubble diffused into water under surface tension, the bubble became smaller. It is reported that a microbubble whose diameter is ~10μm can only exist in water for about 140ms (Plesset and Sanhal, 1982). In our experiment, the lifespan of microbubbles could reach 20min thanks to the sufficient laser energy. Hence, it is concluded that the microbubbles trapped by the intense laser will eventually reach a dynamic equilibrium state under internal and external pressures.
Figure 6. Time variation in the size (diameter) of microbubbles in the scale of (a) seconds and (b) milliseconds
Notes: t=0s is the LIOB time point; the top right inset in (a) depicts the time variations in the diameter of four trapped bubbles; the error bars indicate the standard error of measurement (SEM).
4.3. Features of the trapped microbubbles
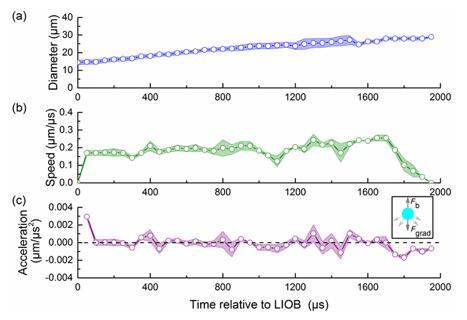
To disclose the dynamic behaviour of trapped microbubbles, the time variations in size, moving speed and acceleration were analysed in a fine time scale of microsecond (μs) at the frame rate of 20,000fps. The analysis results are presented in Figure 7 below. As shown in Figure 7(a), the trapped microbubbles on the geometric central axis of the laser expanded continuously in 2,000μs after the LIOB. As shown in Figure 7(b), the microbubbles’ moving speed increased abruptly from the initial value of zero to 0.17± 0.02 μm/μs (n=6) at about 50μs. Then, the bubbles started to move downwards along the laser direction at varied accelerations. The moving speed peaked at 0.25 ± 0.02 μm/μs (n=6) at ~1,650μs after the LIOB, and subsequently dropped to 0 at ~2ms. This means the bubbles were trapped stably at an axial position below the LIOB position (the focus of the laser). The mean distance from the laser focus to the trapped positions was 245.70 ± 29.04μm (n=6).
Next, the time variation in acceleration of the microbubbles was discussed to disclose the effect of the transient resultant force on the extremely lightweight trapped bubbles. According to the time history of acceleration in Figure 7(c), the initial acceleration of the bubbles was as high as ~0.003μm/μs2, a sign of the great downward impulse on the microbubbles. After about 50μs, the impulse disappeared and the acceleration plunged to about zero. Thus, the instantaneous impulse on the bubbles in the first phase of the movement must be induced by the optical gradient force. From 100μs to 1,600μs, the acceleration varied from -0.0015μm/μs2 to 0.0015μm/μs2, dropped to zero at the moment of the peak speed and then turned negative. Subsequently, the acceleration reached a near-zero value when the moving speed was zero, as shown in Figures 7(b) and 7(c).
Concerning the forces acting on a trapped microbubble, the buoyancy was obviously one of them, while the gravity was so small as negligible due to the tiny weight of the bubble. As mentioned before, the microbubble stayed at the geometric centre of the laser at a certain distance from the laser focus, rather than move towards the opposite direction after its speed dropped to zero. This means the buoyancy was cancelled out by a downward force. As shown in Figure 7(c), the microbubble buoyancy Fb was antiparallel to the overall optical gradient force Fgrad. It is possible to realize steady trapping of the microbubble if the downward-pointing gradient force is sufficient to offset the microbubble buoyancy.
Figure 7. Time variations in the geometry and physical properties of the microbubbles (n=6) (a) Diameter; (b) Moving speed; (c) Acceleration
Notes: Horizontal black dashed line indicates the y-axis value is zero and the speed is constant; upper right inset depicts the directions of the forces acting on a trapped microbubble along the laser beam.
4.4. Ultrasonic images for the LIOB
Microbubbles have a strong acoustic reflection effect in water. The shockwave induced by the LIOB at the laser focus could be monitored by an ultrasonic transducer, which is highly sensitive to the pressure variation in water. Thus, the spatiotemporal features of bubble generation and trapping can be inferred from high-resolution images captured by the high-frequency ultrasonic imager.
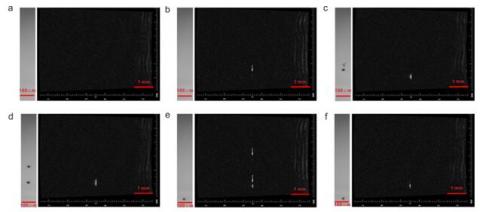
In our experiment, the frequency of acoustic signals was set to 55Hz. Besides, the position of the ultrasonic sensor was adjusted according to the positions of microbubbles, such that the ultrasonic wave and the laser were orthogonal to each other and shared the same focus. Through the control of signal generator, the high-speed cameras and high-frequency ultrasonic imager worked synchronously, producing synchronous images. The author detected distinct acoustic signals associated with the laser focus and used an acoustic radiation force to release the trapped bubbles, aiming to measure the trapping force (Figure 8). Figures 8(a) to 8(f) display the typical phases of the LIOB, respectively, at t < 0, t = 0, t = 1.17s, t = 1.22s, t = 1.95s and t = 2.15s. It can be seen that the optical image on the left and the acoustic image on the right were corresponding well in each phase.
The ultrasonic transducer received pulse-echo signals from the microbubbles in water. The ultrasonic B-mode image in Figure 8(b) shows that many signals emerged in the narrow zone across the laser focus. Then, these acoustic signals disappeared once the LIOB occurred (Figure 8(c)). As shown in Figure 8(e), a new area of signals appeared above a trapped bubble, indicating that the laser focus moved to a new position. The ultrasonic echo signal from the trapped bubble was very prominent, although the imaging resolution is insufficient to reflect the actual shape of the bubble.
Figure 8. Time-variation in acoustic signals associated with the laser focus
Notes: (a) Ultrasonic B-mode image with no signal before the LIOB (t<0); (b) Ultrasonic B-mode image with signals in the laser focus (t=0); (c) The LIOB-induced generation of microbubbles at the laser focus (t=1.17s); (d) The downward movement of the trapped bubbles (t=1.22s); (e) The generation of acoustic signals at the new laser focus above the trapped bubble (t=1.95s); (f) The stabilisation of trapped microbubbles (t=2.15s).
This paper experimentally investigated the microbubbles induced and trapped in water by high-intensity femtosecond laser, using high-speed cameras and a high-frequency ultrasonic imager. In the experiment, the optical devices captured the details on the dynamics of the generation and trapping of microbubbles, and the ultrasonic device acquired comprehensive information from multiple sources. With these devices, the author carried out multi-angle and all-round research on how femtosecond laser generates and traps microbubbles in water. The experimental results show that a single microbubble generated in the LIOB can be trapped stably in water by a self-focused femtosecond laser. In addition, the author discussed the detailed spatiotemporal and mechanical features of the trapped microbubbles, laying a solid basis for the application of microbubbles in targeted therapy at the molecular level.
This paper supported by: National Natural Science Foundation of China (11104058); National Basic Research Program of China (2011CB707500); Natural Science Foundation of Hebei Province (A2011201155); Major Scientific Instruments Program of Ministry of Science and Technology of China (2011YQ03011405); Key projects of the Hebei Provincial Education Department (ZD2015044); Key research and development plan of Ministry of Science and Technology of China (2016YFC0104203).
Chen C. G., Li X., Zhang X., Zhan Z. L., Xie S. (2014). Influence of static pressure on dynamic characteristics of laser-induced cavitation and hard-tissue ablation under liquid environment. Proceedings of SPIE, Vol. 9268, pp. 1-8. https://doi.org/10.1117/12.2071896
Deng Y., Jin T., Chi H., Zhao J. (2013). Collapse of laser induced bubbles and generated sound pressure waves. High Power Laser and Particle Beams, Vol. 25, No. 11, pp. 2793-2798. Https://dx.chinadoi.cn/10.3788/HPLPB20132511.2793
Deng Y., Jin T., Zhao X., Gao Z. X., Chi J. G. (2012). Simulation of femtosecond laser pulse propagation in air. Optics & Laser Technology, Vol. 45, pp. 379-388. https://doi.org/10.1016/j.optlastec.2012.06.020
Juhasz T., Loesel F. H., Kurtz R. M., Horvath C., Bille J. F., Mourou G. (1999). Corneal refractive surgery with femtosecond lasers. IEEE Journal of Selected Topics in Quantum Electronics, Vol. 5, No. 4, pp. 902-910. https://doi.org/10.1109/2944.796309
Kootstra N. A., Verma I. M. (2003). Gene therapy with viral vectors. Annu Rev Pharmacol Toxicol, Vol. 43, pp. 413-439. https://doi.org/10.1146/annurev.pharmtox.43.100901.140257
Lauterborn W., Ebeling K. J. (1972). High-speed photography of laser-induced breakdown in liquids. Applied Physics Letters, Vol. 31, No. 10, pp. 27. https://doi.org/10.1063/1.89495
Li S., Hu S., Liu X., Shen Z., Ni X., Jin J. (2007). Spectrum properties of laser-induced cavitation bubble collapse sound waves. Laser Technology, Vol. 31, No. 3, pp. 281-284, 329. Https://dx.chinadoi.cn/10.3969/j.issn.1001-3806.2007.03.024
Li X., Chen C., Zhang X., Zhan Z., Xie S. (2015). Visualization of liquid-assisted hard tissue ablation with a pulsed CO2 laser. Laser Physics Letters, Vol. 12, No. 1, pp. 015601. https://doi.org/10.1088/1612-2011/12/1/015601
Plesset M. S., Sadhal S. S. (1982). On the stability of gas bubbles in liquid-gas solutions. Journal of Chemical Physics, Vol. 38, No. 1, pp. 133-141. https://doi.org/10.1007/BF00385944
Rawat A., Vaidya B., Khatri K., Goyal A. K., Gupta P. N., Mahor S., Paliwal R., Rai S., Vyas S. P. (2007). Targeted intracellular delivery of therapeutics: An overview. Pharmazie, Vol. 62, No. 9, pp. 643-658. https://doi.org/10.1007/s00248-008-9473-9
Schaffer C., Nishimura N., Glezer E., Kim A., Mazur E. (2002). Dynamics of femtosecond laser-induced breakdown in water from femtoseconds to microseconds. Optics Express, Vol. 10, No. 3, pp. 196-203. https://doi.org/10.1364/OE.10.000196
Torchilin V. P. (2006). Recent approaches to intracellular delivery of drugs and DNA and organelle targeting. Annu Rev Biomed Eng, Vol. 8, pp. 343-375. https://doi.org/10.1146/annurev.bioeng.8.061505.095735
Venugopalan V., Guerra A., Nahen K., Vogel A. (2002). Role of laser-induced plasma formation in pulsed cellular microsurgery and micromanipulation. Physical Review Letters, Vol. 88, No. 7, pp. 078103. https://doi.org/10.1103/PhysRevLett.88.078103
Vogel A. (1997). Nonlinear absorption: Intraocular microsurgery and laser lithotripsy. Physics in Medicine and Biology, Vol. 42, No. 5, pp. 895-912. https://doi.org/10.1088/0031-9155/42/5/011
Vogel A., Noack J., Huttman G., Paltauf G. (2005). Mechanisms of femtosecond laser nanosurgery of cells and tissues. Applied Physics B-Lasers and Optics, Vol. 81, No. 8, pp. 1015-1047. https://doi.org/10.1007/s00340-005-2036-6
Vogel A., Venugopalan V. (2003). Mechanisms of pulsed laser ablation of biological tissues. Chemical Reviews, Vol. 103, No. 5, pp. 2079-2079. https://doi.org/10.1021/cr010379n
Yang K., Zhou Y., Ren Q., Ye J. Y., Deng C. X. (2009). Dynamics of microbubble generation and trapping by self-focused femtosecond laser pulses. Applied Physics Letters, Vol. 95, No. 5, pp. 051107. https://doi.org/10.1063/1.3187535
Zysset B., Fujimoto J. G., Deutsch T. F. (1989). Time-resolved measurements of picosecond optical-breakdown. Applied Physics B-Photophysics and Laser Chemistry, Vol. 48, No. 2, pp. 139-147. https://doi.org/10.1007/BF00692139