R. Saranya* | P. Sukumar
© 2026 The authors. This article is published by IIETA and is licensed under the CC BY 4.0 license (http://creativecommons.org/licenses/by/4.0/).
OPEN ACCESS
The detection and segmentation of cancer regions in cervigram images are crucial tasks due to pixel variability in the images. Hence, this research article proposes a robust classification and segmentation model for a cervical cancer detection system. The detection and segmentation of cancer regions in cervigram images are proposed using a Deep Attention Convolution Feature Extractor (DACFE) based Convolutional Incorporated Vision Transformer (CIVT) model. This proposed system consists of Data Augmentation (DA), Gabor transformation, a feature extractor, and the proposed CIVT model. The cancer case and non-cancer case cervigram images are individually processed to produce the feature maps during the training stage of the proposed system. The test cervigram image undergoes spatial transformation, which is achieved using the Gabor transform (GT) in the testing phase of the proposed system. From this spatially transformed image, the deep feature maps are computed using the proposed DACFE feature extractor module, and the computed deep edge feature maps are used by the proposed CIVT model to produce the classification outputs as either a cancer cervigram image or a non-cancer cervigram image. Finally, the segmentation algorithm is proposed to identify and segment the cancer pixels in the cancer cervigram image. The experimental results were obtained by evaluating the proposed model on cervigram imaging datasets and were compared with recent methods. The proposed DACFE-CIVT method attains 98.84% Sensitivity Rate (SeR), 99.19% Specificity Rate (SpR), 98.81% Accuracy Rate (AR), 98.8% Dice Similarity Coefficient (DSC), and 98.91% Precision Rate (PR) on the cervigram images in the GC dataset. The proposed DACFE-CIVT method attains 99.04% SeR, 98.95% SpR, 98.75% AR, 98.89% DSC, and 98.96% PR on the cervigram images in the KI dataset.
cervical cancer, cervigram images, vision transformer, deep learning, image segmentation, Gabor transform
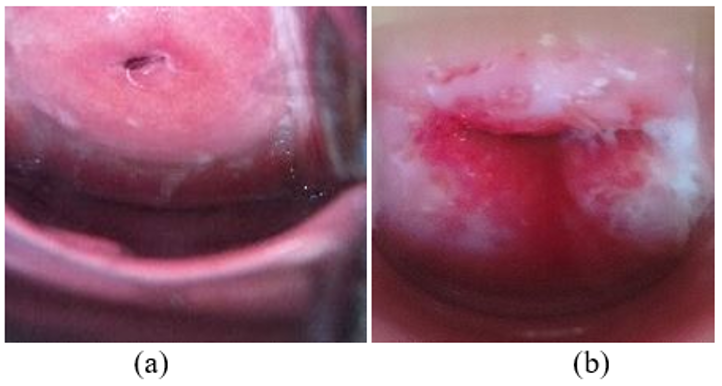
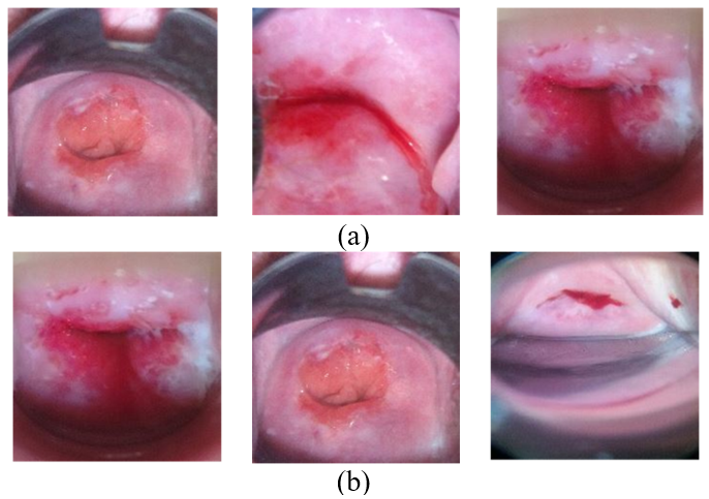
Cancers affecting women include breast cancer, cervical cancer, and ovarian cancer, as per the records stated by the World Health Organization (WHO) in 2022. As per WHO statement, every year around 270,000 women patients lose their lives due to cervical cancer. Hence, the detection of cervical cancer in women has received considerable attention worldwide. Cervical cancer occurs in the cervix region of women patients due to Human Papillomavirus (HPV) infection [1]. The symptoms of cervical cancer are continuous bleeding in vagina region; severe pelvic pain, foul smell in the blood and fatigue. There are two types of cervical cancer physical screening available in the current medical system. They are stated as the Pap smear cell test and the HPV test. The pre-cancerous cells in the cervix region of the female patient can be identified using the Pap smear cell test [2, 3]. In the case of the HPV test, HPV in the cervix region has been identified. If any abnormalities in the cervix have been found, then a gynecologist uses colposcopy equipment, which is inserted inside the cervix region, and cervigram images are captured [4-6]. These images are called cervigrams or colposcopy images. Over the last decade, researchers in this field have used machine and deep learning techniques to detect cervical cancer at an earlier stage. In this article, the cervigram images are used to detect and segment the cancer region of the pixels using these predictive modeling algorithms. These algorithms create significant potential for cervical cancer detection systems in a fully automated method [7-9]. Figure 1(a) depicts the cervigram image in a non-cancerous case where there are no abnormalities in this image, and Figure 1(b) depicts the cervigram image in a cancerous case where there is an abnormal region in this image.
The contributions of this research article are stated in the following points.
•The spatial-frequency image transformation has been obtained by the Gabor transform (GT) to improve the spatial relationships between the pixels in the cervigram images.
•The Convolution feature extractor module has been proposed in this work to produce the attention-based feature maps from the cervigram images, which have both temporal and local feature values to improve the cervigram image identification rate.
•The Convolutional Incorporated Vision Transformer (CIVT) model has been constructed from the Vision Transformer Model (VTM) by implementing the Convolutional layers in the transformer encoder blocks to improve the classification performances of the proposed cervical cancer detection system.
•The cancerous region of pixels in the cancerous cervigram images is segmented using a segmentation algorithm with the detection of all regions of cancer pixel boundaries.
•The extensive experimental setup is constructed with the performance evaluation parameters to validate the experimental results of the cancer region segmentation accuracy with other recent models.
Figure 1. Representative cervigram images for cervical cancer classification, (a) non-cancerous case cervigram image, (b) cancerous case cervigram image
This research article is split into various sections. Section 1 introduces cervical cancer and its detection methodologies in detail. Section 2 addresses the traditional methodologies used for detecting cervical cancer with various modeling approaches; Section 3 explains the proposed method to detect cervical cancer, and the results are completely demonstrated in Section 4 with recent state-of-the-art methods. The conclusion along with the future scope of this article has been given in Section 5.
In this section, the traditional cervical cancer segmentation approaches using different artificial intelligence algorithms are reported. The methodologies used in these traditional cervical cancer segmentation processes are stated with their experimental results. The advantages and limitations of each traditional work is reported to propose a new efficient model for improving the cancer segmentation results in cervigram images.
Karthikeyan et al. [9] proposed a novel CERVIXNET cancer detection model for detecting the cervical cancer regions in cervigram images. This method used an enhanced deep learning model that was derived from the existing deep learning model to perform the classification process. The authors used a fusion-based cervical cancer detection approach to improve the cancer region detection accuracy by identifying the edge pixels in these cervigram images. The non-linearity of the proposed model provided higher classification accuracy as identified as the main advantage of this method. The authors reached the experimental parameters 98.45% Sensitivity Rate (SeR), 97.48% Specificity Rate (SpR), 97.65% Accuracy Rate (AR), 97.76% Dice Similarity Coefficient (DSC) and 97.54% PR on GC dataset and also reached the experimental parameters 97.28% SeR, 97.29% SpR, 97.78% AR, 97.56% DSC and 96.29% PR on KI dataset. The main limitation of this work is that this method is not tested with low-resolution cervigram images.
Raza et al. [10] used an advanced feature computation process for the effective classification of the cancer regions in the cervigram images. The feature extractor was designed using a neural modeling algorithm, and the extracted neuro multi-class features were properly trained by the proposed pre-trained multi-class VGG deep learning approach. The pre-trained feature maps from this deep learning approach were classified using the K-Nearest Neighbor (KNN) model. This proposed model using the KNN classifier provided optimal classification accuracy for cervigram images even in the low-resolution case, as identified as an advantage of this method. The authors achieved the experimental parameters 97.95% SeR, 96.87% SpR, 97.10% AR, 96.26% DSC, and 96.04% PR on the GC dataset and also reached the experimental parameters 96.48% SeR, 96.87% SpR, 96.48% AR, 96.28% DSC, and 95.29% PR on the KI dataset. Even though this method attained higher cancer segmentation accuracy, the cancer boundary was not clearly detected, which increased the misclassification of the pixels.
Deo et al. [11] proposed a cervical cancer detection system using Pap smear cell images with the aid of an adversarial network model in this paper. The data-augmented Cervigram images in both non-cancerous and cancerous cases were classified using the transformer model through the self-attention process. The self-attention improved the classification accuracy with respect to various resolution formats. Though this method is effective, the complexity of the proposed algorithm is high and hence it is not suitable for larger cervigram imaging datasets. The authors achieved the experimental parameters 98.19% SeR, 97.12% SpR, 97.35% AR, 97.19% DSC, and 96.27% PR on the GC dataset and also reached the experimental parameters 97.09% SeR, 97.35% SpR, 97.65% AR, 97.05% DSC, and 96.54% PR on the KI dataset. This method consumed more computational time due to its algorithm complexity, and hence it is not suitable for a high-population screening process.
Zhao et al. [12] proposed a model for a cervical cancer detection system using the Taming Transformer algorithm. The weights of the model were computed based on the extracted set of feature maps, and these feature maps were analyzed and trained by the autoencoder in the classification process. The multires-block in the proposed model improved the functional classification accuracy with respect to the cancer and non-cancerous cervigram cases in this work. The transfer learning algorithm was used to improve the handling capacity of the huge imaging datasets. The authors achieved the experimental parameters 96.12% SeR, 95.43% SpR, 95.39% AR, 95.10% DSC and 95.12% PR on the GC dataset and also reached the experimental parameters 95.12% SeR, 94.28% SpR, 95.27% AR, 95.16% DSC, and 94.10% PR on the KI dataset.
Ahishakiye et al. [13] optimized the cervical cancer classification accuracy using a machine learning model through the Gaussian algorithm. The transfer learning rate of this proposed cervical cancer detection framework was analyzed by the deep feature-based Gaussian process in this work. The radial kernel-incorporated Support Vector Machine (SVM) was used along with the Gaussian kernel for detecting and locating the cancer region of pixels in the cervigram images. The authors achieved the experimental parameters 96.76% SeR, 95.49% SpR, 96.06% AR, 95.28% DSC, and 95.16% PR on the GC dataset and also reached the experimental parameters 96.87% SeR, 95.04% SpR, 95.39% AR, 96.17% DSC, and 94.29% PR on the KI dataset.
Mathivanan et al. [14] used a deep learning fusion model that fused adaptable deep learning algorithms for the cervical cancer detection process. The adaptable algorithms ResNet152 and the variable Inception network model were network-parameter optimized, and they were used to compute the features. The optimized network features from the fused model were further classified by the proposed ResNet-deep feature model to produce the multi-class classification results. The authors reached the experimental parameters of 97.23% SeR, 96.76% SpR, 96.64% AR, 96.03% DSC, and 95.28% PR on GC dataset and also reached the experimental parameters 96.15% SeR, 95.17% SpR, 96.15% AR, 96.17% DSC, and 95.21% PR on the KI dataset [15, 16].
Table 1 shows the conventional cervical cancer detection methods and limitations.
Table 1. Conventional cervical cancer detection methods and limitations
|
Authors |
Methods |
Limitations |
|
Karthikeyan et al. [9] |
CERVIXNET cancer detection model |
Not supported low-resolution cervigram images |
|
Raza et al. [10] |
VGG deep learning approach |
Cancer boundary was not clearly detected which increased the misclassification rate |
|
Deo et al. [11] |
Adversarial network model |
Inappropriate class imbalance |
|
Ahishakiye and Kanobe [13] |
Gaussian algorithm with SVM classifier |
Higher computational classification time period |
|
Mathivanan et al. [14] |
ResNet152 |
Limited global feature computational modeling |
Based on the detailed literature survey on earlier cervical cancer detection methods, the following points are observed as the common limitations of the previous works.
•Insufficient multi-scale feature representations.
•Limited global feature computational modeling.
•Require a higher number of training samples during the training phase of the classification model.
•Lesion detection is complex in low-resolution cervigram images.
•Inappropriate class imbalance.
Convolutional neural networks (CNNs) are the main automated feature extraction technique used in current research. However, CNN-based models primarily capture local spatial information and frequently fail to model long-range contextual dependencies, which results in the incorrect identification of cancer pixels with irregular patterns and low contrast. Transformer-based architectures have proven to be more effective in learning global contextual associations, but when employed separately, they may miss fine-grained local lesion characteristics, typically require large-scale annotated datasets, and have high computational complexity.
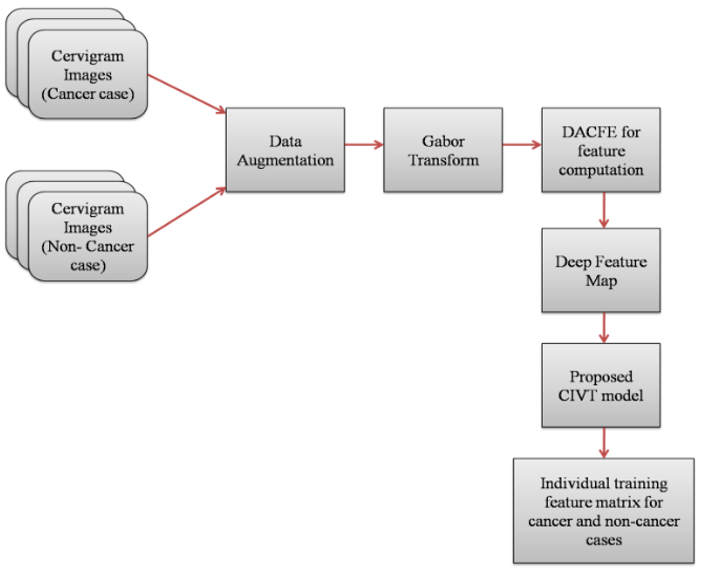
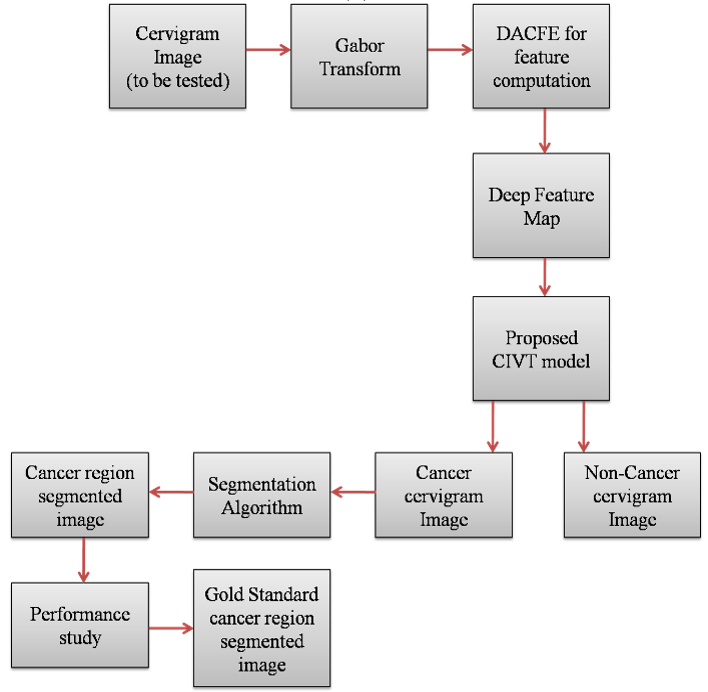
The detection and segmentation of cancer regions in cervigram images are proposed using a Deep Attention Convolution Feature Extractor (DACFE) based CIVT model. This proposed system consists of pre-processing, Gabor transformation, a feature extractor along with the proposed CIVT model. The cancer case and non-cancer case cervigram images are individually processed to produce the feature matrix during the training stage of the proposed system. The test cervigram image is pre-processed, and then spatial transformation is achieved using GT. From this spatially transformed image, the deep edge features are computed using the proposed DACFE, and the computed deep edge features are used by the proposed CIVT model to produce the classification outputs as either a cancer cervigram image or a non-cancer cervigram image. Finally, the heuristic segmentation algorithm is proposed to identify and segment the cancer pixels in the cancer cervigram image. Figure 2(a) shows the proposed DACFE-CIVT-based cervical cancer training system, and Figure 2(b) shows the proposed DACFE- CIVT based cervical cancer testing system.
(a)
(b)
3.1 Data augmentation
The expansion of the used dataset is done by Data Augmentation (DA) [17]. Through the DA process, the image count in the cervigram imaging dataset has been increased by modified versions of the source images in the same dataset. DA is used for eliminating the over fitting and improve the proposed model's performance. The diversity and generalization of the proposed model has been improved by DA. Here, flipping with respect to horizontal and vertical and rotation with respect to left and right have been used for DA and all these DA methods are individually applied to all the cervigram images in the dataset. The DA method is used only in the training phase of the proposed system and it is not required in the testing phase of the proposed cervical cancer classification system.
3.2 Discrete Gabor Transform
It is a multi-scale transformation model which is used in many image processing applications such as analysis of texture, computation of Gabor features and filtering on the images. In this work, the two-dimensional Discrete Gabor Transform (DGT) is used for the spatial-frequency transformation process. It is the extended version of the short-time Fourier Transform. The DGT uses a Gabor kernel that converts the spatially processed cervical image into a spatial-frequency image through the linear convolution process. The Gabor kernel of the DGT is designed with respect to multiple scales and orientations. During the cervical image transformation using DGT, the texture and edge pixels are preserved. In this work, the scale values are set between 0 and 4, and the orientation values are set between -30° and +30°. Now, the preprocessed cervical image is linearly convolved with the 1D kernel of DGT with respect to the specified scales and orientations. Through the different scales and orientations, a total of 300 kernels are generated, which are individually convolved with the preprocessed cervical image. Hence, 300 GT images are produced and all these images are combined into a single GT image by taking the maximum pixel value in all the 300 GT images at the same coordinate position. The pixels in the final GT image belong to the spatial and frequency and it is used to compute the features by the proposed feature extractor. Table 2 shows the DGT design specifications.
Table 2. Discrete Gabor Transform (DGT) design specifications
|
Parameters |
Design Specifications |
|
Number of scales |
5 (0 to 4) |
|
Orientation values |
-30° and +30° |
|
Total orientation counts |
61 |
|
Orientation interval |
1° |
|
Kernel size |
27 × 27 |
|
Wavelength |
16 |
|
Bandwidth |
1 octave |
|
Spatial Aspect Ratio |
0.4 |
|
Phase offset |
90° |
3.3 Deep attention convolution feature extractor
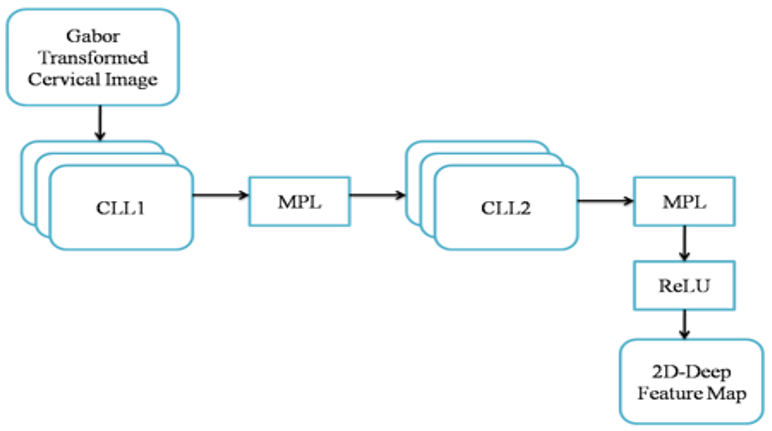
The feature extractor module is the main block of the proposed cervical cancer image detection system, which is used to produce the deep feature maps [18-21]. These feature maps are individually produced for non-cancer cervigram images and cancer case cervigram images during the training phase of the proposed system. The feature maps represent the correlation and pattern values that are essential for differentiating the cervigram images belonging to either a non-cancer case or a cancer case. The traditional feature map production system used algorithms which areshowing the variations between the pixels and the region of pixels in the cervigram images. The feature maps produced by the traditional algorithms, such as binary pattern algorithms [21], energy-based Grey Level Co-occurrence Matrix (GLCM) algorithm [20] and statistical feature production algorithms [19], do not generate enough features to discriminate the cervigram images if they belong to a low-resolution format. The cervigram images mostly belong to a low-resolution format, and hence these traditional feature computation methods through the algorithms are not enough to produce significant feature maps. Hence, the attention based Convolution feature extractor module is proposed in this work to produce attention-based feature maps that have both temporal and local feature values. This proposed DACFE module is derived from the basic deep convolutional network LeNet, which is depicted in Figure 3(a). This Traditional LeNet feature extraction module receives the GT cervigram image and produces the 2Ddeep feature map (2D-DFM). This feature extractor module contains two Convolution layers (CLL1 and CLL2) and two Max-Pooling Layers (MLPs), as illustrated in the following Eqs. (1)–(4).
ConvolutionLayers: CLL1 andCLL2; Internalstructureof(CLL1):32 convolutionfilters (1)
with 3 * 3 kernel size Internalstructureof(CLL2): 64 convolutionfilters (2)
with 5 * 5 skernel size (3)
$\begin{aligned} { Max }- { Pooling }- & { Layer }: { MLP } \rightarrow 2 * 2 { Max }- { Poolingalgorithm }\end{aligned}$ (4)
The GT cervigram image is fed through a series of two convolutional layers. The purpose of this convolutional layer is to generate the local feature values from the cervigram image. The CLL1 has been constituted using 32 filters with a 3 × 3 kernel size. Hence, 32 feature maps are produced, and all of these are combined into a unique feature map. The feature map generated by CLL1 is fed into MPL to produce the shrunk feature map, and it is passed through CLL2. This CLL2 has been constituted using 64 filters with a 5 × 5 kernel size. Hence, 64 feature maps are produced, and all of these are combined into a unique feature map. The feature map generated by CLL2 is fed into MPL to produce the shrunk two-dimensional deep feature map, as illustrated in Figure 3(a). This produced deep feature map contains spatial feature values alone, and hence the classified outputs by the classification algorithm using these generated spatial feature maps are reduced. This also affects the cancer region segmentation process. To improve the cancer region segmentation output along with the cervigram image classification accuracy, the feature map containing both spatial and local feature values is required. Therefore, the proposed DACFE feature extraction modules are developed to produce the two-dimensional feature map which consists of both spatial and local feature values. Figure 3(b) shows the proposed DACFE feature extraction module from the Gabor cervical image.
(a)
(b)
Figure 3. Comparison of conventional and proposed feature extraction architectures for Gabor-transformed cervigram images, (a) Traditional LeNet-based feature extraction module from the Gabor cervical image, (b) proposed Deep Attention Convolution Feature Extractor (DACFE) feature extraction module from the Gabor cervical image
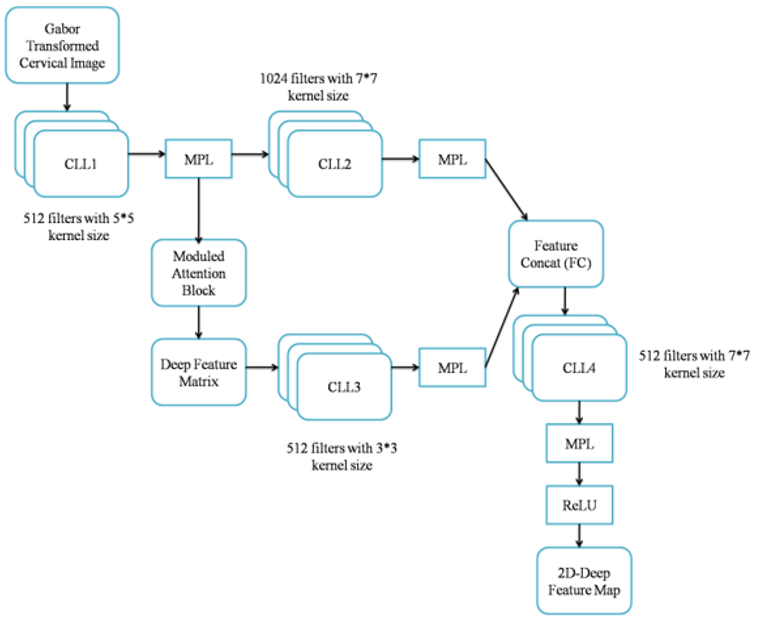
This proposed DACFE feature extraction module receives the GT cervigram image and also produces the 2D-DFM, which contains both spatial and local feature values. This proposed feature extractor module contains four Convolution layers (CLL1, CLL2, CLL3, and CLL4) and four MLPs, as illustrated in the following Eqs. (5)–(10).
ConvolutionLayers: CLL1, CLL2, CLL3 andCLL4; (5)
Internal structure of (CLL1):512 convolution filters with 5 × 5 kernel size (6)
Internal structure of (CLL2):1024 convolution filters with 7 × 7 kernel size (7)
Internal structure of (CLL3):512 convolution filters with 3 × 3 kernel size (8)
Internal structure of (CLL4):512 convolution filters with 7 × 7 kernel size (9)
$\begin{aligned} &{Max}-{ Pooling }- {Layer}: M L P \rightarrow 2 * 2\ { Max }- { Poolingalgorithm }\end{aligned}$ (10)
The GT cervigram image is fed through a series of two convolutional layers CLL1 and CLL2 through the MLP layer. The CLL1 has been constituted using 512 filters with a 5 × 5 kernel size. Hence, 512 feature maps are produced and all these are combined into a unique feature map. The feature map generated by CLL1 is fed into MPL to produce the shrunk feature map, and it is passed through CLL2. This CLL2 has been constituted using 1024 filters with a 7 × 7 kernel size and hence 1024 feature maps are produced and all these are combined into a unique feature map. The feature map generated by CLL2 is fed into MPL to produce the two-dimensional local feature map, as illustrated in Figure 3(b).
The main advantage of this proposed DACFE feature extraction module is to produce the local feature map values to improve the cervigram image classification rate by the classification algorithm. The local feature map has been produced by CLL1 and CLL2. In order to produce the final local feature map from the Gabor cervigram image, the Modulated Attention Block (MAB) is proposed. This MAB receives the local feature maps that are generated by CLL1 and CLL2 and produces the final local feature map through the attention approach. This MAB splits the CLL1 and CLL2 feature map into n × n, and the first block feature values of CLL1 feature map are self-attended by the all split blocks in CLL2 feature map. Then the second block feature values of CLL1 feature map are self-attended by the all split blocks in CLL2 feature map. This process is carried out till the last split block in CLL1. The attention module generates the local feature map and this local feature map is fed into CLL3, which has been constituted using 512 filters with a 3 × 3 kernel size and hence 512 local feature maps are produced, and all these are combined into a unique local feature map. The local feature map generated by CLL3 is fed into MPL to produce the local feature map. The produced local feature maps are now concatenated by the Feature Concatenator (FC). The concatenated feature map is finally passed through CLL4, which has been constituted using 512 filters with a 7 × 7 kernel size. Hence, 512 local feature maps are produced and all of these are combined into a unique deep-local feature map. The feature map generated by CLL4 is fed into MPL to produce the deep-local feature map. This feature map may contain certain negative values, and these negative values reduce the cervigram image classification rate. Hence, the negative values in the produced spatial-local feature are removed by the Linear Rectification Unit (ReLU) and finally two-dimensional deep feature maps are produced. Table 3 shows the configuration settings of the proposed DACFE.
Table 3. Configuration settings of the proposed Deep Attention Convolution Feature Extractor (DACFE)
|
Layer |
Input Size |
Operation |
Kernel Size |
Number of Filters |
Output Size |
|
Input |
224 × 224 |
- |
- |
- |
- |
|
CLL1 |
224 × 224 |
Linear convolution |
5 × 5 |
512 |
112 × 112 |
|
CLL2 |
112 × 112 |
Linear convolution |
7 × 7 |
1024 |
56 × 56 |
|
CLL3 |
112 × 112 |
Linear convolution |
3 × 3 |
512 |
56 × 56 |
|
CLL4 |
56 × 56 |
Linear convolution |
7 × 7 |
512 |
28 × 28 |
3.4 Proposed Convolutional Incorporated Vision Transformer model
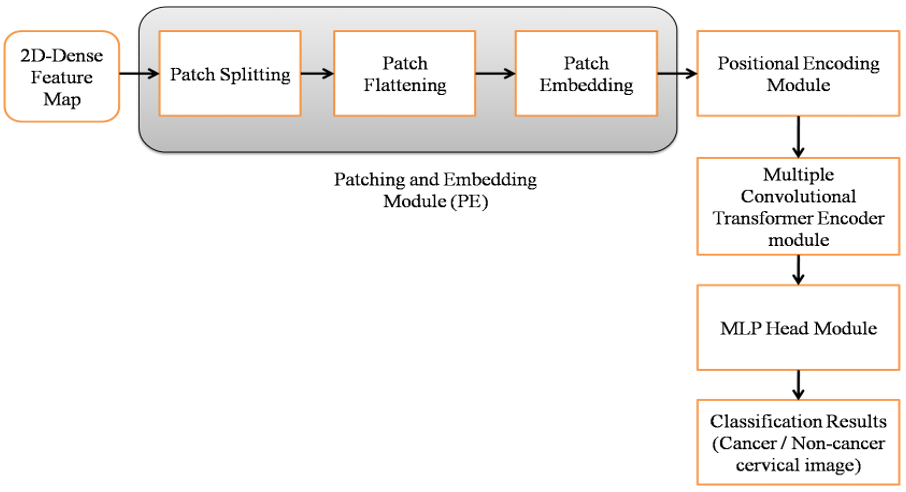
The generated two-dimensional deep feature maps from the proposed DACFE feature extraction module are trained and classified through the transformer model in this work. This research work proposes a CIVT model which is an improved and modified version of the traditional VTM. The proposed CIVT is a kind of transformer model which applied deep learning principles for object detection and image classification. It uses a self-attention mechanism to deliver the global relationships between the various parts of the image. The traditional CNN computed local features alone through convolutional layers (filters) and it is not adequate to handle large image datasets with various patterns. Hence, to improve performance efficiency during the handling of large datasets, VTM is used, which computes global features through the self-attention mechanism. Through this self-attention mechanism, the optimal performance for handling a large dataset can be obtained. Hence, the VTM is identified as the alternative solution for the traditional CNN model. The proposed CIVT model using transformer encoder blocks with an attention mechanism is illustrated in Figure 4.
Figure 4. Proposed Convolutional Incorporated Vision Transformer (CIVT) model for cervical image classification process
The CIVT architecture for the proposed cervical image classification system contains four functional modules as stated below.
•Patching and Embedding (PaE) module;
•Positional Encoding (PE) module;
•Multiple Transformer Encoder Module;
•MLP Head Module.
The PaE module converts the two-dimensional feature map matrix into a one-dimensional flattened feature map with its positional coordinates. This module performs input patch splitting, patch flattening and patch embedding. In input patch splitting block, the input 2D-feature map is split into a number of non-overlapping patches. For the 2D-feature map of size W × H, the number of generated patches are about $\frac{W}{8} \times \frac{W}{8}$. In this work, the 2D feature map size is 256 × 256; then, 32 × 32 = 1024 patches are generated through the patch splitting block. Each generated patch is also called as tokens. Each generated two-dimensional patch is converted into a one-dimensional vector using the patch flattening block. Then, the linear projection algorithm has been used in the patch embedding block to project the one-dimensional feature vector into a high-dimensional vector. The linear projection is performed through the Convolutional layer and the one-dimensional feature vector generated by the patch flattening block is now passed through the convolutional layer to generate the two-dimensional feature vector. The kernel size of the convolutional layer is equal to the generated feature patch size.
The PE module in the proposed CIVT classifier is used to add or insert the spatial coordinates or positions of each generated patch into the two-dimensional feature vector which is generated through the previous patch embedding block in PaE module. There are numerous positional embedding algorithms available to generate and add the patch coordinates. They are listed as learnable positional embedding, sinusoidal PE, coordinate PE, and relative PE. Among them, the coordinate PE is used as the PE algorithm in this work to generate the coordinates of each generated patches. This encoding algorithm is chosen over the other encoding algorithms due to its lower complexity and stable performance with respect to its size. This encoding algorithm finds the horizontal and vertical coordinates (x,y) and adds this coordinate or positional information to the 2D-feature map, which is generated through the PaE module of the proposed CIVT classification architecture.
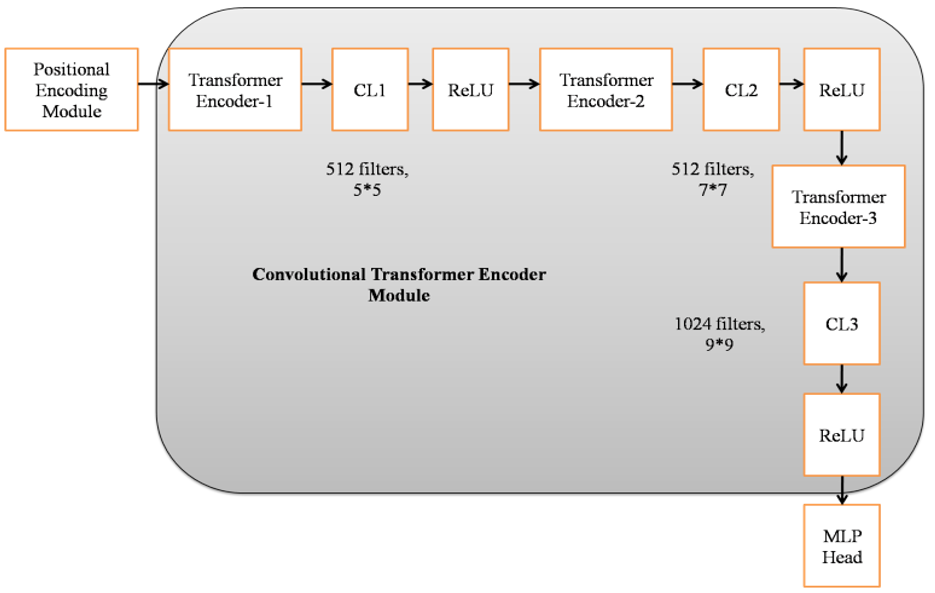
The proposed Convolutional Transformer Encoder (CTE) module (depicted in Figure 5) is designed with Transformer Encoders (TE) and Convolutional layers with different kernel sizes. This TE module is designed with TE layers which is used to learn global relationships between the generated patches. This uses Multi-Head Self-Attentio (MHSA) mechanism to determine and derive the global relationships with the aid of Feed Forward Network (FFN) process. The architecture of the TE is depicted in Figure 6.
Figure 5. Proposed Convolutional Transformer Encoder (CTE) module
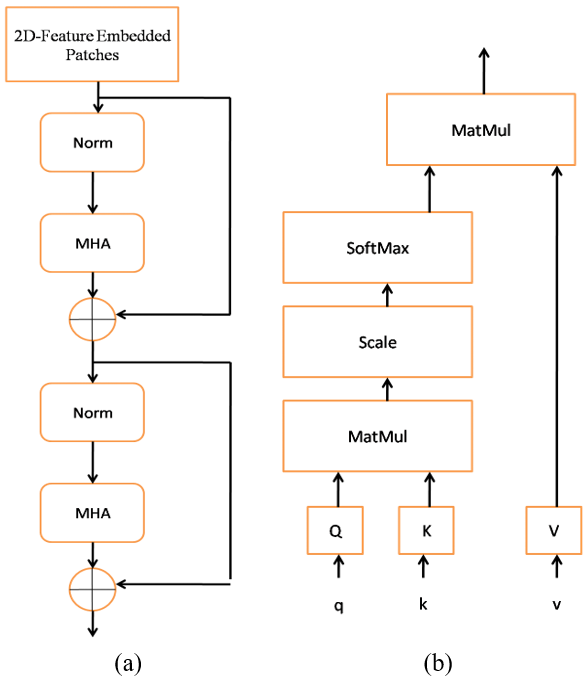
Figure 6. Internal architecture of the Transformer encoder components used in the proposed CIVT model, (a) Architecture of Transformer Encoders (TE), (b) internal design of Multi-Head Attention (MHA)
The TE consists of a Normalization block, MHA block and MLP block as depicted in Figure 6(a). In the Norm block, the generated 2D-feature-embedded patches are applied to the Normalization layer (Norm), which is used to prevent covariate shift and also used for fast convergence. It performs scaling and shifting on the 2D-feature-embedded patches. Due to this normalization process, the training time is significantly reduced which improves the proposed classifier architecture's reliability. The normalized feature-embedded patches are given to MHA. The long-range dependency relationships between each normalized output are computed using MHA. The internal architecture of MHA with query (q), key (k) and value (v) is depicted in Figure 6(b).
This MHA architecture uses a self-attention mechanism to find long-range dependency relationships. The entire operation of the MHA is depicted in the following Eq. (11).
$MHAOutput (Q, K, V)=SoftMax \left(\frac{Q . K^T}{\sqrt{d_k}}\right) \cdot V$ (11)
where, $d_k$ is the key dimension and $Q . K^T$ is the attention score.
The ‘matmul’ is used to generate the attention score, which matches every patch feature with the other patch features. Then, the stable gradients are achieved between the patch features. Then, the stable gradients are achieved between the patch features using the scaling function through the key dimension. Then, the softmax layer performs the normalization of the generated attention score into the weights. Finally, the normalized weights are dot product with the value (v) to generate the final output.
Table 4. Interfered design specifications of the proposed Convolutional Incorporated Vision Transformer (CIVT) model
|
Parameters |
Specifications |
|
Number of Attention blocks |
32 |
|
Number of trainable parameters |
87M |
|
Max-Pooling Layer (MLP) size |
4096 |
|
Average Inference time |
18.6 ms |
|
Patch size |
8 × 8 |
|
Number of patches |
1024 |
This output is passed to the MLP, which is the key element in the TE. It can be constructed using an FFN. This block provides feature refinement on the output of the MHA. It consists of two linear layers, where the first layer is used to expand the input feature dimension from 512 to 1024, and the non-linear activation function is applied to remove the uncertainty in the output. This output is now passed through the second linear layer, which performs the downscaling of the generated feature dimension from 1024 to 512. The MLP output is finally passed to MLP head, which is used to produce the desired output using Fully Connected Neural Networks (FCNN). The desired output is produced by class probability. It consists of three dense layers with 4096, 2048, and 512 neurons in each layer. The output of the final dense layer is passed through the softmax layer to produce the desired classification outputs. Table 4 is the interfered design specifications of the proposed CIVT model for the classifications of the non-cancer and cancer cervigram images.
(a)
(b)
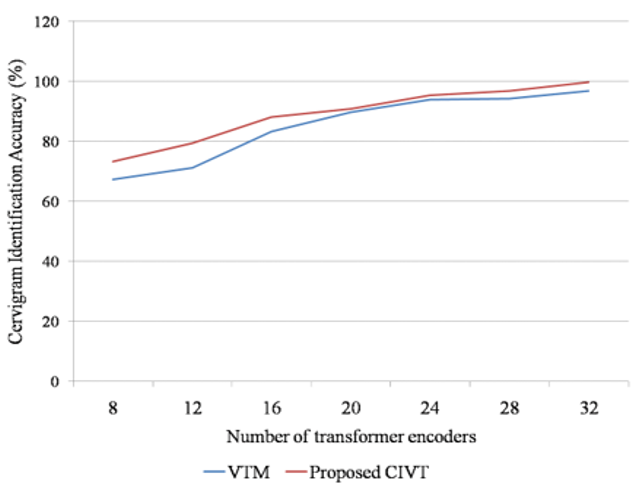
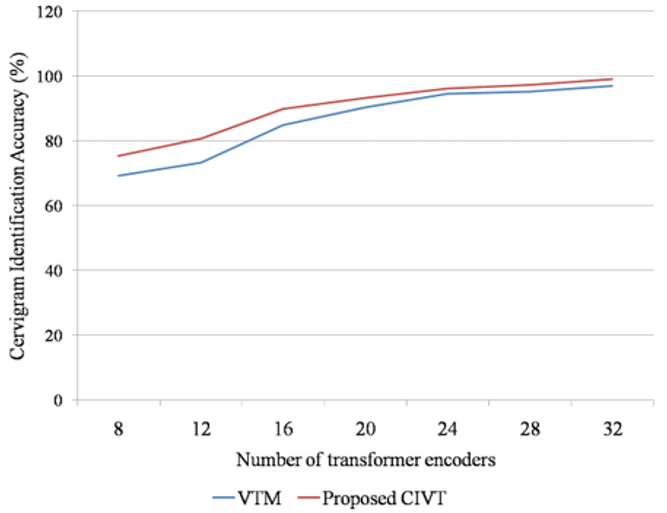
Figure 7. Performance evaluation of the proposed CIVT model under different numbers of Transformer Encoders, (a) Impact of the number of Transformer Encoders(TE) on the GC dataset, (b) impact of the number of Transformer Encoders (TE) on the KI dataset
The number of TE in the proposed CIVT creates the greatest impact on the cervigram identification accuracy with respect to cancer and non-cancer cases on both GC and KI datasets. The cervigram identification accuracy has been improved on both datasets when the number of TE is increased. Figure 7(a) shows the impact of the number of TE on GC dataset, and Figure 7(b) shows the impact of the number of TE on KI dataset.
Figure 8(a) shows the proposed DACFE-CIVT based cervical cancer classification outputs on GC dataset and Figure 8(b) shows the proposed DACFE-CIVT based cervical cancer classification outputs on KI dataset.
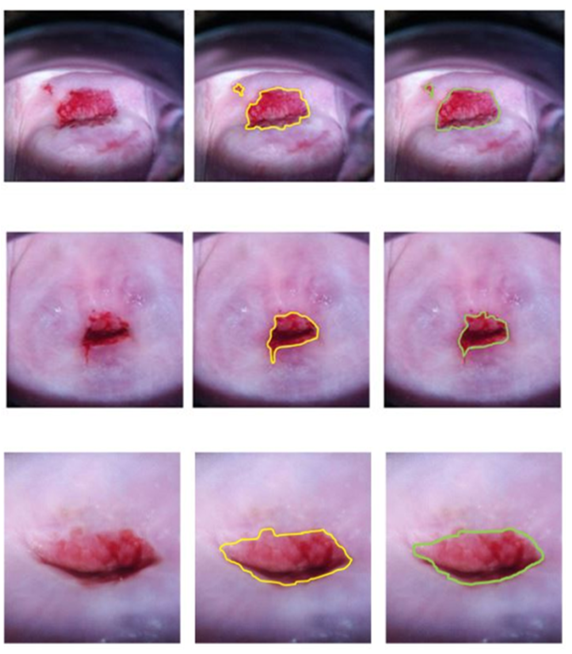
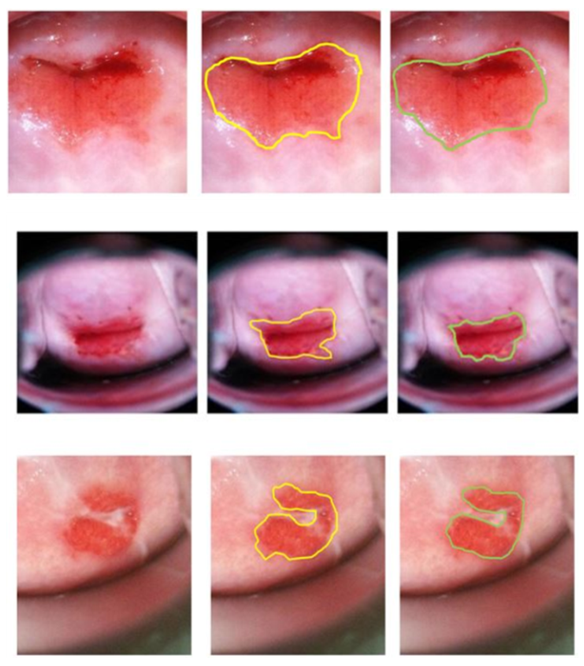
Figure 9 shows the overall cancer region segmentation output images on the GC dataset. Figure 9(a) shows the source cervigram images, Figure 9(b) shows the cancer region segmented images by the proposed method and Figure 9(c) shows the gold standard cancer region segmented images.
Figure 9. Cancer region segmentation output images on GC dataset, (a) source cervigram images, (b) cancer region segmented images by proposed method, (c) gold standard cancer region segmented images
3.5 Segmentation
This research article uses the Morphological Segmentation (MS) framework which uses morphological functions for segregating the cancer pixels in the classified cancer case cervical image. The morphological filters uses morphology functions for locating the cancer pixels through opening and closing. The following steps are used in the MS framework for locating the cancer pixels.
Step 1: The ‘erosion’ with 0.2 mm structuring element is applied to the cancer case image which is used to remove the small protrusion pixels in the image.
Step 2: The opening function (which follows erosion by dilation) has been applied on step 1 output image with 0.1 mm and 0.2 mm structuring element values, respectively.
Step 3: The closing function (which follows dilation by erosion) has been applied to the step 1 output image with 0.2 mm and 0.5 mm structuring element values, respectively.
Step 4: The image obtained from step 3 is subtracted from the image obtained from step 2 to identify the abnormal pixels with few miss-leading pixels.
Step 5: The miss-leading pixels in the step 4 output image is detected and removed using Top-Hat transform.
Figure 10 shows the overall cancer region segmentation output images on KI dataset, Figure 10(a) shows the source cervigram images, Figure 10(b) shows the cancer region segmented images by the proposed method, and Figure 10(c) shows the gold standard cancer region segmented images.
Figure 10. Cancer region segmentation output images on KI dataset, (a) source cervigram images, (b) cancer region segmented images by proposed method, (c) gold standard cancer region segmented images
The proposed DACFE-CIVT approach-based cervical cancer detection system has been performance evaluated on cervigram imaging datasets Guanacaste and Kaggle Intel. This proposed model used an Intel Core i9 processor with a 512 GB SSD and 32 GB internal memory with graphical card.
The Guanacaste (GC) dataset [16] was constructed by the Albert Einstein College of Medicine through the Guanacaste project in Costa Rica country. This is the benchmark dataset that is used in many research works around the world. The cervigram images were collected from 10000 women aged between 18 and 97. Totally, 44000 cervigram images were collected under 7 years study and the size of each cervigram image is around width and height of 2891 × 1973 pixels. From this dataset, 14,000 cervigram images are chosen and used in this research work. These cervigram images are categorized into cancer images (5700 count) and non-cancer images (8300 count). This research work uses 70:30 split for training and testing the proposed system. Hence, 3990 cancer images and 5810 non-cancer images are used to train the proposed system. The 1710 cancer images and 2490 non-cancer images are tested by the proposed system. All the cervigram images in GC dataset are verified and validated by the expert colposcopists.
The KI dataset [17] was constructed by Intel & MobileODT Cervical Cancer Screening competition program and hosted in Kaggle website for reference purposes. This benchmark dataset is used by most of the researchers for cervical cancer detection process using their developed and proposed methodologies. This dataset contains 11373 cervigram images which were obtained through the colposcopy screening approach. The images in this dataset are categorized into cancer images (5328 count) and non-cancer images (6045 count). This research work uses 70:30 split up for training and testing the proposed system. Hence, 3730 cancer images and 4231 non-cancer images are trained by the proposed system. The 1598 cancer images and 1814 non-cancer images are tested by the proposed system. All the cervigram images are verified and validated by the expert colposcopists.
In this research work, the dataset is initially split into training and testing and then the DA has been applied. Then, the DA methods have been applied on the training set cervigram images in order to avoid overfitting issue.
The cancer and non-cancer accuracy are determined using the following Eqs. (12) and (13).
$Cervigram\ Cancer\ Indentification\ Accuracy(CCIA)=\frac{{ Identified\ cancer\ image\ count }}{ { Total\ cancer\ image\ count }}$ (12)
$Cervigram\ Non - Cancer\ Indentification\ Accuracy(CNIA) = \frac{{ Identified\ Non- cancer\ image\ count }}{ { Total\ Non-cancer\ image\ count }}$ (13)
The proposed algorithm is applied to the cervigram images in both datasets individually. In the GC dataset, this work identified 1701 cervigram cancer images out of 1710 cervigram cancer images, and hence the CCIA is about 99.4%. This work identified 2484 cervigram non-cancer images over 2490 cervigram non-cancer images and hence the CNIA is about 99.7%. Therefore, the average Accuracy is about 99.5% for the cervigram images in the GC dataset. In the KI dataset, this work identified 1581 cancer images over 1598 cervigram cancer images, and hence the CCIA is about 98.9%. This work identified 1801 cervigram non-cancer images over 1814 cervigram non-cancer images, and hence the CNIA is about 99.2%. Therefore, the average Accuracy is about 99.05% for the cervigram images in the KI dataset.
In addition to the above performance accuracy of the proposed cervigram image detection system, the following Eqs. (14)-(18) are used to evaluate the performance efficiency with respect to the ground truth cancer cervigram images.
${Sensitivity\ Rate}\ ({SeR})=\frac{T P}{T P+F N}$ (14)
$Specificity\ Rate\ (S p R)=\frac{T N}{T N+F P}$ (15)
${Accuracy\ Rate}\ (A R)=\frac{T P+T N}{T P+T N+F P+F N}$ (16)
$Dice\ Similarity\ Coefficient\ (DSC)=\frac{2 * T P}{2 * T P+F P+F N}$ (17)
${Precision\ Rate}\ (P R)=\frac{T P}{T P+F P}$ (18)
where, the truly identified cancer and non-cancer pixels are represented by TP and TN, respectively and the falsely identified cancer and non-cancer pixels are represented by FP and FN, respectively.
The detection of the cancer region of pixels in the cancer-case cervigram is important for the automated cervigram cancer diagnosis system. It deeply segments the cancer pixels through the dilation and erosion process, and the resultant cancer region-segmented cervigram image is compared with the gold-standard cancer region-segmented image on both GC and KI datasets. Based on the comparison of point-by-point cancer pixels in both images, the results are reported in this article, which are depicted in terms of the SeR, SpR, AR, DSC, and PR (Table 5).
Table 5. Cancer region segmentation results on cancer case cervigram images using the proposed DACFE-CIVT approach (GC dataset)
|
GC Dataset Images |
Cancer Region Segmentation Results in % |
||||
|
SeR |
SpR |
AR |
DSC |
PR |
|
|
GD1 |
98.9 |
99.3 |
98.6 |
98.5 |
99.3 |
|
GD2 |
98.3 |
99.1 |
98.3 |
99.3 |
98.2 |
|
GD3 |
98.8 |
98.7 |
98.1 |
99.1 |
98.9 |
|
GD4 |
98.4 |
98.9 |
99.4 |
98.7 |
99.3 |
|
GD5 |
98.2 |
99.3 |
99.1 |
98.3 |
99.1 |
|
GD6 |
98.1 |
99.1 |
99.2 |
98.2 |
98.7 |
|
GD7 |
99.7 |
99.8 |
98.7 |
98.6 |
98.9 |
|
GD8 |
99.3 |
99.4 |
98.3 |
99.3 |
99.3 |
|
GD9 |
99.1 |
99.2 |
99.1 |
99.1 |
99.1 |
|
GD10 |
99.6 |
99.1 |
99.3 |
98.9 |
98.3 |
|
Mean |
98.84 |
99.19 |
98.81 |
98.8 |
98.91 |
The number of TE in the proposed CIVT creates the greatest impact on the cervigram identification accuracy with respect to cancer and non-cancer cases on both GC and KI datasets. The cervigram identification accuracy has been improved on both datasets when the number of TE is increased. Figure 7(a) shows the impact of the number of TEs on the GC dataset, and Figure 7(b) shows the impact of the number of TE on the KI dataset.
Table 6. Cancer region segmentation results on cancer case cervigram images using the proposed DACFE- CIVT approach (KI dataset)
|
KI Dataset Images |
Cancer Region Segmentation Results in % |
||||
|
SeR |
SpR |
AR |
DSC |
PR |
|
|
KI1 |
99.3 |
98.4 |
99.3 |
99.1 |
98.7 |
|
KI2 |
99.2 |
98.1 |
99.1 |
98.6 |
98.3 |
|
KI3 |
98.7 |
99.8 |
98.7 |
98.2 |
99.2 |
|
KI4 |
99.3 |
99.3 |
98.3 |
98.8 |
99.1 |
|
KI5 |
98.7 |
99.1 |
98.7 |
99.3 |
99.4 |
|
KI6 |
98.3 |
98.9 |
99.3 |
99.1 |
98.3 |
|
KI7 |
98.9 |
98.2 |
99.1 |
98.5 |
98.9 |
|
KI8 |
99.1 |
99.4 |
98.2 |
98.9 |
99.4 |
|
KI9 |
99.3 |
99.1 |
98.6 |
99.3 |
99.1 |
|
KI10 |
99.6 |
99.2 |
98.2 |
99.1 |
99.2 |
|
Mean |
99.04 |
98.95 |
98.75 |
98.89 |
98.96 |
Table 7. Comparisons of cancer region segmentation performances with respect to evaluation parameters on GC and KI datasets (by mean and standard deviation)
|
Cancer Segmentation Accuracy Evaluation Parameters |
Dataset |
|
|
GD (Mean+Standard Deviation) |
KI (Mean+Standard Deviation) |
|
|
SeR |
98.84 ± 0.31 |
99.04 ± 0.12 |
|
SpR |
99.19 ± 0.15 |
98.95 ± 0.24 |
|
AR |
98.81 ± 0.21 |
98.75 ± 0.23 |
|
DSC |
98.8 ± 0.22 |
98.89 ± 0.18 |
|
PR |
98.91 ± 0.27 |
98.96 ± 0.17 |
Table 6 shows the cancer region segmentation results on cancer case cervigram images using the proposed DACFE-CIVT approach (KI dataset). The proposed DACFE-CIVT method attains 99.04% SeR, 98.95% SpR, 98.75% AR, 98.89% DSC, and 98.96% PR on the cervigram images in the KI dataset. From Table 6, the segmented results reported in this article are the results which are belonging to the cancer boundary segmented pixels in the abnormal cervigram images.
The comparisons of the cancer segmentation results on different cervigram imaging datasets are important to analyze the robustness of the proposed cervigram cancer region segmentation approach. In order to provide the optimal comparisons between the different datasets, the proposed method has been individually applied to the dataset images, and the results are reported in this article. Table 7 depicts the comparisons of cancer region segmentation performances with respect to evaluation parameters on GC and KI datasets.
In this research work, 1710 cancer cervigram images are tested in the GC dataset, and 1598 cancer cervigram images are tested in the KI dataset. Initially, 10 cancer cervigram images are chosen from both datasets and tested by the proposed system with respect to the cancer segmentation algorithm. The proposed DACFE-CIVT method attains 98.84% SeR, 99.19% SpR, 98.81% AR, 98.8% DSC, and 98.91% PR on the cervigram images in GC dataset. The proposed DACFE-CIVT method attains 99.04% SeR, 98.95% SpR, 98.75% AR, 98.89% DSC, and 98.96% PR on the cervigram images in the KI dataset. Similar cancer region segmentation results were obtained by testing all cancer cervigram images in this dataset, and the mean and standard deviation values are given in Table 7.
The computation of features and its impact on the cancer case cervigram is important for improving the cancer region segmentation results with respect to different cancer region segmentation parameters. The conventional feature extraction and computation procedures are available and used by many researchers during the cancer image classification process. The conventional features used for cancer region of pixels segmentation are shift-invariant features, binary pattern features, GLCM features, and statistical features. The cervical cancer region segmentation method stated in this article is analyzed with these individual features instead of the proposed feature extractor to analyze the impact of these feature extraction process. Hence, the proposed cervical cancer segmentation method with respect to individual conventional feature has been compared with the proposed cervical cancer segmentation system with the proposed feature extractor in this article. Table 8 shows the illustrations of the performances of cancer region segmentation with respect to feature extraction methods on the GC dataset.
Table 8. Performance of cancer region segmentation with respect to feature extraction methods on the GC dataset
|
Feature Extraction Methods |
Cancer Region Segmentation Results in % |
||||
|
SeR |
SpR |
AR |
DSC |
PR |
|
|
Proposed DACFE features |
98.84 |
99.19 |
98.81 |
98.8 |
98.91 |
|
Statistical features [19] |
97.28 |
97.02 |
97.76 |
97.20 |
97.23 |
|
GLCM [20] |
96.86 |
96.48 |
97.13 |
96.54 |
96.98 |
|
Shift invariant features [21] |
96.10 |
96.21 |
96.27 |
96.10 |
96.47 |
|
Binary pattern features [22] |
95.76 |
95.06 |
96.04 |
95.65 |
96.12 |
Table 9 shows the illustrations of the performances of cancer region segmentation with respect to feature extraction methods on the KI dataset.
Table 9. Performance of cancer region segmentation with respect to feature extraction methods on the KI dataset
|
Feature Extraction Methods |
Cancer Region Segmentation Results in % |
||||
|
SeR |
SpR |
AR |
DSC |
PR |
|
|
Proposed DACFE features |
99.04 |
98.95 |
98.75 |
98.89 |
98.96
|
|
Statistical features [18] |
95.34 |
94.98 |
94.98 |
94.38 |
95.12 |
|
GLCM [19] |
95.87 |
95.04 |
95.28 |
95.38 |
96.01 |
|
Shift invariant features [20] |
96.23 |
96.76 |
96.75 |
96.39 |
96.49 |
|
Binary pattern features [21] |
96.16 |
95.28 |
96.38 |
96.05 |
96.07 |
Table 10 shows the cancer region segmentation performance comparisons between the proposed DACFE-CIVT and similar recent methods on the GC dataset.
Table 10. Cancer region segmentation performance comparisons between the proposed DACFE-CIVT and similar recent methods on the GC dataset
|
Cancer Segmentation Approaches |
Cancer Region Segmentation Results in % |
||||
|
SeR |
SpR |
AR |
DSC |
PR |
|
|
Proposed DACFE-MVT (this work) |
98.84 |
99.19 |
98.81 |
98.8 |
98.91 |
|
Karthikeyan et al. [9] |
98.45 |
97.48 |
97.65 |
97.76 |
97.54 |
|
Raza et al. [10] |
97.95 |
96.87 |
97.10 |
96.26 |
96.04 |
|
Deo et al. [11] |
98.19 |
97.12 |
97.35 |
97.19 |
96.27 |
|
Zhao et al. [12] |
96.12 |
95.43 |
95.39 |
95.10 |
95.12 |
|
Ahishakiye et al. [13] |
96.76 |
95.49 |
96.06 |
95.28 |
95.16 |
|
Mathivanan et al. [14] |
97.23 |
96.76 |
96.64 |
96.03 |
95.28 |
Table 11 shows the cancer region segmentation performance comparisons between the proposed DACFE-CIVT and similar recent methods on the KI dataset.
Table 11. Cancer region segmentation performance comparisons between the proposed DACFE-CIVT and similar recent methods on the KI dataset
|
Cancer Segmentation Approaches |
Cancer Region Segmentation Results in % |
||||
|
SeR |
SpR |
AR |
DSC |
PR |
|
|
Proposed DACFE-MVT |
99.04 |
98.95 |
98.75 |
98.89 |
98.96 |
|
Karthikeyan et al. [9] |
97.28 |
97.29 |
97.78 |
97.56 |
96.29 |
|
Raza et al. [10] |
96.48 |
96.87 |
96.48 |
96.28 |
95.29 |
|
Deo et al. [11] |
97.09 |
97.35 |
97.65 |
97.05 |
96.54 |
|
Zhao et al. [13] |
95.12 |
94.28 |
95.27 |
95.16 |
94.10 |
|
Ahishakiye et al. [13] |
96.87 |
95.04 |
95.39 |
95.38 |
94.29 |
|
Mathivanan et al. [14] |
96.15 |
95.17 |
96.15 |
96.17 |
95.21 |
The compared models used different cervigram imaging datasets with different split-up and hence the methodologies used in these references are applied to the set of cervigram images which are used in our research work with the same split-up. The experimental results of the conventional methods are now obtained and compared with the proposed method in this manuscript.
The confusion matrix (Table 12) with respect to TP, TN, FP and FN are given below.
Table 12. Confusion matrix
|
Actual/Predicted |
Cancerous |
Non-Cancerous |
Total |
|
Cancerous |
TP = 1694 |
FN = 16 |
1710 |
|
Non-cancerous |
FP = 26 |
TN = 2464 |
2490 |
|
Total |
1720 |
2480 |
4200 |
In this article, the cancer regions in cervigram are detected and segmented using the proposed DACFE-CIVT classification model. This proposed work combines the deep learning model and the transformer model to improve the cancer case cervigram image detection and classification accuracy. The deep learning method is used in this article for computing the local and statistical features from the cervigram images, and the proposed transformer model has been used to perform the classification process more effectively than conventional transformer models. The proposed DACFE-CIVT-based cervical cancer detection system is applied and tested on two datasets, GC and KI, and the results are reported with detailed demonstration.
Even though the proposed DACFE-CIVT classification model, it exhibits certain limitations in the cancer segmentation process in abnormal cervigram images, as illustrated in the following points.
•The proposed DACFE-CIVT classification method has been validated only on the online GC and KI cervigram imaging datasets and not verified on the clinical real-time cervigram imaging datasets, where bias is required to verify the significance of the proposed cancer segmentation method.
•The cancer region boundary of pixels is important to estimate the severity levels of the cancer-case cervigram images. In this article, the segmented boundary of pixels is not used as the criterion for severity estimation.
The main future expansion of this research work is stated in the following points:
•The cancer case cervigram images will be diagnosed in the future to estimate and analyze their severity levels using Generative Adversarial Networks (GAN) based transformer model.
•The graph cut-based deep learning model will be used to segment the cancer regions in the cancerous case cervigram images to improve the external boundary of cancer regions more accurately than the current study.
•The clinical validation will be done in the future with larger cervigram imaging datasets to validate the experimental results of the proposed model.
The authors would like to thank their friends and colleagues for their constant help and support throughout the study and in obtaining the results.
[1] Alsubai, S., Alqahtani, A., Sha, M., et al. (2023). Privacy preserved cervical cancer detection using convolutional neural networks applied to pap smear images. Computational and Mathematical Methods in Medicine, 2023: 1-8. https://doi.org/10.1155/2023/9676206
[2] Abinaya, K., Sivakumar, B. (2024). A deep learning-based approach for cervical cancer classification using 3D CNN and vision transformer. Journal of Imaging Informatics in Medicine, 37(1): 280-296. https://doi.org/10.1007/s10278-023-00911-z
[3] Mehmood, M., Rizwan, M., Gregus ml, M., Abbas, S. (2021). Machine learning assisted cervical cancer detection. Frontiers in Public Health, 9: 788376. https://doi.org/10.3389/fpubh.2021.788376
[4] Rahimi, M., Akbari, A., Asadi, F., Emami, H. (2023). Cervical cancer survival prediction by machine learning algorithms: A systematic review. BMC Cancer, 23(1): 341. https://doi.org/10.1186/s12885-023-10808-3
[5] Meza Ramirez, C.A., Greenop, M., Almoshawah, Y.A., Martin Hirsch, P.L., Rehman, I.U. (2023). Advancing cervical cancer diagnosis and screening with spectroscopy and machine learning. Expert Review of Molecular Diagnostics, 23(5): 375-390. https://doi.org/10.1080/14737159.2023.2203816
[6] Shanthi, P.B., Faruqi, F., Hareesha, K.S., Kudva, R. (2019). Deep convolution neural network for malignancy detection and classification in microscopic uterine cervix cell images. Asian Pacific Journal of Cancer Prevention, 20(11): 3447-3456. https://doi.org/10.31557/APJCP.2019.20.11.3447
[7] William, W., Ware, A., Basaza-Ejiri, A.H., Obungoloch, J. (2019). A pap-smear analysis tool (PAT) for detection of cervical cancer from pap-smear images. BioMedical Engineering OnLine, 18(1): 16. https://doi.org/10.1186/s12938-019-0634-5
[8] Habtemariam, L.W., Zewde, E.T., Simegn, G.L. (2022). Cervix type and cervical cancer classification system using deep learning techniques. Medical Devices: Evidence and Research, 15(1): 163-176. https://doi.org/10.2147/MDER.S366303
[9] Karthikeyan, N., Gokul Chandrasekaran, Sudha, S. (2025). CERVIXNET: An efficient approach for the detection and classifications of the cervigram images using modified deep learning architecture. Current Medical Imaging, 21: e15734056343690. https://doi.org/10.2174/0115734056343690250116020310
[10] Raza, M.A., Siddiqui, H.U.R., Saleem, A.A., et al. (2025). Advanced feature extraction for cervical cancer image classification: Integrating neural feature extraction and autoint models. Sensors, 25: 2826. https://doi.org/10.3390/s25092826
[11] Deo, B.S., Pal, M., Panigrahi, P.K., Pradhan, A. (2025). CerviGAN: Cervical cancer pap smear image classification with GAN-based data augmentation and external attention transformer. Discover Electronics, 2(1): 73. https://doi.org/10.1007/s44291-025-00112-8
[12] Zhao, C., Shuai, R.J., Ma, L., Liu, W.J., Wu, M.L. (2022). Improving cervical cancer classification with imbalanced datasets combining taming transformers with T2T-ViT. Multimedia Tools and Applications, 81(17): 24265-24300. https://doi.org/10.1007/s11042-022-12670-0
[13] Ahishakiye, E., Kanobe, F. (2024). Optimizing cervical cancer classification using transfer learning with deep gaussian processes and support vector machines. Discover Artificial Intelligence, 4(1): 73. https://doi.org/10.1007/s44163-024-00185-6
[14] Mathivanan, S.K., Francis, D., Srinivasan, S., Khatavkar, V., Karthikeyan, P., Shah, M.A. (2024). Enhancing cervical cancer detection and robust classification through a fusion of deep learning models. Scientific Reports, 14: 10812. https://doi.org/10.1038/s41598-024-61063-w
[15] Bratti, M.C., Rodríguez, A.C., Schiffman, M., et al. (2004). Description of a seven-year prospective study of human papillomavirus infection and cervical neoplasia among 10 000 women in Guanacaste, Costa Rica. Revista Panamericana de Salud Pública, 15: 75-89. https://www.scielosp.org/pdf/rpsp/2004.v15n2/75-89/en.
[16] Harel, O. (2020). 224 224 cervical cancer screening. Kaggle. https://www.kaggle.com/datasets/ofriharel/224-224-cervical-cancer-screening.
[17] Alomar, K., Aysel, H.I., Cai, X.H. (2023). Data augmentation in classification and segmentation: A survey and new strategies. Journal of Imaging, 9: 46. https://doi.org/10.3390/jimaging9020046
[18] Sneha, K., Arunvinodh, C. (2016). Cervical cancer detection and classification using texture analysis. Biomedical and Pharmacology Journal, 9(2): 663-671. https://doi.org/10.13005/bpj/988
[19] Thohir, M., Foeady, A.Z., Novitasari, D.C.R., Arifin, A.Z., Phiadelvira, B.Y., Asyhar, A.H. (2020). Classification of colposcopy data using GLCM-SVM on cervical cancer. In 2020 International Conference on Artificial Intelligence in Information and Communication (ICAIIC), pp. 373-378. https://doi.org/10.1109/ICAIIC48513.2020.9065027
[20] Arya, M., Mittal, N., Singh, G. (2018). Texture‐based feature extraction of smear images for the detection of cervical cancer. IET Computer Vision, 12(8): 1049-1059. https://doi.org/10.1049/iet-cvi.2018.5349
[21] Fekri-Ershad, S., Ramakrishnan, S. (2022). Cervical cancer diagnosis based on modified uniform local ternary patterns and feed forward multilayer network optimized by genetic algorithm. Computers in Biology and Medicine, 144: 105392. https://doi.org/10.1016/j.compbiomed.2022.105392