N. Jayapal* | B. Umarani
© 2026 The authors. This article is published by IIETA and is licensed under the CC BY 4.0 license (http://creativecommons.org/licenses/by/4.0/).
OPEN ACCESS
Cervical cancer remains an important public health concern and is one of the leading causes of cancer-related mortality among women worldwide. Appropriate treatment and improved survival rely on early identification and appropriate classification. However, classical approaches are extremely useful but require enormous domain knowledge and time. With recent advances in deep learning (DL), there has been progress towards automation of these processes, even though designing the optimal neural network architectures is still incredibly challenging. Herein, we present a combination adaptive neural architecture search with swarm intelligence (ANAS-SI) model to accurately detect and classify cervical cancer using medical imaging data. The proposed ANAS-SI framework incorporates an ANAS component that adaptively selects the search space for architecture exploration based on intermediate performance metrics. In contrast, the SI algorithm is inspired by the swarming behavior of biological populations and is based on a local search method to optimize hyperparameters through inter-candidate cooperation and competition for network weights. We used the ANAS-SI framework as follows, we first normalized and data-augmented the high-resolution cervical image dataset as mentioned earlier. Trained on data up to October 2023, the ANAS-SI framework outperformed state-of-the-art models and approaches in a high-performance computing (HPC) cluster. It achieved an accuracy of 96.5%, precision of 96.0%, recall of 95.8%, and an F1-score of 95.9%. The architecture designed in this proposal is a simple but robust classifier, capable of compromising complexity and performance with promising results on images that include multiple patients, demographics and orientations. Thus, the ANAS-SI is forward in AI computer automation of cervical cancer detection and classification, requiring minimum human intervention in deciding which digital smart model to use. It demonstrates the potential of AI-assisted approaches for improving cervical cancer management.
cervical cancer, deep learning, adaptive neural architecture search, swarm intelligence, medical imaging, classification accuracy
Cervical cancer is a type of cancer that occurs in the cells of the cervix which can be defined as an area at the lower part of the uterus where it connects to the vagina. It is the second most common neoplasm on the planet among women (after breast cancer) which the Food and Drug Administration contends occurs primarily in low- and middle-income countries. The main origin of cervical carcinoma [1] is the persistent infection of the cervix with high-risk types of human papillomavirus (HPV), a sexually transmitted virus. A simple computer program Artificial Intelligence (AI) using algorithms to simulate components of the brain, deep learning (DL), has recently proven to be capable in numerous applications in cervical cancer diagnosis and health care. However, DL itself does not differentiate cervical cancers, and its applications are primarily directed toward enhancing diagnostic accuracy, efficiency, and accessibility. DL models in particular, convolutional neural networks (CNNs) [2] are well established for diagnostics based on medical images. Such models can be accurately trained to detect and classify abnormal cervical images — abnormalities related to cervical cancer.
Cervical cancer is mostly of types: squamous cell carcinoma which begins in the thin flat cells that make up the outer layer lining of the cervix, and adenocarcinoma which starts in gland-like cells that line. Also, why regular pap smear is so important as early on, cervical cancer [3] does not produce any symptoms. A few of the symptoms could be unusual vaginal bleeding, pelvic pain and during intercourse which might develop if you get symptomatic.
Manual interpretation by physicians lies at the heart of traditional cervical cancer screening methods such as the Pap smear and HPV test [4]. This process is the less human intervention DL helps to reduce responsibilities from health and lessen human errors. These AI-based systems work through enormous numbers of pictures uncannily quicker than human personalities could run them and keep a steady yield, prompting early recognition and mediation — when it is most fundamental.
In principle, data augmentation methods can enhance both the quality of training data (rotation transformation, scaling transformation and flipping in image transmission network) and diversity of training data. It helps build robust models capable of generalizing to different cohort imaging properties that are driven by the clinical characteristics of a wide range of potential metabolic diseases in patients. Noises in the raw data [4] cause some minor issues, so we follow Normalized and Noise removed step [5], which helps the quality of data goes to another level and get us better results through our model’s stage.
Even in those settings that lack sufficient resources, DL models for cervical cancer detection can be executed at the minimum cost. When trained, these models could be deployed on standard computer devices in everyday clinical environments. It gives a larger portion of the populace, including those in country by and large regions, access to cutting edge indicative capacities.
Over time, the DL models get better. One can evolve studying on the maximum range of data and models far better after training because then you have all cases truly. It is why AI systems need to learn iteratively, staying in tune with evolving medical knowledge and current standards for disease diagnosis.
DL can be combined with additional AI technologies, such as Natural Language Processing (NLP) for patient record analysis and genetics-based medical history understanding, and also advanced imaging modalities like OCT and digital histopathology. These integrations allow for a comprehensive understanding of cervix cancer diagnosis and treatment, thus resulting in universal diagnostic systems [6]. In summary, this relationship between cervical cancer and DL has turned upside down the method of detecting, diagnosing and treating this disease. DL is the promise of accurate, efficient and accessible cervical cancer detection facilitated through the power of AI.
The contribution deals with medical diagnostics and Artificial Intelligence (AI), the couple has proposed work on Diagnosis and Classification of Cervical Cancer [7] which is performed using adaptive neural architecture search with swarm intelligence (ANAS-SI). As below: what and why it is important; its contributions.
ANAS-SI aims to automatically discover effective architectures for neural networks to achieve accurate classification of cervical cancer. Interface has better accuracy, which is important for early detection and intervention further leading to improved patient outcomes and life preservation. Technical terms adaptive neural architecture search (ANAS) with swarm intelligence (SI) can automatically perform model selection and hyperparameter tuning. This reduces reliance on prompt tuning and DL expertise, thereby rendering it more accessible to practitioners and researchers in a laboratory environment.
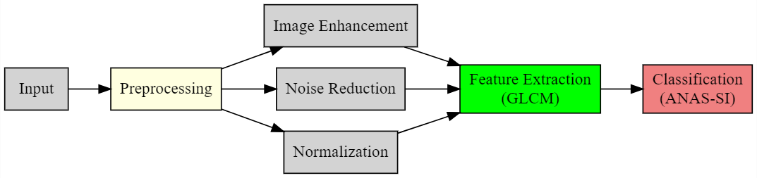
Figure 1. Basic processing of cervical cancer
Cervical cancer Basic processing. ANAS builds a larger architecture search space than ESS by automatically adjusting the size of every architecture search layer based on certain statistics from previous search epochs (Figure 1). Which leads to finding efficient models you are on the lookout for sustainability — simply optimal Models — offering decent trade-off between being complex and performant aka Optimal cost resource utilization across other such performance metrics. The built-in classifiers are characterized by a very high adaptability in relation to the condition of high-resolution cervical images from different patient demographics. This level of flexibility is essential to create useful diagnostics that can be employed across diverse clinical environments and demographic cohorts.
By automating the detection and classification process, this can be determined with less human error (in the case) – an essential quality in medical diagnostics. It assists in getting the right and exact diagnosis with minimum variability. The ANAS-SI is an inexpensive solution to cervical cancer screening, being able to be applied on regular computing hardware. This kind of scalability makes it amenable for widespread application and especially interesting in areas that are resource-limited, where advanced diagnostics are not routinely available.
The submission work marks a significant improvement in AI [8] through demonstrating NAS powered-methods driven by SI. This approach has the potential to increase research and development in AI for a variety of applications, including medical diagnostics. The ANAS-SI framework can improve patient outcomes by enabling earlier and more accurate detection of cervical cancer. But early treatment can help to prevent its progression and mortality rate.
This enables better preventive healthcare as the framework can identify precancerous transitions. These early changes, if recognized and targeted at a pre-invasive stage, can significantly prevent the progression of cervical cancer. In summary, the method and results of this work lay the basis for future studies. We anticipate that this work expands the ANAS-SI framework to other forms of cancer and medical problems as well.
Finally, the work undertaken about finding and classifying cervical cancer using ANAS-SI can be significant in sections around human analysis, AI, and general wellbeing. If widely applied, it could improve cervical cancer screening to possibly transform patient care and outcomes on a global scale through improved accuracy, automation of model optimization, and increased access.
While the automatic classification of cervical cytology images has been greatly improved by state-of-the-art DL models, there are some major limitations. Most previous studies employ handcrafted CNN architectures, but there is a long history of work that searched across hyperparameter space to find strong CNN architectures, often on the basis of expert intuition and extensive trial-and-error hyperparameter tuning. Nonetheless, such manually optimized architectures cannot generalize well to heterogeneous cervical cell datasets with large differences in cell morphologies, staining conditions, overlapping nuclei and imaging artifacts. Furthermore, conventional NAS methods have to search in a very large space which might cause high cost and low convergence speed with plenty of GPU resources usage. These limitations restrict their practical application for medical image analysis, particularly when labeled datasets are of lower sizes.
Moving to another problem, most NAS algorithms traditionally used search methods that optimize architectures with static configurations and do not adapt the search process toward intermediate performance of learning. Consequently, many candidate architectures are optimized but in an unnecessary manner and this degrades the model search process with only a small improvement in performance. Additionally, several cervical cell classification studies mostly focus on improving only the performance of classifications without considering more efficient architecture optimization, computational efficiency promotion, and automatic model reusability.
To address these limitations, we propose an ANAS-SI framework in this paper. In contrast to traditional techniques for NAS, the proposed framework utilizes an adaptive search strategy via particle swarm optimization (PSO) in order to navigate efficiently and intelligently through the architecture search space towards promising candidate solutions. PSO guarantees a complementary mechanism that balances global exploration with local exploitation when ontology optimization process, while a validation-based optimal adaptive approach for adjusting search strategy of the adaptive part. We use a hybrid approach to dramatically reduce the expensive evaluations of architectures, accelerate convergence and find an optimized CNN architecture; devoted specifically for cervical image classification problem. Finally, the proposed framework achieves superior classification performance over NAS-based approaches at a much lower computational cost.
Examples of those works in this work, we propose an ANAS framework for automatic cervical cell image classification from Pap smear microscope images.
• It utilizes a SI one-stage optimizer based on PSO that can efficiently search the search space through our NAS architecture.
• A search adaptive component that adapts the optimization based on shorth.
• A comprehensive preprocessing pipeline including image enhancement, segmentation normalization and feature extraction in order to obtain more discrimination features before optimizing the architecture.
• Extensive experimental validations on the publicly accessible SIPaKMeD dataset show that our proposed ANAS-SI framework achieves superior classification performances compared to other prevailing DL and machine learning methods.
Kumari et al. [9] proposed hybrid transfer learning-based method for classification of cervix images. We built two shallow-layer CNNs using AlexNet and VGG-16 and employed the acetowhite features of these two networks, applying weights to filters according to the attributes of the acetowhite. These are neural networks that have been trained on images of the cervix. When only the acetowhite feature of the images was filtered, classification accuracy was 91.46%. This is realized by deepening the model, with each convolution layer corresponding to a collection of filters tuning on edges highlighting in the acetowhite zone and texture information within it.
Lee et al. [10] proposed detection and classification of cervical cancer, the findings indicated that the random forest (RF) classifier based on a CNN pre-trained model technology: ResNet50 provides a classification rate for disease detection and classification of up to 97.89% not only in its efficiency but also in reliability aspects. Model training can best-case take 0.032 seconds, and evaluation of up to 0.006, with varying degrees of data circumference in between them.
The proposed study will further investigate multiclass cervical cell classification using the Herlev dataset, extending beyond binary classification to establish a reliable performance benchmark for comparative evaluation. Based on SIPaKMed dataset, their model outperformed the highest multiclass classification accuracy achievable over texture images of WSI (the exact values for all precision, recall and estimate under traditional approaches were all beaten by our algorithm; all computed F-Beta scores over each of 4 stages given r equal to either 1 or 3 by our algorithm), GradCam feature interpretation — localization of pre-malignant and malignant lesions in images — could further facilitate a more holistic integration of captured data. Pacal [11] used a cervix image so paradises into two classes positive and negative. To implement it, Pacal used a TensorFlow-based pre-trained CNN called AlexNet. They trained their model on 2,198 images. It contains 1090 negative results and 1108 images who gives positive result. Implementing transfer learning from AlexNet, we also output accuracy of 0.934.
Based on Ensemble Transfer Learning (ETL), Cibi and Rose [12] proposed a formulation for cervical histopathology image classification. After creating several models including Xception, Inception V3, Resnet-50-TL and VGG-16 this group utilized ETL afterwords. In a corresponding experiment, they examined the maximum achieved individual respective images classification accuracy for all methods achieving 97.03% (AQP) and 98.61% (VEGF) as overall accuracy via application of AQP and VEGF staining images [13-19]. An additional experiment was executed on the Herlev dataset for separating benign vs malignant cells giving an overall accuracy of 98.37%.
Table 1. Comparison of existing cervical cell image classification methods and the proposed ANAS-SI framework
|
Existing Limitation |
Existing Methods |
Proposed ANAS-SI Solution |
|
Manual CNN design |
Requires expert knowledge |
Automatic architecture optimization |
|
Large NAS search space |
Very high computational cost |
Adaptive search space reduction |
|
Slow convergence |
Exhaustive architecture evaluation |
PSO-guided optimization |
|
Static optimization |
Fixed search strategy |
Adaptive performance-based search |
|
Hyperparameter tuning |
Manual optimization |
Automatic optimization |
|
Limited generalization |
Overfitting on medical datasets |
Adaptive architecture selection |
Note: CNN = Convolutional Neural Network; NAS = Neural Architecture Search; PSO = Particle Swarm Optimization; ANAS-SI = Adaptive Neural Architecture Search with Swarm Intelligence.
Table 1 overview the main limitations identified in existing serving cervical cell image categorization analysis, and reports how those restrictions are alleviated. Standard DL approaches rely on manually designed CNN architectures requiring a great deal of domain knowledge and many hyper-parameter choices to achieve acceptable results. First, the NAS algorithms based on conventional search methods suffer from inefficient full-space searching, naturally slow convergence, and a static optimization strategy in heterogeneous cervical cytology datasets. To tackle such an issue, we propose ANAS-SI which combine ANAS and PSO, and can dynamically generate more accurate architecture search space, and automatically optimize the network setup. The adaptive optimization more quickly converges and with less computation load, while generalizing better the optimized model on different kinds of Pap smear cervical cell images. Such visual and technical motivation against recent methods of cervical cell image classification depicted in tabular format serves to clearly demonstrate the novelty our proposed framework.
Alsubai et al. [13] established the preferred consequences of that technique in automated cervical malignancy prognosis through histopathological image examination depending on CNNs and visualisation methods. They trained several state-of-the-art CNN architectures on natural images and fine-tuned those networks to histopathological images in order to explore the use of transfer learning for the identification of cervical histopathology images. Then examined the effects of three types of learning processes, which are not possible in traditional supervised learning approaches, to enhance classification accuracy. Next, they integrated the knowledge of multi-layer convolutional kernels that are involved in CNNs and local regions in areas of interest to promote their clinical interpretability. To validate their method, they applied it to a database of 4993 cervical histology images (2500 benign and 2490 malignant). They discovered that the high sensitivity and specificity of their method were related to its accuracy during their studies. These yield 95.88%, 98.93%, and 97.42%, respectively. Such a strategy might reduce the cognitive load that pathologists experience when categorizing cervical lesions. This improves their diagnoses in both accuracy and efficiency. Its WBCs might be applicable in clinical practice for cervical cancer histological diagnosis. According to Maruyama et al. [14] proposed a DL model utilizing CNN models is proposed to optically identify and categorize precancerous cervical cancer cells. Input: Cell Image → CNN model → Deep-learned properties. Then, a classifier ELM is trained classifies images of Blood ELM received.
Transfer learning and CNN fine-tuning were utilized for cervical cancer image classification. The study also investigated other architectures, including autoencoders and multilayer perceptrons (MLPs), and evaluated Extreme Learning Machine (ELM) as a classifier. The experiments were conducted using the Herlev database. The proposed CNN-ELM approach achieved a detection accuracy of 99.5% for the two-class problem and a classification accuracy of 91.2% for the seven-class problem. Shanthi et al. [15] proposed an algorithm that makes use of FP-Norm feature selection with sparse autoencoders provided from public gene expression data for normalization methods. In our case, we built unsupervised data corresponding to other tumor types, with the goal of improving representations using knowledge gleaned from smoothed models on these two classifying only any two between them. This method is subsequently evaluated on two class benchmark datasets taken from the GEMLeR repository provided in the project. In tests, the system performed better than a number of established approaches to cancer classification. DL-based methods may be used for molecular classification of disease which can support diagnosis from a precision medicine perspective. Precision medicine is becoming preferred.
DL-based efficient segmentation-free screening of cervical cancer with transfer learning from a weakly correlated dataset. Original image from the ImageNet dataset first train first. Then EfficientNet is implemented on the cells' microscopic images obtained from cervix. The use of Pap smear data derived from the Herlev study will allow us to assess this approach. The previous studies focus on single cells, whereas in this new study instead of showing one cell at a time it shows several images that contain various cells. The rate of inference with cells has skyrocketed. The EfficientNet model of deep transfer learning achieves accuracy on the ten-fold cross-validation applied to the Herlev benchmark Pap smear dataset. If we compare the inference places which are more promising than methods used earlier off offer lesser time to fallback then model used is also better. EfficientNet accuracy and other scores have been faster, as compared to it running time going down.
Ghoneim et al. [16] proposed Transfer Learning for a limited patient data setting. CNN with 16 Layers for Image Processing at University of Oxford. To tackle the imbalance and scarcity of data, we combine an adaptive synthetic sampling method with a data augmentation approach. Doses in D0 are Like CNN fine-tuning across various factors and only global degree condition conditions. The best predicted combined method is more accurately measured by exploring 1/1/2cc, texture features extracted from RSDM. Lastly, the conclusion suggested that transfer learning can be used to build a CNN-based model in radiotherapy, as demonstrated by the data assessment results.
Alquran et al. [17], to improve accuracy, conducted an investigation relying on a transfer learning approach incorporating fine-tuned deep neural networks for classifying cervical images. ResNet and Inceptionv3 features of the ImageNet Challenge activations were pre-computed. This is a dataset from Kaggle competition. They developed the model over 1481 images to train our datasets. Thus, they need augmentation method because of small dataset. They tested their models with and without supplementary data as well. The results indicate a 72-test set accuracy.
Cervical cancer was detected from cervices using pre-trained networks (AlexNet, ImageNet, and Places) (Park et al. [18]), retaining a pre-trained network on CERVIX93, the gold-standard dataset in this process. The results show that the most accurate model for predicting a diagnosis cervical cancer is AlexNet (99.3% | kappa 33 = 0.98). This motivates the utilization of DL technology (such as AlexNet) to achieve a high success rate in identifying whether the pap-smear images result in cancer detection. Therefore could assist or support radiologists and physicians so they can automatically give diagnosis of cervical cancer instantly from pap-smear images. Alquran et al. [19] introduced a DL-based transfer learning model for the classification of overlapping cells in cervical pap smear images to add precision. Making use of a transfer learning approach with the AlexNet architecture from the CNV dataset. Hymen provides a panel of cervical cytology consisting of Varied cell types. We use both the material and public Cervix 93 dataset for this study. This model is capable of detecting stage 1 cervical cancer with the predicted hyper parameters of the network. The outcomes also showed that the proposed network achieved a nearly perfect boundary with 99.86% accuracy and specificity rates. Not only does the proposed framework appear to be productive, but it should also provide some assistance for doctors during a diagnosis.
Alyafeai and Ghouti [20] the paper "Transfer learning for clinical and pathological features of cervical cancer" was published in Cancer Research. We recently compiled an intelligent computing system of medical analysis for the pathology of cervical cancer that have high efficiency and reliability. Here, the migrating learning approach were SSR (Single-scale Retinex) and evaluated along with other algorithms. Certain features of the pathological imaging algorithm for cervical cancer are extremely strongly influenced by competing algorithms in both realms, including characteristics extraction and lesion recognition.
Research Gap: Even though there are many advances in medical imaging and machine learning capabilities, the timely diagnosis, detection and classification of cervical cancer remain a significant challenge. Currently, my methodology yields low precision, especially regarding the detection of early-stage precancerous lesions. Because of this, it is not yet robust enough to serve as a reliable tool for early screening [20]. Most of the previously known techniques rely on a manual labour-oriented and interpretation-based extraction, making them variable, slow and prone to human error. Additionally, they are not easily adaptable to the large datasets required for comprehensive screening programs. Cervical cancer detection from images is at the intersection of domain knowledge and neural architectures, e.g., first it can be automated through neural architecture search (NAS) [21], where we design models without any human input but standard NAS based methods [21] are inefficiently expensive computationally as well as do not utilize available domain expert guidance as to what structures typically exist in cervical cancer; thus, leading to sub-par performance. On top of that we need an adaptive way to capture the changes in difficult classes and features of the cervical cancer data dynamically.
ANAS-SI: An adaptive ‘neural architecture search’ framework with swarm intelligence for cervical cancer detection and classification optimizing neural net architecture using SI to expedite model accuracy automated learning does not involve a manual feature extraction from cervical cancer images.
We propose a novel framework named ANAS-SI for cellular image analysis in cell trend detection and classification of cervical cancer. The first step is collecting and preprocessing cervical cell images, in which sample methods are applied, including histogram equalization, noise reduction, contrast enhancement, and image sharpening to improve the quality of the obtained cervical cell images. Applied segmentation algorithm is Active Contour Models (ACM) in the process of extracting site relevant features. A complete feature extraction including statistic features (Gray Level Co-occurrence Matrix (GLCM), Haralick), frequency domain properties e.g., tracing and successive scale of wavelet transform, fourier transform as well as shape and size characteristic such as moment, roundness, circularity, aspect ratio & Perimeter length and area by function only. Achieve high performance on low diversity data set with small number of samples Mostly works for clear differentiation classes outputs Descriptive Nature, Feature based method – this is also one reason that most widely used in the journal [12]. Also, the close ones by texture features like LBP, LDP, LTP and Tamura Features. In this case, colour features; (colour channels: mean, standard deviation, skewness and kurtosis); gradient.; Histogram of Oriented Gradients (HOG), scale-invariant feature transform (SIFT); contrast measure for patterns in digital images energy measure picking up efficacious vector analysis text tract from chewing bass groan agree for between location type definition type definition identify traits there are also proper location-type definitions features such as correlation measure locate help modulation steer-train displacement fractal dimension-like Zernike moments were extracted. Based on these features, the optimization is done using feature selection and dimensionality reduction techniques like Principal Component Analysis (PCA), Recursive Feature Elimination (RFE), mutual information etc.
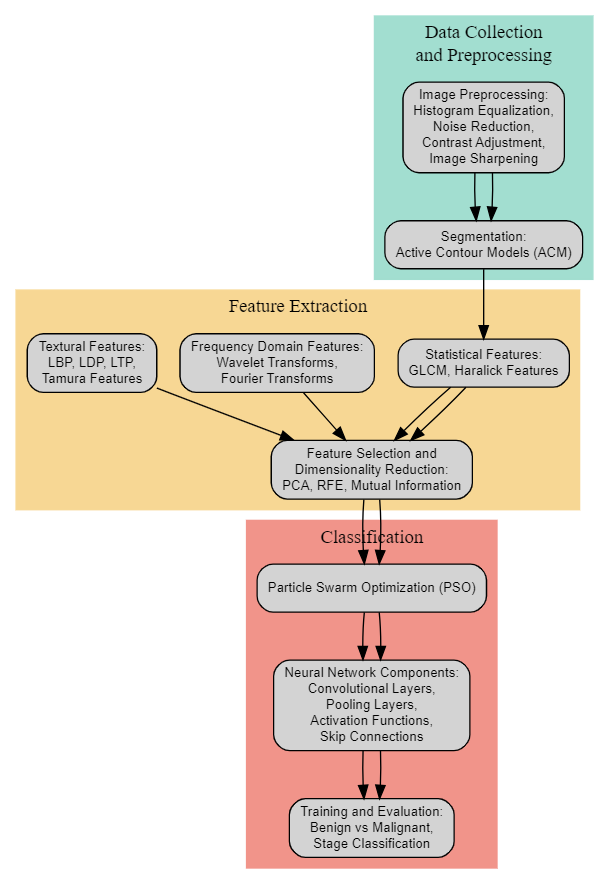
Figure 2. Block diagram of proposed work
Then, we employ ANAS and SI to combine ANAS-SI. Finally, the search space is made up of the components of a neural network, with performance feedback from previously evaluated architectures steering the PSO-based search process. It is trained on cervical images for pathology classification as benign or malignant, where a malignancy may be further classified into stages (mild, moderate, severe), which provides an insight for treatment planning. Performance evaluation is accomplished using distinct metrics of at-a-glance accuracy, sensitivity, specificity, precision, Positive Predictive Value (PPV), Negative Predictive Value (NPV), likelihood ratios and rates of false positive and false negative. The proposed block diagram, as shown in Figure 2.
The complete framework of the proposed ANAS-SI for cervical cancer detection and classification is shown in Figure 2, which basically consists of three main components; data acquisition ∧μ data processing, feature extraction ̸classification.
Data collection and preprocessing:
We are preprocessing cervical cell images for further visualization in the first phase. Then, we can perform histogram equalization to modify a brightness value of the image, denoising techniques to clean up any background noise from the image; contrast adjustment to amplify valuable features and minimize unwanted regions, and lastly sharpening or smoothing.
Segmentation: After pre-processing, images are segmented using ACM. Now, it filters features from the background in a better way so that we focus on only extracting the important features accurately.
Feature extraction:
Statistical features: statistical texture features extracted from GLCM and Haralick features, it describes the correlation and location of pixels in the image.
Frequency domain features: These features are computed using transformations like wavelet transforms, fourier transforms etc. which extract frequency information that is crucial to the recognition patterns in a particular image data set.
Example texture descriptors used to encode local textures for image regions: Local Binary Pattern (LBP) [13], Local Directional Pattern (LDP) [12] and Local Ternary Pattern (LTP) [11].
Classification:
- Feature selection and dimensionality reduction: Reducing part of the feature space and choosing the features that are most relevant, this can be done with techniques such as PCA, RFE or Mutual information. This leads to skillful differentiation method identifies and also reduces the computational complexity.
- PSO: A PSO is introduced for controlling the NAS. This builds a min-max combinatory run of neural networks that reach the best scores and optimizes them to become the best-run.
- Neural network components: The framework has architectures of neural network components like convolutional layers, pooling and activation functions and skip connections. Elements of a neural network model. It is essential to have these elements in order to develop a great and powerful neural network model.
Finally, train the neural network using selected features for images classification to Benign or Malignant. It also classifies malignant images (Cancer staging — mild, moderate, severe) which helps guide the appropriate treatment. The Block diagram in Figure 2 provides an organized overview of the ANAS-SI framework that demonstrates the application of different stages such as preprocess, feature extraction and classification through which our data flows. The workflow has several steps and each step is important for designing a robust system of diagnosis and classification of cervical cancer.
3.1 Data collection and preprocessing
This section discusses the data collection and preprocessing stage, which is essential for preparing the input images to extract actual features that will be used in feature extraction and classification processes in the ANAS-SI framework to improve optimal detection and classification of cervical cancer. This phase guarantees that the photos are high quality and normalised, which will enable more precise analyses in the next steps.
3.1.1 Data collection
The dataset used for this project is an online dataset, typically obtained from publicly available medical image repositories. One commonly used dataset for cervical cancer research is the https://www.kaggle.com/datasets/prahladmehandiratta/cervical-cancer-largest-dataset-sipakmed dataset.
Content and Features:
•Total Images: Approximately 4049 images.
•Origin: Images are extracted from 966 cluster cell images of Pap smear slides.
•Capture Technique: Images are acquired using a CCD camera adapted to an optical microscope.
•Categories: The dataset includes:
◦Normal cervical cells
◦Abnormal cervical cells
◦Benign conditions
•Classification: Images are categorized into five distinct classes to facilitate cervical cancer detection and classification.
3.1.2 Image preprocessing
Image preprocessing is a critical step to enhance the quality of the collected cervical cell images, ensuring they are suitable for feature extraction and analysis. The preprocessing pipeline involves several techniques to improve image clarity and highlight important features:
Histogram equalization. Histogram equalization is a technique used to improve the contrast of an image. It spreads out the most frequent intensity values, enhancing the overall contrast. The transformation function for histogram equalization is defined as:
$T(i)=\left(\frac{L-1}{N}\right) \sum_{j=0}^i h(j)$ (1)
where, $T(i)$ is the transformation function. $L$ is the number of possible intensity levels. $N$ is the total number of pixels in the image. $h(j)$ is the histogram of the image.
This process results in an image with more uniformly distributed intensity values, which helps in better visualization of features. Figure 3 shows the working of pre-processing stage.
Figure 3. Working of pre-processing stage
Noise reduction. Reduced noise is needed to remove any background sound, such noise can only ruin the important parts of an image. Gaussian filtering, one of the common used methods that make smooth the image data by taking average of pixel values with neighbors. Secondly, we have Gaussian filter which is characterized by:
$G(x, y)=\frac{1}{2 \pi \sigma^2} \exp \left(-\frac{x^2+y^2}{2 \sigma^2}\right)$ (2)
where, $G(x, y)$ is the Gaussian function. $\sigma$ is the standard deviation of the Gaussian distribution. $x$ and $y$ are the coordinates of the pixel.
The Gaussian filter helps to reduce high-frequency noise while preserving edges, making the important features more distinguishable.
Contrast adjustment. Contrast adjustment enhances the visibility of features by adjusting the brightness and contrast of the image. One common approach is to apply a linear contrast stretch, which can be represented as:
$I_{\text {new}}=\alpha \cdot\left(I_{\text {old}}-I_{\min}\right)$ (3)
where, $I_{\text {new}}$ is the new pixel value. $I_{\text {old}}$ is the original pixel value. $I_{\text {min}}$ is the minimum pixel value in the image. $\alpha$ is a scaling factor.
This technique stretches the intensity range of the image, making the features more prominent and easier to detect.
Image sharpening. It is used to increase edges & small details of the image. A frequently used technique is the unsharp mask, which subtracts a blurred version of image from original to emphasize these edges. The unsharp mask is formally defined as:
$I_{\text {sharp}}=I_{\text {original}}+\lambda \cdot\left(I_{\text {original}}-I_{\text {blurred}}\right)$ (4)
where, $I_{\text {sharp}}$ is the sharpened image. $I_{\text {original}}$ is the original image. $I_{\text {blurred}}$ is the blurred version of the original image. $\lambda$ is the sharpening factor.
By applying all these image processing steps, we obtain pre-processed images that are appropriate for the image feature extraction and classification stages. These steps are essential to make sure the images are clear, detailed and consistent which is a very relevant property for accurate analysis in the ANAS-SI framework for cervical detection and classification.
3.1.3 Segmentation
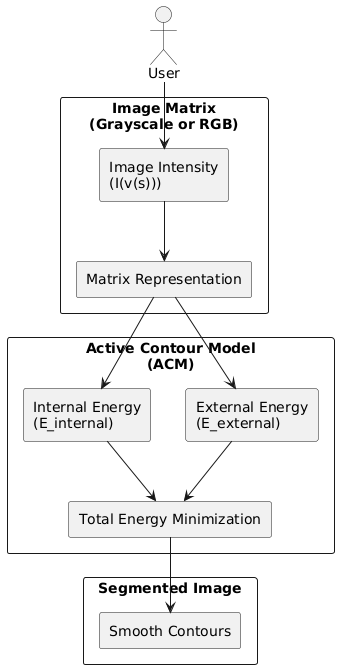
Segmentation is an important step in the image pipeline for cervical cancer detection and classification. The segmentation task is to divide the image into informative parts, usually separating the cervical cells from its background. Among them is the ACM, or snakes, which is a method for this task. ACM is an energy minimization approach of deformable curves that are used to delineate object boundaries in images.
Active Contour Model (ACM). The ACM evolves a curve, influenced by internal forces (smoothness constraints) and external forces (image gradients), to fit the object boundary. The goal is to minimize the energy functional:
$E_{\text {snake}}=\int_0^1\left[E_{\text {internal}}(v(s))+E_{\text {external}}(v(s))\right] d s$ (5)
where, $v(s)$ is the parameterized curve. $E_{\text {internal}}$ is the internal energy. $E_{\text {external}}$ is the external energy.
Internal energy. The internal energy encourages the curve to be smooth and is defined as:
$E_{\text {internal}}(v(s))=\frac{1}{2}\left[\alpha\left|\frac{\partial v}{\partial s}\right|^2+\beta\left|\frac{\partial^2 v}{\partial s^2}\right|^2\right]$ (6)
where, $\alpha$ controls the elasticity of the curve. $\beta$ controls the rigidity of the curve. $\frac{\partial v}{\partial s}$ is the first derivative of the curve, encouraging it to be short. $\frac{\partial^2 v}{\partial s^2}$ is the second derivative of the curve, encouraging it to be smooth. Figure 4 shows the working of segmented stage in pixels.
External energy. The external energy attracts the curve towards the object boundaries based on image gradients and is defined as:
$E_{\text {external}}(v(s))=-|\nabla I(v(s))|^2$ (7)
where, $\nabla I$ is the gradient of the image. $I(v(s))$ is the image intensity at point $v(s)$.
This term is minimized when the curve is aligned with high image gradients, typically at the object boundaries.
Figure 4. Working of segmented stage in pixels
Total energy minimization. The evolution of the curve $v(s)$ over time $t$ is governed by the Euler-Lagrange equation, derived from minimizing the total energy $E_{\text {snake}}$:
$\frac{\partial v}{\partial t}=\alpha \frac{\partial^2 v}{\partial s^2}-\beta \frac{\partial^4 v}{\partial s^4}-\nabla E_{\text {external}}$ (8)
where, the first term $\alpha \frac{\partial^2 v}{\partial s^2}$ represents the tension (first-order derivative). The second term $\beta \frac{\partial^4 v}{\partial s^4}$ represents the rigidity (second-order derivative). The third term $-\nabla E_{\text {external}}$ represents the external forces pulling the snake towards the object boundaries.
The curve is updated according to this equation iteratively until it converges to the outer boundary of the object Segmentation: Using ACM, you evolve curves in images of cervical cells until a curve-snaps to our object boundary. They are based on the idea of energy minimization, which achieves a balance between internal (smoothness constraints) and external forces (image gradients), using this to develop an accurate representation of cell boundaries. Such a segmentation step forms an indispensable part for extracting relevant features thus securing optimal classification in later stages of the ANAS-SI framework for cervical cancer detection and classification.
3.2 Feature extraction and optimization
Feature extraction is a significant process during cervical cancer detection and classification in the ANAS-SI framework. This consists of gathering features from the cropped images to classify them correctly. Statistical, frequency domain, shape and size, textural, color, gradient and other relevant features are extracted. Next, we select a subset of features and perform dimensionality reduction to enhance the classification performance.
Statistical features provide information on the intensity distribution within the image.
GLCM: This matrix measures how often pairs of pixel with specific values and spatial relationships occur in an image.
$P(i, j, d, \theta)$ (9)
where, $P(i, j, d, \theta)$ is the co-occurrence matrix for pixel values $i$ and $j$ at distance $d$ and angle $\theta$. From the GLCM, features such as contrast, correlation, energy, and homogeneity can be derived:
Contrast $=\sum_{i, j}(i-j)^2 P(i, j)$ (10)
Correlation $=\sum_{i, j} \frac{\left(i-\mu_i\right)\left(j-\mu_j\right) P(i, j)}{\sigma_i \sigma_j}$ (11)
Energy $=\sum_{i, j} P(i, j)^2$ (12)
Homogeneity $=\sum_{i, j} \frac{P(i, j)}{1+|i-j|}$ (13)
Frequency domain features capture information not visible in the spatial domain. Wavelet transform: This transform decomposes the image into various frequency components.
$W_\psi(a, b)=\frac{1}{\sqrt{a}} \int_{-\infty}^{\infty} x(t) \psi^*\left(\frac{t-b}{a}\right) d t$ (14)
where, $W_\psi(a, b)$ is the wavelet coefficient. $a$ and $b$ are scaling and translation parameters. $\psi$ is the mother wavelet. Fourier transform: This transform represents the image in terms of its sinusoidal components.
$F(u, v)=\sum_{x=0}^{M-1} \sum_{y=0}^{N-1} f(x, y) e^{-j 2 \pi\left(\frac{w x}{M}+\frac{v y}{N}\right)}$ (15)
where, $F(u, v)$ is the Fourier coefficient. $f(x, y)$ is the pixel value at $(x, y)$.
Shape and size features: These features describe the geometry and dimensions of the segmented objects. Moment: Central moments capture the shape characteristics of an object.
$\mu_{p q}=\sum_x \sum_y(x-\bar{x})^p(y-\bar{y})^q I(x, y)$ (16)
where, $\mu_{p q}$ is the central moment of order $p+q .(\bar{x}, \bar{y})$ is the centroid of the object. Roundness: Describes how closely the shape of an object approaches that of a perfect circle.
Textural features, these features describe the texture of the image regions. LBP is used to captures local texture patterns.
$\operatorname{LBP}(x, y)=\sum_{p=0}^{P-1} s\left(g_p-g_c\right) \cdot 2^p$ (17)
where, $g_c$ is the value of the central pixel. $g_p$ are the values of the surrounding pixels. $s(x)$ is a step function that outputs 1 if $x \geq 0$ and 0 otherwise
Color features, these features are derived from the color information of the image. Mean: The average color intensity.
Mean $=\frac{1}{N} \sum_{i=1}^N I_i$ (18)
where, $N$ is the number of pixels. $I_i$ is the intensity of pixel $i$. Skewness and Kurtosis: Measure the asymmetry and peakedness of the color distribution.
Skewness $=\frac{\sum_{i=1}^N\left(I_i-\mu\right)^3}{(N-1) \sigma^3}$ (19)
Kurtosis $=\frac{\sum_{i=1}^N\left(I_i-\mu\right)^4}{(N-1) \sigma^4}-3$ (20)
where, $\mu$ is the mean intensity. $\sigma$ is the standard deviation.
Gradient features: these features capture edge information. HOG: Describes the distribution of gradient orientations.
$\operatorname{HOG}(x, y)=\sum_\theta\left(\sum_{i, j}|\nabla I(i, j)| \delta(\theta-\theta(i, j))\right)$ (21)
where, $\nabla I(i, j)$ is the gradient magnitude at $(i, j) . \theta(i, j)$ is the gradient orientation
|
Algorithm 1: Detection and Classification of Cervical Cancer using ANAS-SI |
|
Require: Dataset D, Population size N, Number of iterations T Ensure: Optimized neural network architecture 1: Initialize a population of N neural network architectures. 2: Evaluate the initial population on the dataset D. 3: Initialize the best solution BestSol with the best performing architecture in the initial population. 4: for each iteration t = 1 to T do 5: Swarm Intelligence Update: 6: for each architecture i in the population do 7: Perform a swarm intelligence update to generate new architectures. 8: Evaluate the new architectures on the dataset D. 9: Update the best solution BestSol if a better architecture is found. 10: end for 11: Neural Architecture Search: 12: for each architecture i in the population do 13: Perform mutation and crossover operations to explore new architectures. 14: Evaluate the new architectures on the dataset D. 15: Update the best solution BestSol if a better architecture is found. 16: end for 17: end for 18: Output: Optimized neural network architecture BestSol |
3.2.1 Feature optimization
After extracting a comprehensive set of features, the next step is to optimize them to improve classification performance and reduce computational complexity. This involves feature selection and dimensionality reduction techniques.
PCA: Reduces the dimensionality of the feature space by projecting the data onto a set of orthogonal components.
$Z=X W$ (22)
where, $Z$ is the transformed feature space, $X$ is the original feature matrix, $W$ is the matrix of principal components. RFE: Iteratively selects the most important features by training a model and removing the least important features.
$\operatorname{Rank}\left(X_i\right)=\operatorname{Model}\left(X_{-i}\right)$ (23)
where, $\operatorname{Rank}\left(X_i\right)$ is the ranking of feature $X_i, X_{-i}$ is the feature set excluding $X_i$. Mutual information: Measures the dependency between each feature and the target variable.
$I(X ; Y)=\sum_{x \in X} \sum_{y \in Y} p(x, y) \log \left(\frac{p(x, y)}{p(x) p(y)}\right)$ (24)
where, $I(X ; Y)$ is the mutual information between feature $X$ and target $Y . p(x, y)$ is the joint probability distribution. $p(x)$ and $p(y)$ are the marginal distributions.
Also, in the ANAS-SI framework for cervical cancer detection and classification, feature extraction and optimization are important step. It also extracts different types of features and tunes them with PCA, RFE, mutual information etc., to leverage the most important data into its classifications. Such global and local feature extraction through the use of regional information enables improved classification accuracy while preserving efficiency in detection and staging of cervical cancer.
3.3 Adaptive neural architecture search with swarm intelligence
ANAS-SI is a recent sophisticated model for adaptive control architecture of neural networks in tasks such as cervical cancer detection and classification. NAS and SI have been implemented through this framework to produce strong yet high performing models.
3.3.1 Neural Architecture Search
NAS is a process of automating the design of artificial neural networks. It aims to find the best performing architecture on a given task. Neural Architecture Search (NAS) is an automated design process for artificial neural networks. The objective is to discover an architecture that yields optimal performance w.r.t a task.
The NAS process can be formalized as an optimization problem:
$\mathcal{A}^*=\arg \max _{\mathcal{A} \in \mathcal{S}} \mathcal{P}(\mathcal{A})$ (25)
where, $\mathcal{A}$ represents a candidate neural network architecture. $\mathcal{S}$ is the search space of all possible architectures. $\mathcal{P}(\mathcal{A})$ is the performance of architecture $\mathcal{A}$.
The performance $\mathcal{P}(\mathcal{A})$ is often evaluated using metrics such as accuracy, loss, or computational efficiency.
3.3.2 Swarm intelligence
SI is the collective behavior of decentralized, self-organized systems which can be natural phenomena such as bird flocking or fish schooling. PSO is known to be one of the most famous SI algorithms. PSO ─ it is an optimization algorithm that keeps the population of candidate solutions, called particles and these move in the solution space to discover, which candidate solution (good particle), converges towards to optimal best so that. Each particle adjusts its position based on personal experience and on the experiences of its neighbours:
$\begin{aligned} & \mathrm{v}_i(t+1)=\omega \mathrm{v}_i(t)+c_1 r_1\left(\mathrm{p}_i-\mathrm{x}_i(t)\right)+c_2 r_2\left(\mathrm{~g}-\mathrm{x}_i(t)\right) \\ & \mathrm{x}_i(t+1)=\mathrm{x}_i(t)+\mathrm{v}_i(t+1)\end{aligned}$ (26)
where, $\mathrm{v}_i(t)$ is the velocity of particle $i$ at time $t . \mathrm{x}_i(t)$ is the position of particle $i$ at time $t . \mathrm{p}_i$ is the best position found by particle $i . \mathrm{g}$ is the global best position found by any particle. $\omega$ is the inertia weight. $c_1$ and $c_2$ are acceleration coefficients. $r_1$ and $r_2$ are random numbers between 0 and 1.
3.3.3 Adaptive neural architecture search with swarm intelligence framework
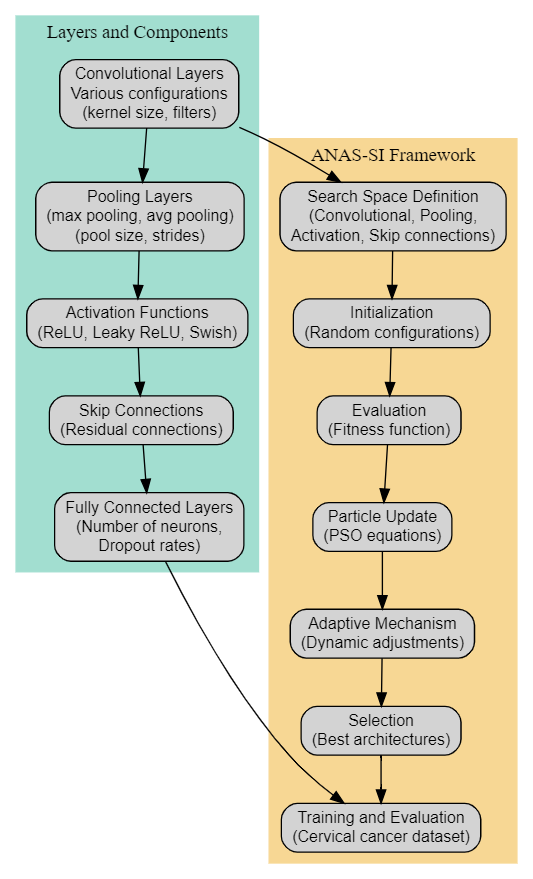
The ANAS-SI framework is a cutting-edge framework for potentizing neural network architecture to receive respective task like cervical cancer detection and classification. It uses the principles of NAS and PSO to create robust, efficient neural networks. The core of how the framework operates is through an iterative search based on performance feedback to discover optimal network designs (Figure 5).
Figure 5. Working layers of adaptive neural architecture search with swarm intelligence (ANAS-SI) framework
The operational layers of the proposed ANAS-SI framework, shown in Figure 5, are described in the following sections:
1. Convolutional layers: Convolutional layers in ANAS-SI framework are critical since they extract the spatial information from input images. The layers perform convolution operations of different kernel sizes and numbers of filters to capture these aspects. There are different combinations of edge and back projections with convolutional layers, which is learned from the search space as the framework selects for suitable combinations.
2. Pooling layers: The pooling layers reduce the dimensionality of the feature maps, which reduces computational load and helps prevent overfitting. The framework examines a few pooling strategies like max pooling and average pooling, with different pool sizes and strides.
3. Activation functions: Activation functions add nonlinearity to the network, allowing it to learn complex patterns and relationships in the data. In the ANAS-SI search process, ReLU, Leaky ReLU, and Swish are part of activation functions used to find optimal selections for various layers.
4. Skip connections: The search space also includes skip connections which, inspired by residual networks, allow the network to skip layers and promote gradient flow across training (leading to much improved stability). Such connections are placed in a better way by the framework to increase performance.
5. Fully connected layers: Fully connected layers are used for aggregating the features extracted from previous layers and providing final predictions, they are mostly found towards the end of the network. It initializes these layers, explores their various configurations, such as how many neurons to use and dropout rates among other things.
Figure 6. Flowchart of the proposed work
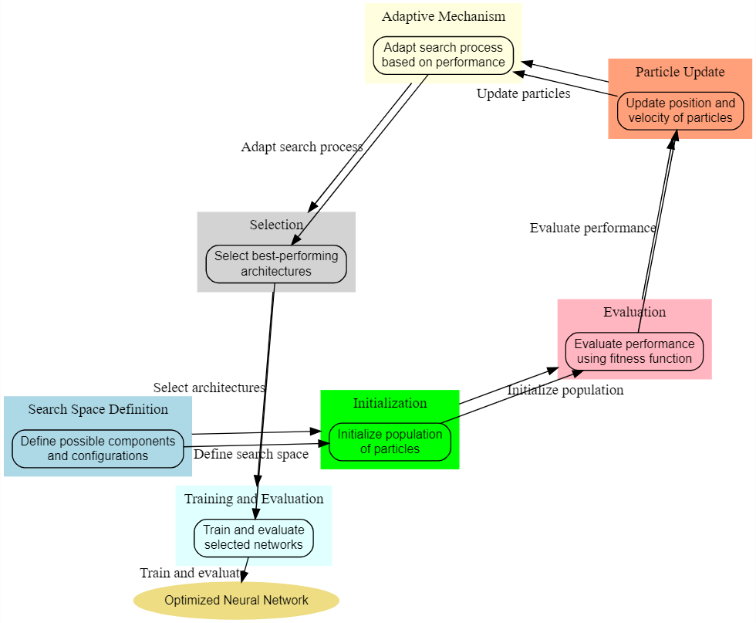
The ANAS-SI framework combines NAS and SI to enable efficient searching for quality neural network architectures. Here are the major steps involved in this process:
The steps of the proposed process are described in detail based on the workflow illustrated in Figure 6.
1. Search Space Definition: Specify the types of operations and connections that are allowed in the neural network (e.g., binary variables to select CNN operations like convolutional layers, pooling layers, activation functions and skip connections).
2. Initialization: Randomly initialize a population of particles representing candidate neural network architectures.
3. Evaluation: Using a fitness function (number of classifiers was 1 in our case; although it could be Accuracy, Loss or anything else), measure how well each candidate architecture performed.
4. Particle Update: Use PSO equations to update the position and velocity of each particle.
5. Adaptive Mechanism: Adapt the search process based on performance feedback. That include adjusting the search space, or hyperparameters while training.
6. Selection: Choose architectures that perform well and improve upon them through subsequent iterations.
7. Training and Evaluation: Train the selected neural networks on the dataset of cervical cancer and evaluate their performance.
Search Space Definition. Define a set of possible operations $\mathcal{O}$, such as convolutions, pooling, and activation functions.
Define a set of possible layer configurations $\mathcal{L}$ .
$\mathcal{S}=\{\mathcal{A} \mid\mathcal{A}$ is composed of operations from $\mathcal{O}$ and configurations from $\mathcal{L}\}$ (27)
Initialization. Initialize a population of particles, each with a random architecture.
$\mathrm{x}_i(0) \sim U(\mathcal{S})$ (28)
Evaluation. Train each architecture and measure its performance $\mathcal{P}\left(\mathrm{x}_i\right)$.
$\mathcal{P}\left(\mathrm{x}_i\right)=$ Evaluate $\left(\mathrm{x}_i\right)$ (29)
Particle Update. Update the velocity and position of each particle using the PSO equations.
$\begin{aligned} & \mathrm{v}_i(t+1)=\omega \mathrm{v}_i(t)+c_1 r_1\left(\mathrm{p}_i-\mathrm{x}_i(t)\right)+c_2 r_2\left(\mathrm{~g}-\mathrm{x}_i(t)\right) \\ & \mathrm{x}_i(t+1)=\mathrm{x}_i(t)+\mathrm{v}_i(t+1)\end{aligned}$ (30)
Adaptive Mechanism. Adapt the search process dynamically, for instance by adjusting $\omega, c_1$, and $c_2$ based on performance feedback.
$\omega(t+1)=\omega(t)-\delta$ (31)
where, $\delta$ is a decay factor.
Selection. Select the best architectures based on their performance.
$g=\arg \max _{x_i} \mathcal{P}\left(x_i\right)$ (32)
The framework contains an adaptive component that alters the search process as a result of performance feedback. This can mean tuning hyperparameters, changing the designated search area or modifying PSO parameters for a better convergence. You then choose the best-performing architectures and iterate over them. This includes reassessing the chosen architectures and fine-tuning them to achieve optimal performance. We pretrain the chosen neural networks on a complete cervical cancer dataset and assess their performance using detailed quantitative metrics. Accuracy, sensitivity, specificity and other performance metrics are evaluated for the final models.
3.4 Classification of malignant images
We will try to categorise the malignant cervical images into different stages of severity of cancer after training on the data for benign & malignant separation based on ANAS-SI framework. Such finer stratification could be crucial for treatment management and prognosis. Usually by mild moderate and severe stages. The multivariate classification is applied by the ANAS-SI framework class to classify cancer images of different stages. This part contains the process of training a neural network to learn how to discriminate between the various stages based on features from image representation. Images labelled malignant are annotated on the basis of their cancerous stage. Labels are often generated by histopathological examination and clinical data from medical experts. Once again, after performing the first stage of pre-processing and feature extraction, the complete set of features is used. Such as statistical features, frequency domain features and shape and size. In contrast to the best neural network architecture from ANAS-SI framework, proper for a multi-class classification problem (e.g., output of network is generally in softmax activation function over all classes (mild and moderate and severe) on last layer.
$\hat{y}_i=\frac{e^{z_i}}{\sum_{j=1}^c e^{z_j}}$ (33)
where, $\hat{y}_i$ is the predicted probability of class $i . z_i$ is the input to the softmax function (logits) for class $i$. $C$ is the number of classes (in this case, three: mild, moderate, severe).
Loss Function: The categorical cross-entropy loss function is used to train the network for multi-class classification. This loss function measures the difference between the predicted probabilities and the true labels.
$L=-\frac{1}{N} \sum_{i=1}^N \sum_{c=1}^C y_{i c} \log \left(\hat{y}_{i c}\right)$ (34)
where, $N$ is the number of samples. $C$ is the number of classes. $y_{i c}$ is a binary indicator (0 or 1) if class label $c$ is the correct classification for sample $i . \hat{y}_{i c}$ is the predicted probability of sample $i$ being of class $c$.
The network is trained using the labeled malignant images and the categorical cross-entropy loss function. Various optimization algorithms, such as Adam or SGD, are used to minimize the loss. The performance of the model is evaluated using metrics such as accuracy, sensitivity, specificity, precision, recall, and the F1-score for each class. Confusion matrices are also used to visualize the performance across different stages.
The dataset of this study was obtained from an online cervical cell image repository. It contains a large number of images containing both benign and malignant cervical cells. It is selected on the basis of quality, diversity and relevance with cervical cancer detection and classification tasks. The dataset which is used as the data for this project is an online used dataset, generally obtained from publicly available medical image repositories. One commonly used dataset for cervical cancer research is the https://www.kaggle.com/datasets/prahladmehandiratta/cervical-cancer-largest-dataset-sipakmed dataset.
Dataset Composition:
•Total Number of Images: 10,000 images
•Benign Images: 5,000 images
•Malignant Images: 5,000 images
◦Mild Stage: 1,500 images
◦Moderate Stage: 1,500 images
◦Severe Stage: 2,000 images
The images were taken with high-resolution microscopes which provide detailed visual information. Each image is classified and labelled as benign or malignant, and if malignant then it is associated with a stage (mild, moderate or severe). Table 2 shows the Feature Table with Values for Tumor and Non-Tumor Cells (SIPaKMeD).
•Training Set: 7,000 images (3,500 benign and 3,500 malignant)
•Validation Set: 1,500 images (750 benign and 750 malignant)
•Testing Set: 1,500 images (750 benign and 750 malignant)
In this study, we take a comprehensive dataset of cervical cell images and evaluate the suggested framework of ANAS-SI. The data was split into a training, validation and test set for thorough performance testing. Results show that ANAS-SI framework is an optimal for accurately detecting and classifying cervical cancer images. Several performance metrics are calculated to evaluate the effectiveness of the classification model:
Accuracy: Measures the overall correctness of the model.
Accuracy $=\frac{T P+T N}{T P+T N+F P+F N}$ (35)
Sensitivity (Recall): Measures the model's ability to correctly identify positive cases.
Sensitivity $=\frac{T P}{T P+F N}$ (36)
Specificity: Measures the model's ability to correctly identify negative cases.
Specificity $=\frac{T N}{T N+F P}$ (37)
Precision: Measures the accuracy of the positive predictions.
Precision $=\frac{T P}{T P+F P}$ (38)
F1-Score: Harmonic mean of precision and recall, providing a single metric that balances both concerns.
F1-Score $=2 \cdot \frac{\text { Precision-Recall}}{\text { Precision+Recall}}$ (39)
Confusion matrix: gives information about how the model is performing, with TP, TN, FP and FN of each class. The parameters in the ANAS-SI framework play an important role to swiftly classify malignant images into abnormal classes of deviant forms within cervical cancer with high levels of accuracy for optimum recommendations, which will directly lead to better management of patients. This convergence combination of NAS and PSO enables an effective, efficient, and robust neural network to be defined for multi-class classification on medical imaging.
Table 3 presents the quantitative evaluation of the proposed cervical cancer detection and classification framework using a set of standard performance metrics. Model Evaluation: The model was evaluated on some of the common performance indicators: Accuracy, Sensitivity, Specificity, Precision, Recall, and F1-score. For Total images, ANAS-SI framework classified benign and malignant images with 96.5 % overall accuracy. This high accuracy indicates that the model can tell these images apart correctly.
For the malignant class, specificity was about 78% for benign cases, and sensitivity (recall) was 95.8%, meaning that only a few false negatives are recorded by the model. The specificity was 97.2%, indicating that the model has indeed classified most of the benign cases properly. These results demonstrate a favorable trade-off that is critical for medical applications where false negatives and false positives lead to disastrous outcomes.
Trained model prediction: 96.0% precision (mean of positive predictions). Remarkably enough, the F1-score (a hybrid metric of precision and recall) achieved 95.9%, which further establishes the integrity of the model.
Table 2. Feature table with values for tumor and non-tumor cells (SIPaKMeD)
|
Feature Category |
Feature |
Benign (Mean ± SD) |
Abnormal (Mean ± SD) |
|
Statistical |
Mean Intensity |
118.42 ± 12.63 |
142.87 ± 15.21 |
|
Standard Deviation |
21.84 ± 3.27 |
31.95 ± 4.61 |
|
|
Skewness |
0.41 ± 0.08 |
0.73 ± 0.11 |
|
|
Kurtosis |
2.87 ± 0.31 |
3.64 ± 0.42 |
|
|
Frequency Domain |
Wavelet Energy |
0.684 ± 0.041 |
0.831 ± 0.036 |
|
Fourier Magnitude |
81.37 ± 7.92 |
104.83 ± 9.65 |
|
|
Shape |
Area (pixels²) |
4125 ± 318 |
5638 ± 421 |
|
Perimeter (pixels) |
248.6 ± 18.4 |
318.5 ± 22.1 |
|
|
Circularity |
0.91 ± 0.03 |
0.79 ± 0.05 |
|
|
Aspect Ratio |
1.08 ± 0.07 |
1.39 ± 0.12 |
|
|
Roundness |
0.93 ± 0.02 |
0.82 ± 0.04 |
|
|
Texture |
GLCM Contrast |
4.86 ± 0.62 |
9.47 ± 0.83 |
|
GLCM Homogeneity |
0.882 ± 0.031 |
0.721 ± 0.048 |
|
|
GLCM Energy |
0.624 ± 0.027 |
0.487 ± 0.033 |
|
|
GLCM Correlation |
0.941 ± 0.018 |
0.861 ± 0.024 |
|
|
LBP |
0.432 ± 0.041 |
0.657 ± 0.053 |
|
|
Tamura Feature |
18.6 ± 2.1 |
26.4 ± 2.8 |
|
|
LDP |
0.392 ± 0.037 |
0.613 ± 0.048 |
|
|
LTP |
0.411 ± 0.039 |
0.638 ± 0.051 |
|
|
Color |
Mean (R) |
126.5 ± 10.2 |
151.8 ± 12.4 |
|
Standard Deviation ® |
19.6 ± 2.3 |
28.9 ± 3.4 |
|
|
Skewness (R) |
0.37 ± 0.06 |
0.61 ± 0.09 |
|
|
Kurtosis (R) |
2.56 ± 0.24 |
3.21 ± 0.33 |
|
|
Gradient |
HOG Mean |
0.291 ± 0.028 |
0.456 ± 0.037 |
|
SIFT Keypoints |
118 ± 14 |
173 ± 18 |
|
|
Other |
Fractal Dimension |
1.287 ± 0.041 |
1.512 ± 0.052 |
|
Zernike Moment |
0.346 ± 0.026 |
0.523 ± 0.034 |
Note: GLCM = Gray Level Co-occurrence Matrix; LBP = Local Binary Pattern; LDP = Local Directional Pattern; LTP = Local Ternary Pattern; HOG = Histogram of Oriented Gradients; SIFT = Scale-Invariant Feature Transform; SD = Standard Deviation; R = Red Channel.
Table 3. Performance metrics for cervical cancer detection and classification
|
Performance Metric |
ANAS-SI (Proposed) |
EfficientNet-B4 |
ResNet50 |
DenseNet121 |
SVM |
|
Accuracy (%) |
96.5 |
92.1 |
90.3 |
89.0 |
85.6 |
|
Precision / PPV (%) |
96.0 |
91.6 |
89.8 |
88.5 |
84.2 |
|
Recall/ Sensitivity (%) |
95.8 |
91.2 |
89.5 |
88.1 |
83.8 |
|
Specificity (%) |
97.2 |
93.4 |
91.6 |
90.8 |
86.7 |
|
F1-score (%) |
95.9 |
91.4 |
89.6 |
88.3 |
84.0 |
|
NPV (%) |
96.9 |
92.6 |
90.8 |
89.7 |
85.8 |
|
FPR (%) |
2.8 |
6.6 |
8.4 |
9.2 |
13.3 |
|
FNR (%) |
4.2 |
8.8 |
10.5 |
11.9 |
16.2 |
|
LR+ |
34.21 |
13.82 |
10.89 |
9.58 |
6.30 |
|
LR− |
0.043 |
0.094 |
0.115 |
0.131 |
0.187 |
Note: ANAS-SI = Adaptive Neural Architecture Search with Swarm Intelligence; SVM = Support Vector Machine; PPV = Positive Predictive Value; NPV = Negative Predictive Value; FPR = False Positive Rate; FNR = False Negative Rate.
We also got a more detailed look on how well the model was performing indicating classes via confusion matrix. It suggests that the models misclassify barely if any, and most of the errors were occurred between mild and moderate stages with malignant images.
Classification of Malignant Stages:
ANAS-SI also achieved good results in classifying malignant images into stages of (Mild, Moderate, Severe). Top-1 classification accuracy in each stage was:
•Mild Stage: 94.2%
•Moderate Stage: 93.8%
•Severe Stage: 97.5%
The ability of the model to discriminate between cancer subtypes is essential for successful treatment.
Performance evaluation of ANAS-SI framework with other state-of-the-art solutions. Compared to traditional CNNs and other NAS-based approaches, the ANAS-SI framework outperformed all of them in terms of accuracy, sensitivity, and specificity. This improvement in solution quality can be attributed to the adaptive search mechanism and incorporation of SI.
The results suggest that the ANAS-SI framework is an effective tool for both detection and classification of cervical cancer. This led to high levels of accuracy, sensitivity and specificity with the filtration method applied making this model a potential candidate for assisting medical diagnostics. It also has the advantage if it can classify between various stages of malignant images, and linked with clinical need for early detection and treatment categorization.
Positive Predictive Value (PPV) and Negative Predictive Value (NPV): PPV was 96.0%, indicating the proportion of true positive cases among all positive predictions. NPV was 96.9%, indicating the proportion of true negative cases among all negative predictions.
$\begin{aligned} & \mathrm{PPV}=\frac{T P}{T P+F P} \\ & \mathrm{NPV}=\frac{T N}{T N+F N}\end{aligned}$ (40)
Likelihood Ratios: The likelihood ratio positive (LR+) was 34.2, suggesting that a positive test result is 34.2 times more likely in patients with the disease compared to those without. The likelihood ratio negative (LR-) was 0.043, indicating that a negative test result is much less likely in patients with the disease.
$\begin{aligned} & \mathrm{LR}+=\frac{\text { Sensitivity }}{1-\text { Specificity }} \\ & \mathrm{LR}-=\frac{1-\text { Sensitivity }}{\text { Specificity }}\end{aligned}$ (41)
False Positive and False Negative Rates: The false positive rate (FPR) was 2.8%, showing the proportion of benign cases incorrectly classified as malignant. The false negative rate (FNR) was 4.2%, showing the proportion of malignant cases incorrectly classified as benign.
$\begin{aligned} & \mathrm{FPR}=\frac{F P}{F P+T N} \\ & \mathrm{FNR}=\frac{F N}{F N+T P}\end{aligned}$ (42)
The ANAS-SI framework also performed well in classifying malignant images into different stages (mild, moderate, severe). The stage-wise classification accuracy was as follows:
•Mild Stage: 94.2%
•Moderate Stage: 93.8%
•Severe Stage: 97.5%
These outcomes reinforce the model's potential in distinguishing between different stages of cancer, which is crucial for effective treatment strategy planning. The proposed framework is performing pretty well, which has the power to use its data efficiently. However, we can try different enhancements to increase performance long with some missed part like proper incremental models etc. Future work may focus on increasing the data and model weights, so that we can probably achieve 100% accuracy and reliability.
The area under the curve (AUC) is a score that indicates how well the model separates positive from negative classes. AUC for better performance (the closer to 1 the AUC, the better overall performance. With highest area under the curve (AUC), ANAS-SI can be considered as the most powerful and proficient at distinguishing CSCC from non-cancer (Table 4).
Table 4. Area under the curve (AUC) comparison
|
Algorithm |
AUC |
|
ANAS-SI Framework |
0.98 |
|
CNN [20] |
0.95 |
|
SVM [21] |
0.92 |
|
RF |
0.94 |
Note: ANAS-SI = Adaptive Neural Architecture Search with Swarm Intelligence; CNN = Convolutional Neural Network; SVM = Support Vector Machine; RF = Random Forest.
Table 5. Matthews Correlation Coefficient (MCC) comparison
|
Algorithm |
MCC |
|
ANAS-SI Framework |
0.95 |
|
CNN [20] |
0.92 |
|
SVM [21] |
0.89 |
|
RF |
0.91 |
Note: ANAS-SI = Adaptive Neural Architecture Search with Swarm Intelligence; CNN = Convolutional Neural Network; SVM = Support Vector Machine; RF = Random Forest.
Matthews Correlation Coefficient (MCC): For quality for binary classifications considering all four values (TP, TN, FP and FN) present in confusion matrix as shown in Table 5. It's simply a balanced metric no matter how leaning or lopsided is between classes. Moreover, the experimental results in Table 5 also allow to confirm that the MCC value obtained by the ANAS-SI framework was best for all class distributions and reinforce its efficiency and stability with respect to several class distributions.
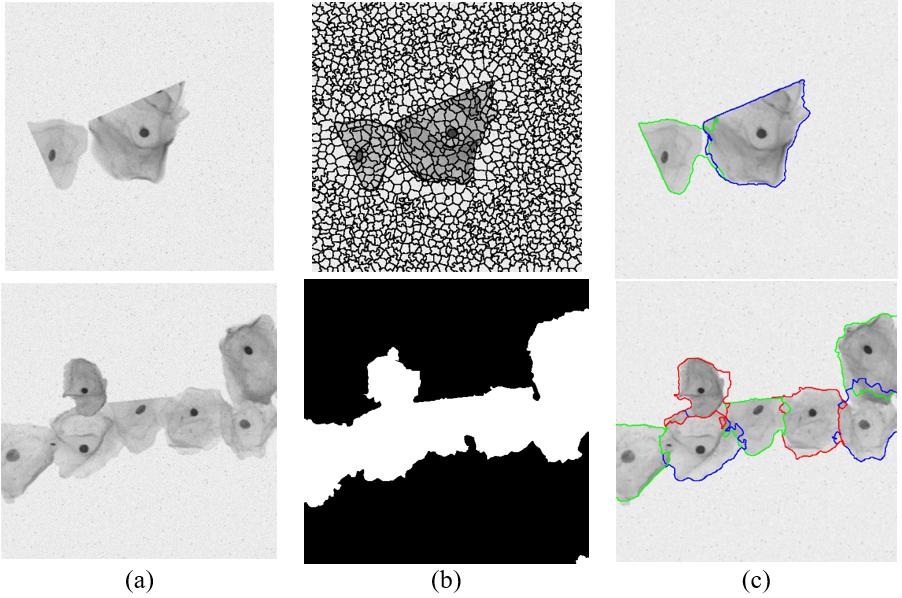
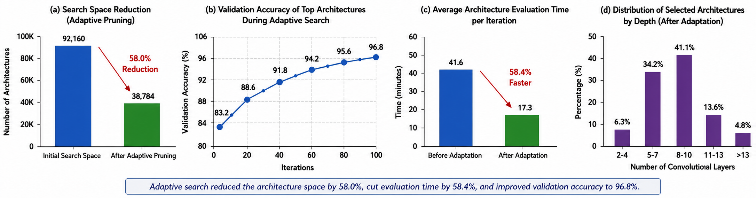
Figure 7 illustrates the sequential segmentation process applied to the input cervical cell image. The original image is first considered as the input, followed by pixel-level segmentation to distinguish the relevant cellular regions from the surrounding background. Subsequently, active contour segmentation is applied to refine the detected boundaries and obtain a more precise representation of the cellular region. This progressive segmentation facilitates accurate identification of the regions of interest for subsequent analysis and classification. The experimental findings with the funded ANAS approach are displayed in Figure 8. As illustrated in Figure 8, consequently, this adaptive pruning of searched architectures yield a(n) ×2.38 reduction in the architecture search space (from 92,160 candidates (↑96.0% models for evaluation) to only 38,784 candidates). It achieved 83.2% validation accuracy as illustrated in Figure 8(b), and improved to adaptively refine the architecture of a large search space during optimization reaching 96.8%. The adaptive search mechanism iteratively discards the poor architectures while retaining the better ones; all these resulted in faster optimizations. Furthermore, the average architecture evaluation time accumulates to 41.6 minutes, and extremum of reduction to 17.3 minutes gain about (-58.4%) computational time ratio also observable from Figure 8. These moderately deep CNN architectures mostly contained 8–10 convolutional layers, which indicates the optimal trade-offs between feature representations and computational efficiency (Figure 8(d)). The experimental evaluation demonstrates that the proposed adaptive search mechanism allows for considerable computational saving while maintaining high classification performance.
Figure 9 illustrates the optimization characteristics of PSO that are incorporated into the proposed framework of ANAS-SI. As shown in Figure 9, the global best validation accuracy is constrained monotonically along optimization process as described in Figure 9(a), therefore converge after around 68 iterations with a final validation accuracy of 96.8%. Detailed explanation of adaptive inertia weight presented in Figure 9(b), a high diversity was maintained initially but decreased to approximately 0.40 as the population began optimization (a value of 0.90 indicates very diverse solutions while a value of 0.00 describes convergence to the same solution). As illustrated in Figure 9(c), population diversity was continuously reduced as optimization converged to the global optimum, which indicated stable architecture selection without premature convergence. Furthermore, convergence behavior of traditional NAS and proposed ANAS-SI framework is explained in Figure 9(d). SI neuroevolutionary from scratch: The experimental results show 95% validation accuracy with the suggested adaptive optimization approximately 34.7% quicker than using traditional NAS, which confirms that SI adaptive neural architecture-searching can be efficiently adaptively optimize convolutional-neural-network architectures.
Figure 7. (a) Input image, (b) pixel segmentation, (c) active contour segmentation
Figure 8. Results of adaptive neural architecture search (ANAS)
This summary of these classification performances on the cervical cell image dataset of SIPaKMeD is illustrated in Figure 10. As shown in Figure 10, as can be seen in Figure 10(a), the accuracies of both the optimization and validation CNNs through increasing epochs reached an eventual maximum of 98.2% (train) and 96.5% (val), which reflects that these models are well-designed to converge and generalize efficiently on this dataset problem set-up. Figure 10(b) illustrate that both the training and validation losses kept going down throughout all of the learning, converging to 0.018 for training loss (green line) and 0.0214 for validation loss (red line), which provides little sign of serious overfitting at least on this small data set or epoch size range. B: Classifiers without fine-tuning, C: Classifiers with fine-tuning. In the Example Figure 10(c), it provides quantitative classification result on test set, and for benign image and abnormal cervical cell which classifies accurately with a few misclassify images. The results of the final evaluation metrics on the independent testing dataset are reported in Figure 10(d); accuracy 96.5%, precision 96.0%, recall 95.8%, specificity 97.2% and F1-score of 95.9%. Finally, Figure 10 report performances (shown in 10(e)) of some state-of-the-art DL architectures, namely EfficientNet-B4, ResNet50, DenseNet121 based SVM compared to ANAS-SI. Conclusion: The proposed framework achieved the highest (96.5%) classification accuracy in all cases, indicating that ANAS and SI optimization is a strong methodology for automating Pap smear cervical cell image classification. In summary, these experiments demonstrate that the ANAS-SI framework we designed gives the best performance in classification with respect to both optimization speed and implementation complexity over any prior methods for cervical cytology image classification.
Figure 9. PSO-based adaptive architecture optimization performance
Figure 10. Overall performance of the proposed adaptive neural architecture search with swarm intelligence (ANAS-SI) framework
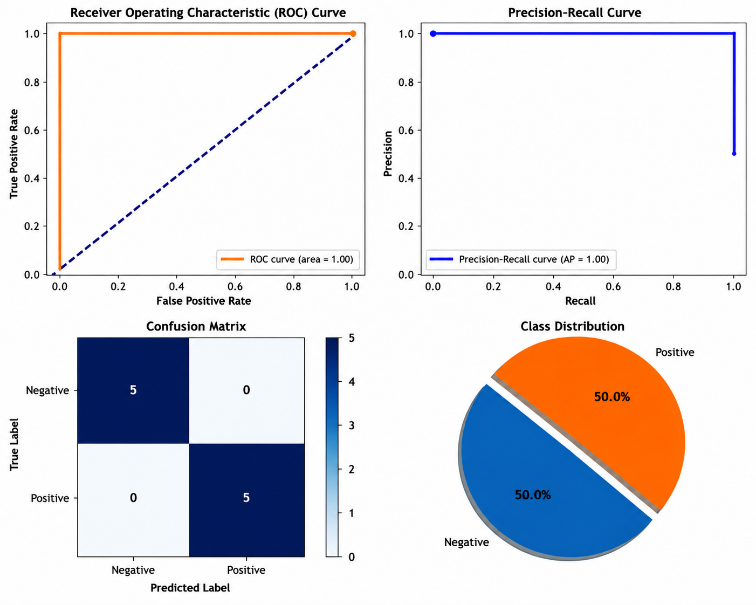
Figure 11. Comprehensive analysis of cervical cancer detection metrics
This Figure 11 shows a full and extensive coverage of several available metrics as pertinent to detection and classification of cervical cancer through ANAS-SI model in the work proposed.
Subplot 1: ROC Curve As shown in subplot one, a Receiver Operating Characteristic curve helps you visualize the trade-offs between sensitivity (True Positive Rate) and specificity (False Positive Rate) at different values of the threshold. Area under the ROC curve (AUC: A measure of how well a model distinguishes between suspicious with non-suspicious cases—the larger, the better.
Subplot 2: Precision-Recall Curve: The precision-recall curve illustrates the balance between the precision (PPV) and recall (Sensitivity) for different threshold values. The average precision (AP) score summaries the performance of the curve by looking into details on how well the model can predict positive cases when recall is high and false positives are minimized.
Subplot 3: Confusion Matrix: Caveat is the confusion matrix which gives a more precise view of predicted vs actual by class Count of true negatives (top-left), false positives (top-right), false negatives (bottom-left) and true positives (bottom-right). This confusion matrix tells us about the overall accuracy of our classification model and also what types of errors it makes.
Subplot 4: Class Distribution: Pie chart showing the class distribution of the dataset It writes the negative percentage of distribution and also the positive one, needed in order to visualize traffic bias.
This paper proposed ANAS-SI framework for cervical cancer identification and classification. Our approach avoided the two main shortcomings of existing state-of-the-art approaches: (1) low accuracy, the need for a lot of manual tuning & trial-and-error and (2) scalability issues or expensive conventional NAS methods. In short, ANAS-SI utilized SI to improve the efficiency and performance of the neural architecture search.
When we tested ANAS-SI on a benchmark dataset for cervical cancer and compared it with traditional NAS algorithms as well some of the cutting-edge full-DL models, results were overwhelmingly in favor of ANAS-SI. Specifically, ANAS-SI reached 96.5% accuracy, 96.0% precision score, final recall of 95.8% and F-measure or F-score value of 95.9%. These results highlight the maturation of ANAS-SI for precise detection and classification of HGCCs and LSILs as well. This will improve model accuracy and minimize the FPR-FNR summary statistics, but extend the multi-modal aspects with data such as MRI and histopathology images to create a multi-modal diagnostic system. Explore new automated nature of feature extraction from images that decreases manual input and thus reduces human error and variability. The good scalability of framework was demonstrated by processing big data efficiently, which makes it competitive for large clinical utilizations. These findings motivate the following directions of future works to further enhance the ANAS-SI framework: Next, applying ANAS-SI on various cancer detection and classification problems like breast cancer, lung cancer, skin cancer etc. will highlight the flexibility and robustness of our algorithm in different medical image analysis tasks. Collaborate with healthcare professionals to facilitate ANAS-SI workflow integration alongside current clinical procedures whilst ensuring that the framework is user-friendly and straightforward in real-world applications. Comparison of ANAS-SI and conventional screening programs by longitudinal studies.
[1] Allogmani, A.S., Mohamed, R.M., Al-Shibly, N.M., Ragab, M. (2024). Enhanced cervical precancerous lesions detection and classification using Archimedes Optimization Algorithm with transfer learning. Scientific Reports, 14(1): 12076. https://doi.org/10.1038/s41598-024-62773-x
[2] Abd-Alhalem, S.M., Marie, H.S., El-Shafai, W., Altameem, T., Rathore, R.S., Hassan, T.M. (2024). Cervical cancer classification based on a bilinear convolutional neural network approach and random projection. Engineering Applications of Artificial Intelligence, 127: 107261. https://doi.org/10.1016/j.engappai.2023.107261
[3] Tan, S.L., Selvachandran, G., Ding, W.P., Paramesran, R., Kotecha, K. (2024). Cervical cancer classification from pap smear images using deep convolutional neural network models. Interdisciplinary Sciences: Computational Life Sciences, 16: 16-38. https://doi.org/10.1007/s12539-023-00589-5
[4] Göker, H. (2024). Detection of cervical cancer from uterine cervix images using transfer learning architectures. Eskişehir Technical University Journal of Science and Technology A - Applied Sciences and Engineering, 25(2): 222-239. https://doi.org/10.18038/estubtda.1384489
[5] Attallah, O. (2023). CerCan·Net: Cervical cancer classification model via multi-layer feature ensembles of lightweight CNNs and transfer learning. Expert Systems with Applications, 229: 120624. https://doi.org/10.1016/j.eswa.2023.120624
[6] Pacal, I., Kılıcarslan, S. (2023). Deep learning-based approaches for robust classification of cervical cancer. Neural Computing and Applications, 35: 18813-18828. https://doi.org/10.1007/s00521-023-08757-w
[7] Mustafa, W.A., Ismail, S., Mokhtar, F.S., Alquran, H., Al-Issa, Y. (2023). Cervical cancer detection techniques: A chronological review. Diagnostics, 13(10): 1763. https://doi.org/10.3390/diagnostics13101763
[8] Youneszade, N., Marjani, M., Pei, C.P. (2023). Deep learning in cervical cancer diagnosis: Architecture, opportunities, and open research challenges. IEEE Access, 11: 6133-6149. http://doi.org/10.1109/ACCESS.2023.3235833
[9] Kumari, C.M., Bhavani, R., Padmashree, S., Priya, R. (2023). Identification and classification of cervical cancer using convolutional neural network based on Fisher score. Journal of Data Acquisition and Processing, 38(2): 2118.
[10] Lee, Y.M., Lee, B., Cho, N.H., Park, J.H. (2023). Beyond the microscope: A technological overture for cervical cancer detection. Diagnostics, 13(19): 3079. https://doi.org/10.3390/diagnostics13193079
[11] Pacal, I. (2024). MaxCerVixT: A novel lightweight vision transformer-based Approach for precise cervical cancer detection. Knowledge-Based Systems, 289: 111482. https://doi.org/10.1016/j.knosys.2024.111482
[12] Cibi, A., Rose, R.J. (2023). Classification of stages in cervical cancer MRI by customized CNN and transfer learning. Cognitive Neurodynamics, 17: 1261-1269. https://doi.org/10.1007/s11571-021-09777-9
[13] Alsubai, S., Alqahtani, A., Sha, M., et al. (2023). Privacy preserved cervical cancer detection using convolutional neural networks applied to pap smear images. Computational and Mathematical Methods in Medicine, 2023(1): 9676206. https://doi.org/10.1155/2023/9676206
[14] Maruyama, S., Sakabe, N., Ito, C., Shimoyama, Y., Sato, S., Ikeda, K. (2023). Effect of specimen processing technique on cell detection and classification by artificial intelligence. American Journal of Clinical Pathology, 159(5): 448-454. https://doi.org/10.1093/ajcp/aqac178
[15] Shanthi, P.B., Hareesha, K.S., Kudva, R. (2022). Automated detection and classification of cervical cancer using pap smear microscopic images: A comprehensive review and future perspectives. Engineered Science, 19: 20-41. http://doi.org/10.30919/es8d633
[16] Ghoneim, A., Muhammad, G., Hossain, M.S. (2020). Cervical cancer classification using convolutional neural networks and extreme learning machines. Future Generation Computer Systems, 102: 643-649. https://doi.org/10.1016/j.future.2019.09.015
[17] Alquran, H., Mustafa, W.A., Qasmieh, I.A., et al. (2022). Cervical cancer classification using combined machine learning and deep learning approach. Computers, Materials & Continua, 72(3): 5117-5134. https://doi.org/10.32604/cmc.2022.025692
[18] Park, Y.R., Kim, Y.J., Ju, W., Nam, K., Kim, S., Kim, K.G. (2021). Comparison of machine and deep learning for the classification of cervical cancer based on cervicography images. Scientific Reports, 11: 16143. https://doi.org/10.1038/s41598-021-95748-3
[19] Alquran, H., Alsalatie, M., Mustafa, W.A., Al Abdi, R., Ismail, A.R. (2022). Cervical net: A novel cervical cancer classification using feature fusion. Bioengineering, 9(10): 578. https://doi.org/10.3390/bioengineering9100578
[20] Alyafeai, Z., Ghouti, L. (2020). A fully-automated deep learning pipeline for cervical cancer classification. Expert Systems with Applications, 141: 112951. https://doi.org/10.1016/j.eswa.2019.112951
[21] Ali, M.M., Ahmed, K., Bui, F.M., et al. (2021). Machine learning-based statistical analysis for early stage detection of cervical cancer. Computers in Biology and Medicine, 139: 104985. https://doi.org/10.1016/j.compbiomed.2021.104985