Ke Wang | Tao Zhang | Yuliang Zeng | Jiancun Zhou | Yuehong Long | Xingqi Liu | Qian He | Jianxin He*
© 2026 The authors. This article is published by IIETA and is licensed under the CC BY 4.0 license (http://creativecommons.org/licenses/by/4.0/).
OPEN ACCESS
Chemotherapy demonstrates efficacy in improving quality of life for patients with advanced non-small cell lung cancer (NSCLC). However, clinical observations indicate heterogeneous therapeutic responses among patients. To develop a pretreatment predictive model for chemotherapy response, we conducted a retrospective study of 177 NSCLC patients undergoing chemotherapy. From baseline Computed Tomography (CT) imaging, 875 radiomic features were extracted through standardized preprocessing protocols. Following rigorous feature selection, three machine learning algorithms were implemented: logistic regression (LR), support vector machine (SVM), and random forest (RF) classifiers. Comparative analysis revealed superior predictive performance in the random forest model (Area Under Curve (AUC) = 0.86). SHapley Additive exPlanations (SHAP) analysis provided dual-level interpretation, elucidating both population-level feature contributions and individualized prediction rationales. This interpretable radiomics framework enables reliable pretreatment efficacy assessment while enhancing clinical trust through model transparency, potentially informing personalized therapeutic strategies for NSCLC management.
non-small cell lung cancer, interpretability, radiomics, efficacy evaluation
Lung cancer is one of the most common malignant tumors, whose morbidity and mortality rates rank the top among all cancer types globally; typically, over 85% of lung cancer cases have non-small cell lung cancer (NSCLC) [1, 2]. Chemotherapy can effectively improve the quality of life of advanced NSCLC patients [3]. Clinical observations reveal that chemoresistance in certain patients leads to delayed therapeutic interventions and unnecessary exposure to drug toxicity, significantly compromising survival outcomes. Consequently, it is of crucial importance to evaluate the efficacy of chemotherapy. At present, the evaluation of NSCLC efficacy is mainly based on the Response Evaluation Criteria in Solid Tumors (RECIST1.1) [4], which generally relies on the change in tumor size in imaging and can be used to determine the efficacy of chemotherapy in solid tumors. In the course of chemotherapy for NSCLC, delayed response or the pseudo progression phenomenon may occur on the imaging examination; for instance, the tumor area exhibits a decreased density or cavity formed after the absorption of necrotic tissue, while the tumor size is not changed on imaging examination; and some peri-tumor areas may show enlarged lesion volume due to inflammatory exudation or intra-tumoral hemorrhage [5]. Accurately quantifying chemotherapeutic response in NSCLC remains challenging, potentially predisposing patients to overtreatment or undertreatment due to heterogeneous tumor resistance mechanisms [6]. There exists a critical need to develop dynamic assessment frameworks incorporating real-time quantitative biomarkers for precise monitoring of NSCLC chemotherapeutic response, enabling precision-guided therapeutic optimization through longitudinal molecular profiling.
Radiomics is an emerging quantitative analysis method, which allows for automatic, efficient, and repeated high-throughput extraction of massive and objective tumor features unrecognizable to the naked eyes from medical images like Computed Tomography (CT), Magnetic Resonance Imaging (MRI) and Positron Emission Tomography (PET). These imaging biomarkers can reveal alterations in gene expression and protein patterns at the tumor microenvironment level, providing comprehensive characterization of spatiotemporal tumor heterogeneity [7-10], and interpret the relationships of radiomics features with diagnosis, stage, pathological type, differentiation degree, efficacy evaluation, and clinical outcomes, and to establish a clinical prediction model, which can accurately diagnose, accurately predict tumor staging, and accurately evaluate tumor response to treatment. Our research group has applied radiomics in predicting the efficacy of chemotherapy for NSCLC, but the "black box" of machine learning makes it difficult to explain why predictions are made for patients. In essence, machine learning is a multi-faceted concept, for instance, what is interpreted? Who needs the interpretability? To better explain the medical artificial intelligence models, it is necessary to interpret how the internal features affect the results, so that the physicians understand the whole decision-making process and can make a decision based on the model reliably. However, medical data used for modeling are usually complicated, fuzzy and heterogenous, making it challenging for interpretability. To overcome the black box problem, Lundberg and Lee [11] proposed the SHapley Additive exPlanations (SHAPs) method to improve the model interpretability, with positive value or negative value indicating the direction of effect, and the values describing the weight or importance of the features. It can help us understand the role of each feature in the whole samples or one individual sample. SHAP enhances radiomics model interpretability by quantifying feature contributions and decision pathways, thereby optimizing clinical trust in predictive outcomes for both clinicians and patients.
This study developed a CT-based radiomics model integrating SHAP framework to predict chemotherapy response in NSCLC, with dual objectives of prognostic accuracy enhancement and model interpretability optimization. At the same time, the SHAP technology was used in combination to intuitively interpret the model decision-making process, and understand the relationship between radiomics features and efficacy of chemotherapy to improve the reliability of the model to physicians and patients.
2.1 Study population
This was a single-center retrospective trial, in which 271 NSCLC patients receiving chemotherapy during 2015–2021 were collected.
Inclusion criteria:
a) Aged 18–75 years;
b) NSCLC was confirmed through histopathological puncture biopsy or multi-disciplinary consultation;
c) Patients with a measurable lesion;
d) Patients with available pre-treatment CT images, with the scan slice thickness of 5 mm;
e) Other population information like sex and smoking;
f) Patients with no history of surgical resection of tumor;
g) Patients receiving chemotherapy.
Exclusion criteria:
h) Patients who did not receive any antitumor treatment before admission;
i) Patients with other accompanying primary tumors;
j) Patients who did not complete the treatment plan due to voluntary withdrawal;
k) Patients without efficacy evaluation information after treatment.
The efficacy results of chemotherapy were classified as 4 levels, as shown in Table 1.
Table 1. Response evaluation criteria in solid tumors (RECIST 1.1)
|
Level |
Evaluation Criteria |
|
Complete response (CR) |
The lesion disappears, with no emergence of a new lesion |
|
Partial response (PR) |
The sum of maximum tumor diameter reduces by ≥30% |
|
Progressive disease (PD) |
The sum of maximum tumor diameter increases by at least ≥20% or new lesion occurs. |
|
Stable disease (SD) |
The reduction of the sum of maximum tumor diameter does not reach PR level or the increase does not reach PD level |
2.2 Tumor segmentation and feature extraction
By using the 3D-Slicer semi-automatic segmentation tool, the NSCLC tumor was segmented and the regions of interest (ROIs) were labeled [12]. First of all, the prepared CT images of DICOM format were imported into the 3D-Slicer software, and one radiologist with 1–3 years of experience delineated the tumor area layer-by-layer using the 3D-Slicer tool; additionally, another radiologist with over 5 years of experience was in charge of verification and guidance, and any disagreement in tumor area was settled through discussion. After delineating the tumor region, we utilized the Python open-source toolkit pyradiomics to extract radiomic features. The extracted features specifically include: First-order features, Gray Level Co-occurrence Matrix (GLCM), Gray Level Dependence Matrix (GLDM), Gray Level Run Length Matrix (GLRLM), Gray Level Size Zone Matrix (GLSZM), Neighboring Gray Tone Difference Matrix (NGTDM), and Shape features.
2.3 Radiomics feature selection
The intra-class correlation coefficient (ICC) serves as a quantitative reliability metric to assess inter-observer consistency and measurement robustness of radiomic features extracted from distinct regions of interest (ROIs) across two independent observers. Features demonstrating ICC values exceeding 0.75 indicate excellent inter-rater reliability, whereas those below this threshold are systematically discarded to mitigate observer-dependent variability [13, 14]. Prior to feature selection, radiomic features underwent standardization using z-score normalization to ensure comparability across heterogeneous scales. An independent two-sample t-test (α = 0.05) first eliminated features demonstrating both inadequate discriminative power (α > 0.05) and insufficient test-retest reliability (intraclass correlation coefficient < 0.75). Subsequently, features exhibiting minimal biological relevance (variance < 0.01 across subjects) were excluded through one-way ANOVA, retaining only those with sufficient inter-subject variability. A final dimensionality reduction phase employed least absolute shrinkage and selection operator (LASSO) regression with 5-fold cross-validation, optimizing feature subset sparsity while preserving predictive performance through L1 regularization [15-17]. The selected features underwent min-max normalization (rescaled to [0,1] range) to eliminate scale variance between predictors and enhance convergence efficiency during model optimization.
2.4 Radiomics model construction
The radiomics model was constructed using the logistic regression (LR) [18, 19], support vector machine (SVM) [16] and random forest (RF) [20] models, and hyper-parameters were adjusted by grid search to obtain better model performance. The model was trained in the training set, and the classification performance was tested in the test set. By calculating the Area Under Curve (AUC), accuracy, precision and F1 value, the prediction performance was quantified. We compared the performances of three models to select the one with optimal selection performance for interpretability research.
2.5 SHapley Additive exPlanations-based interpretability model
The calculation of SHAP values is based on the Shapley value principle from cooperative game theory, which evaluates a feature's impact on model predictions by quantifying its marginal contributions across different feature combinations. The calculation process was shown below:
Step 1: Feature subset traversal
Definition (alliance): Assume the status space was n-dimensional and was labeled as $A=\left\{x_1, x_2, \ldots \ldots x_n\right\}$, at this time, we needed to estimate the contribution of the $\mathrm{i}^{\text {th}}$ feature to prediction output. If one set S satisfied $S \subset A$ and $x_i \not \subset S$, and assume that there was a sample $x_k=\left[x_1=a_1, x_2=a_2, \ldots \ldots, x_n=a_n\right]$, then $S_a=\left\{x_j=a_j, \forall j \in S\right\}$ was an alliance of feature $x_i=a_i$. For instance, assume a sample $x_k=\left[x_1=a_1, x_2=a_2, x_3=a_3\right]$, then the SHAP value of $x_2$ should be calculated, and there was an alliance $S_a=\left\{x_1=a_1, x_3=a_3\right\}$ if $S=\left\{x_1, x_3\right\}$.
Step 2: Calculating marginal contributions
Definition (contribution of $x_i=a$ under the alliance $S_a$): Assume that $S_a$ was an alliance of $x_i$, then under the alliance, the contribution of $x_i=a_i$ was defined as follows:
$\begin{aligned} & E_{x_j \sim X_j, \forall j \neq i \text { and } x_j \notin S}\left(\hat{f}\left(S_a \cup\left\{x_i=a_i\right\} \cup\left\{x_j\right\}\right)\right)-E_{x_j \sim X_j, \forall x_j \notin S}\left(\hat{f}\left(S_a \cup\left\{x_j\right\}\right)\right)\end{aligned}$ (1)
where, $X_j$ is the distribution function of $x_j$.
Formula (1) can be simplified as ${val}\left(S_a \cup\left\{x_i\right\}\right)-{val}\left(S_a\right)$, where ${val}_x\left(S_b\right)$ is the feature expectation of predicted value of subset $S_b$ excluding $S_b$.
Step 3: Weighted average contribution value
Definition (SHAP value): SHAP value was the weighted sum of the contribution of feature $x_i$ under all the possible alliances.
$\begin{aligned} & \phi_i({val})=\sum_{\text {SUA and } x_i \notin S} \frac{|S|!(n-|S|-1)!}{n!} \left({val}\left(S_a \cup\left\{x_i\right\}-{val}\left(S_a\right)\right)\right.\end{aligned}$ (2)
where, $\phi_i({val})$ represents the SHAP value of feature $x_i$.
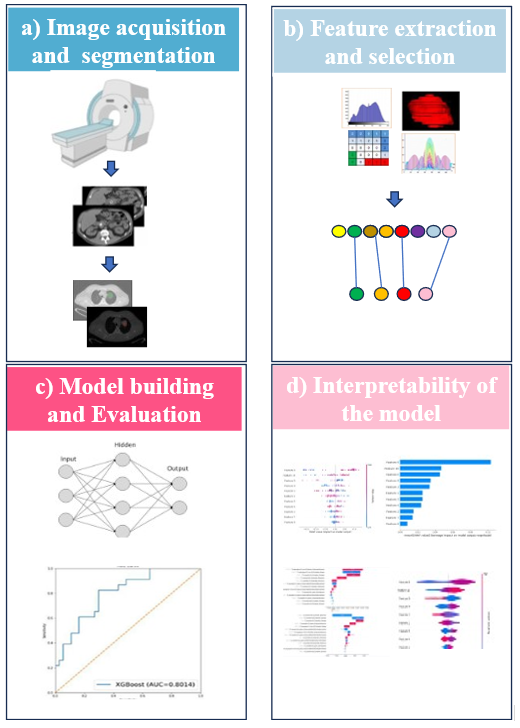
SHAP is an important model-independent approach. Rooted in coalitional game theory, it computes features' marginal contributions to predictive outcomes through Shapley value analysis, enabling dual-level interpretation of black-box models. The workflow is shown in Figure 1.
Figure 1. Workflow of the radiomics analysis in this study
3.1 Study data
A total of 271 eligible patients were screened based on predefined inclusion/exclusion criteria, including 94 cases excluded for incomplete imaging or artifacts. After rigorous screening, 177 patients were enrolled in the study cohort, with chemotherapy response stratification revealing 131 responders (74.0%) and 46 non-responders (26.0%). The cohort was randomly allocated into a training set (n = 142) for model development and a test set (n = 35) for validation purposes. The information of NSCLC patients receiving chemotherapy is shown in Table 2.
Table 2. Information of non-small cell lung cancer (NSCLC) patients receiving chemotherapy
|
|
Training Set |
Test Set |
|||||
|
CR+PR (n = 104) |
NC+PD (n = 38) |
p-Value |
CR+PR (n = 27) |
NC+PD (n = 8) |
p-Value |
||
|
Age |
|
|
|
|
|
|
|
|
Range |
36–74 |
35–68 |
>0.05 |
38–72 |
40–68 |
>0.05 |
|
|
Mean±Std |
64.1 ± 9.2 |
60.3 ± 8.5 |
|
61.5 ± 7.8 |
60.1 ± 6.5 |
|
|
|
Sex |
|
|
|
|
|
|
|
|
male |
68 |
23 |
< 0.05 |
22 |
6 |
<0.05 |
|
|
female |
36 |
15 |
< 0.05 |
5 |
2 |
<0.05 |
|
|
Smoking |
|
|
|
|
|
|
|
|
Yes |
57 |
22 |
< 0.05 |
16 |
5 |
<0.05 |
|
|
No |
47 |
16 |
< 0.05 |
11 |
3 |
<0.05 |
|
3.2 Data preparation before modeling
The PyRadiomics platform extracted 875 radiomic features from regions of interest (ROIs) in non-small cell lung cancer (NSCLC) cases. To align with quantitative analysis requirements, 19 discrete/non-quantifiable features (e.g., texture maps and shape descriptors) were subsequently excluded, yielding 856 numerically analyzable features for downstream modeling. In addition, radiomics features including diagnostics_Image-originalMean, diagnostics_Image-originalMinimum, diagnostics_Image-originalMaximum, diagnostics_Mask-originalVoxelNum, and diagnostics_Mask-originalVolumeNum, which are related to information such as image version and size, were further excluded. After preliminary processing, 851 quantitative features were retained, including 18 first-order statistical features, 14 shape features, 75 texture features, and 744 wavelet transform features. After ICC consistency analysis, radiomics features with ICC value < 0.75 were eliminated, and finally 718 radiomics features were retained. Following analysis of variance and t-test, 287 radiomics features were kept. Later, LASSO analysis was conducted to eliminate features with low influence on the classification task. Eventually, 10 features were retained.
3.3 Radiomics model performance
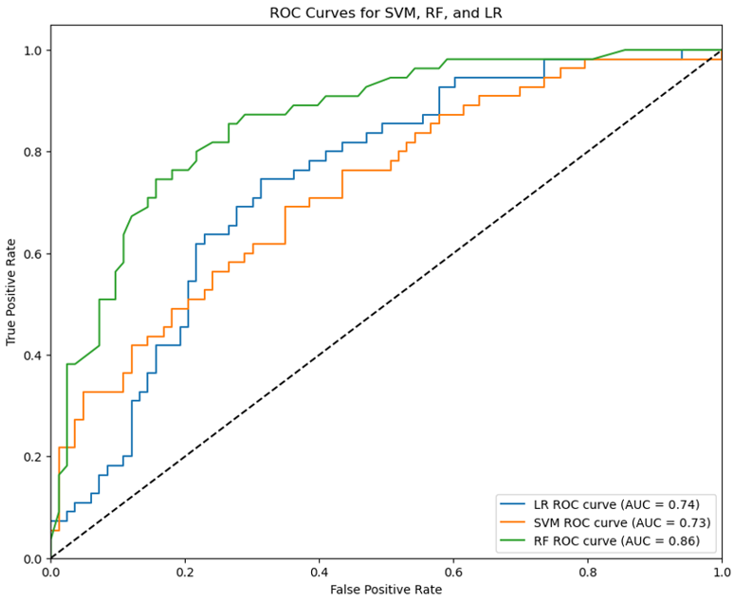
In this paper, three machine learning methods, including LR, SVM and RF, were utilized for model construction. Among them, the RF algorithm achieved the optimal performance (AUC: 0.86), while the AUC values of SVM and LR algorithms were 0.73 and 0.74, respectively (Figure 2).
Figure 2. Area Under Curve (AUC) of different models, Model1, Model2 and Model3 are logistic regression (LR), support vector machine (SVM) and random forest (RF), respectively
Table 3 shows the performance of each prediction model in detail.
Table 3. Performance of three machine learning models
|
|
Logistic Regression (LR) |
Support Vector Machine (SVM) |
Random Forest (RF) |
|
Area Under Curve (AUC) |
0.74 ± 0.18 |
0.73 ± 0.16 |
0.86 ± 0.07 |
|
Accuracy (ACC) |
0.68 ± 0.14 |
0.66 ± 0.15 |
0.82 ± 0.1 |
|
Recall |
0.71 ± 0.09 |
0.69 ± 0.20 |
0.80 ± 0.09 |
|
precision |
0.72 ± 0.13 |
0.66 ± 0.13 |
0.79 ± 0.09 |
|
F1-score |
0.71 ± 0.12 |
0.67 ± 0.11 |
0.79 ± 0.11 |
Table 3 summarizes the performance metrics (mean ± standard deviation) across 50 randomized iterations. The random forest (RF)-based radiomics model demonstrated superior predictive capability with an AUC of 0.86 ± 0.07 and Accuracy (ACC) of 0.82 ± 0.1 accompanied by Recall (0.80 ± 0.09), precision (0.79 ± 0.09), and F1-score (0.79 ± 0.11). Notably, RF exhibited the lowest variability across all metrics, confirming its statistical robustness in clinical outcome prediction.
3.4 Interpretability of the SHapley Additive exPlanations model
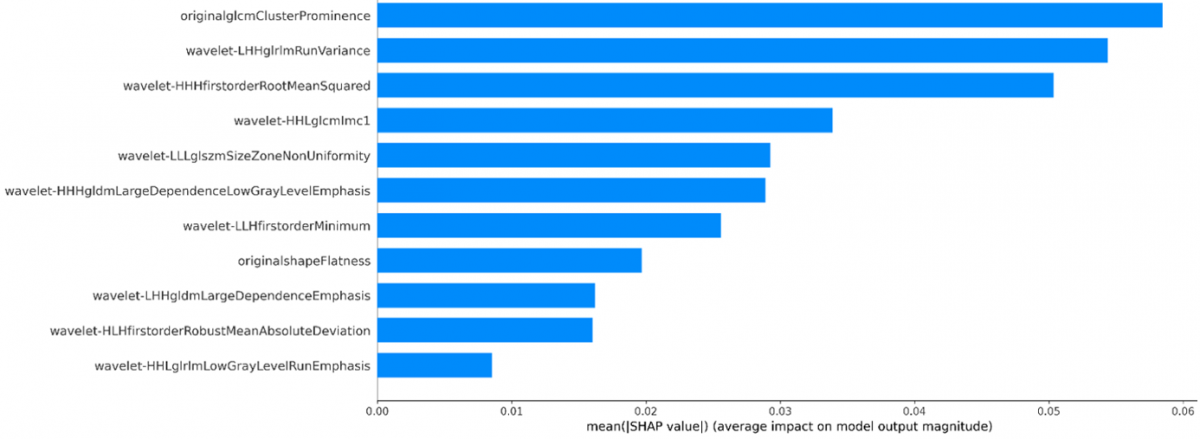
The SHAP values of radiomics features selected by the optimal performance model (RF) were calculated, with greater SHAP values indicating the more important features. Figure 3 displays the retained radiomics features in a descending order. Features with greater SHAP values had greater contributions to the model, and higher predictability than features with lower SHAP values. wavelet-LLHfirstorderMinimum was the most important feature in the RF model, which had the greatest influence on the prediction results.
Figure 3. SHapley Additive exPlanations (SHAPs) feature importance of the model. The figure illustrates the importance of each feature to the global prediction result in descending order
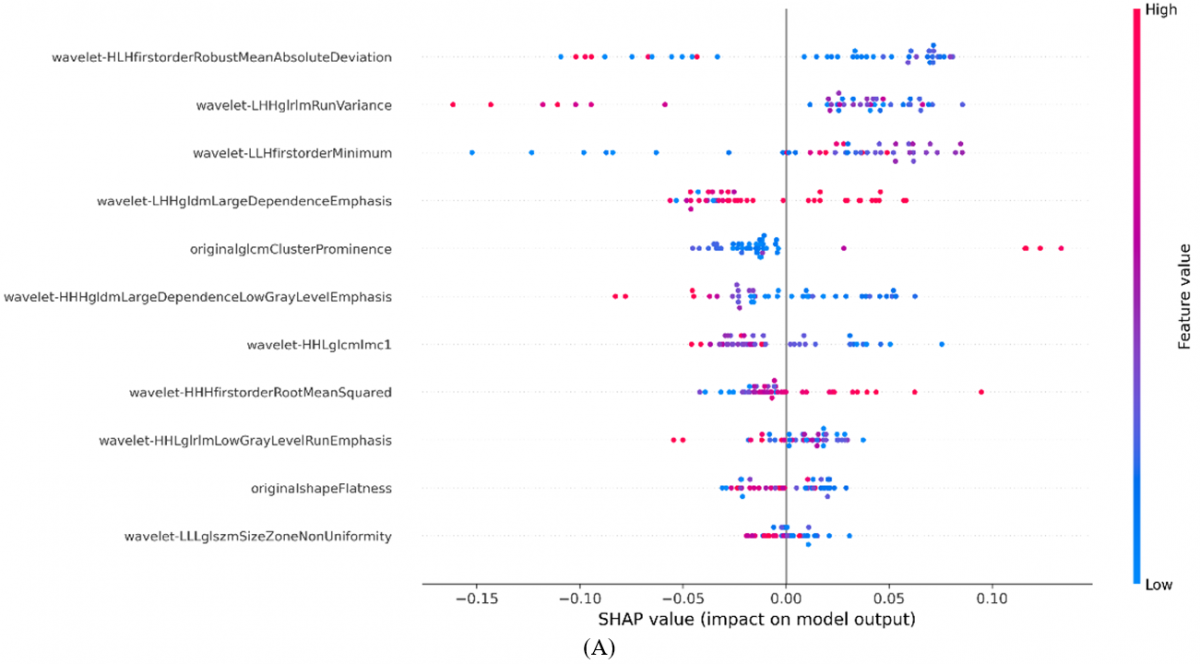
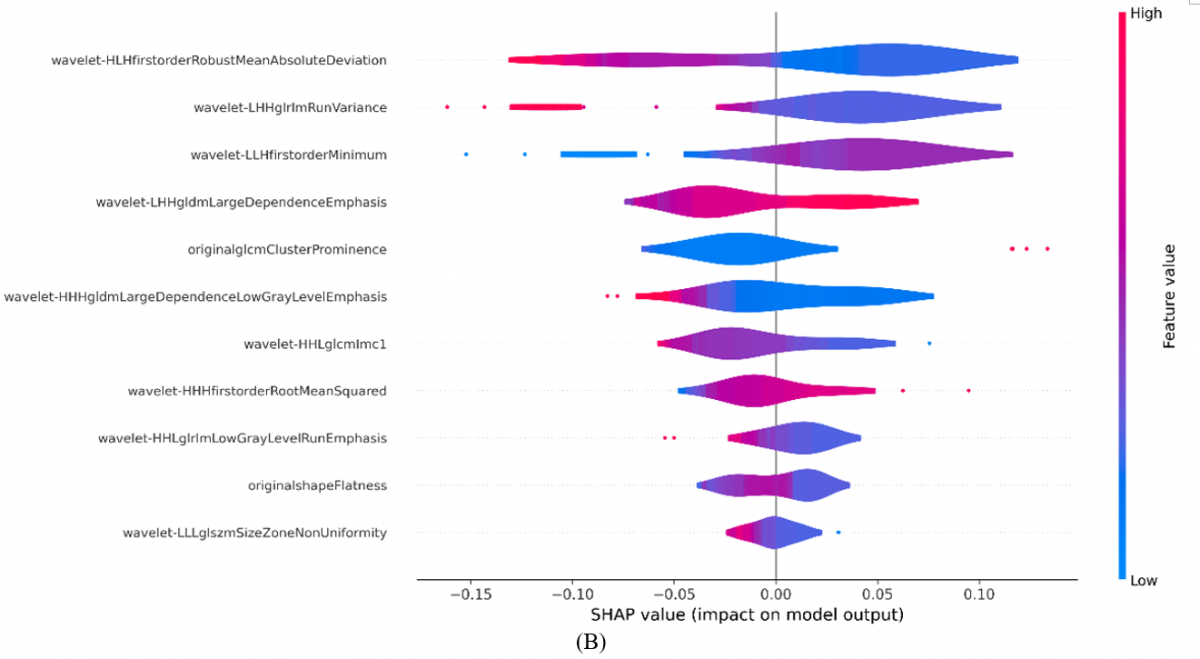
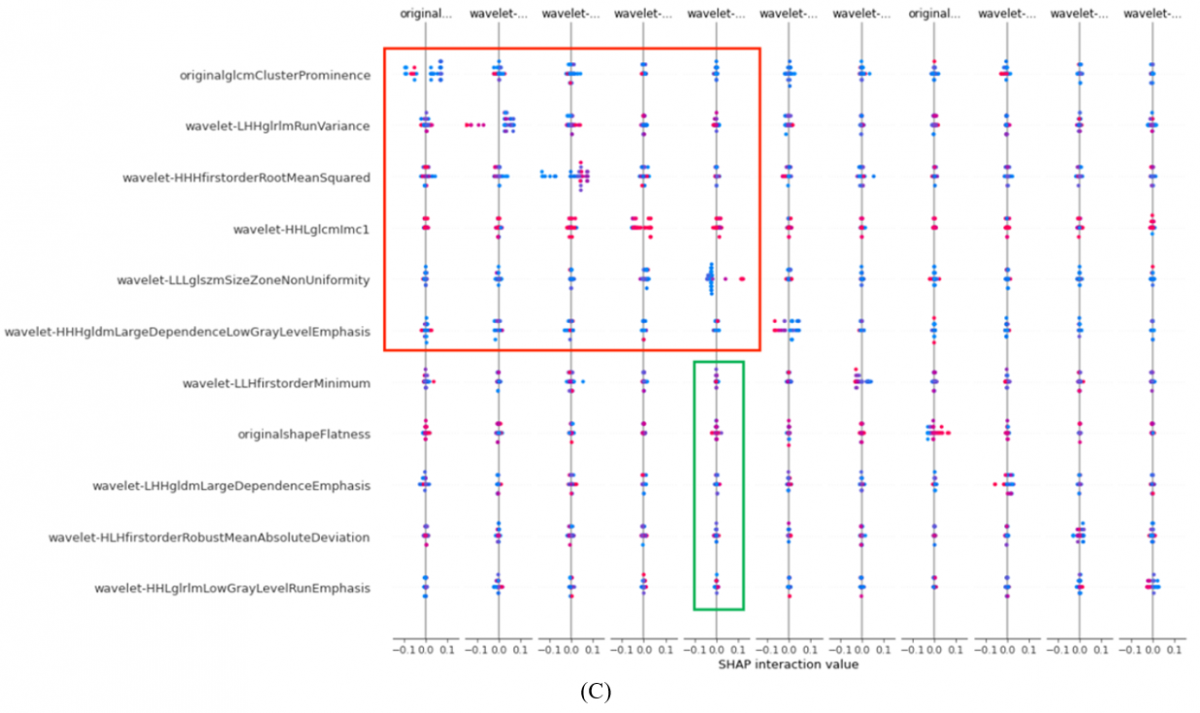
The SHAP summary graph exhibits the relationships between radiomics features and SHAP values. In Figure 4(A), each point represents one radiomics feature value of one case (patient) and the corresponding SHAP value. The position on the x-axis was determined by SHAP value, and that on the y-axis was determined by the radiomics feature. Red color suggests the greater radiomics feature value, blue color indicates the smaller feature value, and purple is indicative of close to the mean. The negative SHAP value suggests the increased risk of good prognosis (effective chemotherapy), and vice versa. Figure 4(B) describes Figure 4(A) in a form of violin plot, which intuitively describes the distributions of radiomics features and SHAP and the probability density. The wider portion on y-axis suggests the denser data distribution, while the narrower portion indicates the sparse data distribution. Figure 4(C) displays the impact of some feature interactions in the model on the model, where red points indicate two features with greater values, blue points stand for two features with smaller values, the points on the right of y-axis represent the greater SHAP value under the joint action of two features, and vice versa. Figure 4(C) displays the feature interaction analysis, the SHAP value not only reflects the influence of one feature, but also reveals the effect of different feature interactions on the prediction results. This is helpful for understanding the complicated relationships between features. In the feature interaction analysis graph, the SHAP values with main effects appear on the diagonal, while interaction effects do not appear on the diagonal. Such visual diagrams can provide additional insights. For instance, we observed that the major effects of feature8, feature10 and feature0 were positive. Additionally, the feature interaction graph can also help to select features as feature combination. In Figure 4(C), the portion denoted with the red frame was suitable as feature combination, which contributed to improving the model performance, whereas the green frame combination did not significantly improve the model performance.
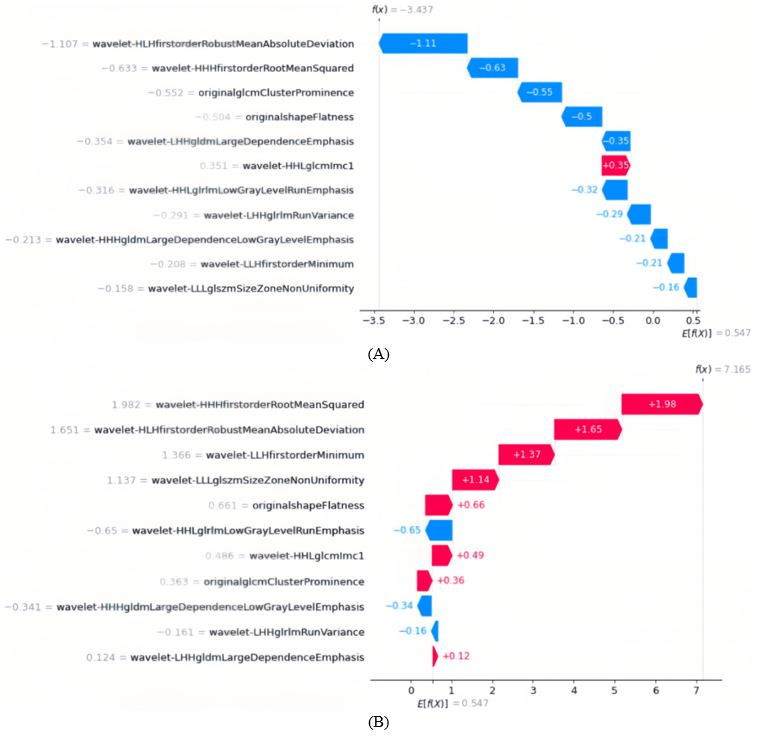
In single sample prediction, we randomly selected two patients from the model to draw the SHAP waterfall plot (Figure 5), in which the SHAP value of each feature is described as the positive or negative contribution to the results, and then the final prediction results are obtained. Patients (A) and (B) with good and poor prognoses were selected from the model.
Figure 5. SHapley Additive exPlanations (SHAPs) waterfall plot displays the individual interpretability of the model. The red bar indicates the increase in predicted value, and blue bar stands for the decrease in predicted value. Under the influence of all features, the final predicted value was obtained, if the value was greater than baseline value, the good prognosis was predicted
This study developed a novel predictive tool by integrating SHAP interpretability analysis with a CT radiomics-driven machine learning model to assess chemotherapy response in patients with NSCLC. The model achieved high predictive accuracy while enabling visual interpretation of decision-making processes, providing clinicians with a decision-support tool that combines scientific rigor and clinical utility. The model was constructed by extracting high-throughput quantitative features from CT radiomics, followed by rigorous selection of key imaging biomarkers (e.g., texture features and morphological parameters) using ICC analysis, analysis of variance, T-test, and LASSO regression. This approach enabled the development of a robust chemotherapy response prediction model. LR, SVM and RF machine learning methods were used to construct the radiomics models to predict the efficacy of chemotherapy for NSCLC. Of them, the RF-based radiomics model exhibited the optimal performance (AUC = 0.86), achieving similar results as other studies [7, 21, 22]. To address the inherent opacity of machine learning models in clinical decision-making, we integrated SHAP framework into our radiomics-based chemotherapy efficacy prediction system [23-25]. This implementation enables systematic deconstruction of model reasoning through quantitative feature contribution analysis.
We quantified the contribution of radiomic features to chemotherapy efficacy predictions through SHAP analysis. Wavelet-decomposed radiomic features demonstrated the highest predictive importance in distinguishing treatment responses in NSCLC, as visualized in Figure 3. These findings align with established evidence highlighting the biological relevance of frequency-domain texture features, the results are consistent with those of other literature [26-28]. Traditional feature importance metrics quantify which variables influence predictions but fail to delineate how these features modulate clinical outcomes. In contrast, SHAP values provide dual analytical insights.
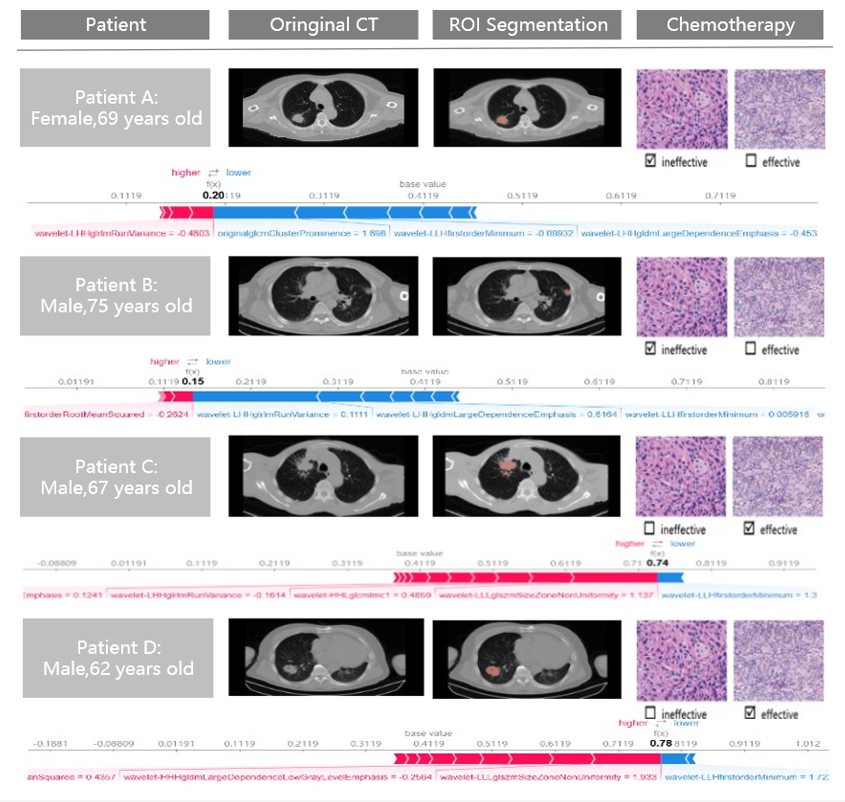
The waterfall plot serves as a powerful graphical tool for visualizing SHAP values in individual predictions. Each prediction generated by the model possesses a dedicated waterfall plot that precisely delineates the directional contribution of every feature toward the final prediction outcome [29]. As clearly demonstrated in Figure 3, the same feature exhibits differential importance between the two patient subgroups. For different patients, features with higher importance might have less influence on the prediction results under some circumstances. Therefore, in individual prediction, SHAP also exhibits good specificity. Additionally, in terms of local interpretability, we visualized four typical cases in which positive and negative responses were correctly predicted in Figure 6.
Figure 6. Four representative cases correctly predicted as ineffective (patients A and B) and effective (patients C and D) were individually visualized by SHapley Additive exPlanations (SHAP) method
Certain limitations should be noted in this study. Firstly, the reliance on retrospective data from a single institution introduces potential selection bias and limits generalizability. Multicenter validation with prospective cohorts is essential to confirm model robustness across diverse clinical settings. Secondly, SHAP values demonstrate heightened susceptibility to noise and outliers, particularly in datasets with imbalanced class distributions or imperfect feature engineering. Finally, as a relative contribution metric, SHAP values quantify feature importance rankings rather than establishing absolute causal relationships, necessitating complementary mechanistic investigations.
We developed a radiomics-based interpretable model to assess chemotherapy response in NSCLC, offering a novel framework for reliable treatment efficacy stratification. The integration of SHAP into the predictive architecture enhances clinical utility by transparently delineating feature contributions to model decisions.
This work is supported by the National Science Foundation of Hunan Province (Grants No.: 2023JJ50354, 2024JJ7078), Scientific research project of Hunan Education Department (Grant No.: 24A0575), Postgraduate Research Innovation Project of Hunan Province (Grant No.: CX20251750).
[1] Cannone, G., Comacchio, G.M., Pasello, G., et al. (2023). Precision surgery in NSCLC. Cancers, 15(5): 1571. https://doi.org/10.3390/cancers15051571
[2] Wang, K., An, Y., Li, N., Zhou, J., Chen, X. (2022). Robust identification of subtypes in non-small cell lung cancer using radiomics. Trait Signal, 39(4): 1399-1406. https://doi.org/10.18280/ts.390434
[3] Yin, C., Hu, B., Yang, X., et al. (2023). Neoadjuvant sintilimab combined with chemotherapy in resectable locally advanced non-small cell lung cancer: Case series and literature review. World Journal of Surgical Oncology, 21(1): 304. https://doi.org/10.1186/s12957-023-03194-4
[4] Challapalli, A., Aboagye, E.O. (2016). Positron emission tomography imaging of tumor cell metabolism and application to therapy response monitoring. Frontiers in Oncology, 6: 44-54. https://doi.org/10.3389/fonc.2016.00044
[5] Nishino, M., Jagannathan, J.P., Krajewski, K.M., et al. (2012). Personalized tumor response assessment in the era of molecular medicine: Cancer-specific and therapy-specific response criteria to complement pitfalls of RECIST. American Journal of Roentgenology, 198(4): 737-745. https://doi.org/10.2214/AJR.11.7483
[6] Stinchcombe, T.E., Choi, J., Schell, M.J., et al. (2006). Carboplatin-based chemotherapy in patients with advanced non-small cell lung cancer and a poor performance status. Lung Cancer, 51(2): 237-243. https://doi.org/10.1016/j.lungcan.2005.10.018
[7] Dercle, L., Fronheiser, M., Lu, L., et al. (2020). Identification of non-small cell lung cancer sensitive to systemic cancer therapies using radiomics. Clinical Cancer Research, 26(9): 2151-2162. https://doi.org/10.1158/1078-0432.CCR-19-2942
[8] Cai, J., Zheng, J., Shen, J., et al. (2020). A radiomics model for predicting the response to bevacizumab in brain necrosis after radiotherapy. Clinical Cancer Research, 26(20): 5438-5447. https://doi.org/10.1158/1078-0432.CCR-20-1264
[9] Aharonu, M., Kumar, R.L. (2024). Classification of lung adenocarcinoma using convolutional neural networks: A bioinformatics approach. Trait Signal, 41(2): 1027-1034. https://doi.org/10.18280/ts.410243
[10] Granata, V., Fusco, R., Setola, S.V., et al. (2022). CT-based radiomics analysis to predict histopathological outcomes following liver resection in colorectal liver metastases. Cancers, 14(7): 1648-1664. https://doi.org/10.3390/cancers14071648
[11] Lundberg, S.M., Lee, S.I. (2017). A unified approach to interpreting model predictions. In 31st International Conference on Neural Information Processing Systems (NIPS), Long Beach, CA.
[12] Brown, K.H., Illyuk, J., Ghita, M., Walls, G.M., McGarry, C.K., Butterworth, K.T. (2023). Assessment of variabilities in lung-contouring methods on CBCT preclinical radiomics outputs. Cancers, 15(10): 2677. https://doi.org/10.3390/cancers15102677
[13] Abolhasani, M., Karbalaee Nouri, A., Bakhshi, E., Kheirkhah, M. (2021). Assessing the validity and reliability of the Persian version of the interpersonal problem-solving skills assessment tool in schizophrenia. Archives of Rehabilitation, 22(1): 118-131.
[14] Li, C., He, Z., Lv, F., et al. (2023). An interpretable MRI-based radiomics model predicting the prognosis of high-intensity focused ultrasound ablation of uterine fibroids. Insights into Imaging, 14(1): 129. https://doi.org/10.1186/s13244-023-01445-2
[15] Wang, K., An, Y., Zhou, J., Long, Y., Chen, X. (2023). A novel multi-level feature selection method for radiomics. Alexandria Engineering Journal, 66: 993-999. https://doi.org/10.1016/j.aej.2022.10.069
[16] Kang, C., Huo, Y., Xin, L., Tian, B., Yu, B. (2019). Feature selection and tumor classification for microarray data using relaxed Lasso and generalized multi-class support vector machine. Journal of Theoretical Biology, 463: 77-91. https://doi.org/10.1016/j.jtbi.2018.12.010
[17] Ma, C., Huang, J. (2016). Asymptotic properties of lasso in high-dimensional partially linear models. Science China Mathematics, 59: 769-788. https://doi.org/10.1007/s11425-015-5093-2
[18] Zhang, X., Ruan, S., Xiao, W., et al. (2020). Contrast-enhanced CT radiomics for preoperative evaluation of microvascular invasion in hepatocellular carcinoma: A two-center study. Clinical and Translational Medicine, 10(2): e111. https://doi.org/10.1002/ctm2.111
[19] Fuladi, S., Chaturvedi, H., Nallakaruppan, M.K., Grover, V., Alshahrani, H., Baza, M. (2024). Efficient approach for kidney stone treatment using convolutional neural network. Trait Signal, 41(2): 929-937. https://doi.org/10.18280/ts.410233
[20] Sarica, A., Cerasa, A., Quattrone, A. (2017). Random forest algorithm for the classification of neuroimaging data in Alzheimer's disease: A systematic review. Frontiers in Aging Neuroscience, 9: 329-341. https://doi.org/10.3389/fnagi.2017.00329
[21] Chang, R., Qi, S., Yue, Y., Zhang, X., Song, J., Qian, W. (2021). Predictive radiomic models for the chemotherapy response in non-small-cell lung cancer based on computerized-tomography images. Frontiers in Oncology, 11: 646190. https://doi.org/10.3389/fonc.2021.646190
[22] Zhou, Z., Guo, W., Liu, D., Micha, J.R.N., Song, Y., Han, S. (2023). Multiparameter prediction model of immune checkpoint inhibitors combined with chemotherapy for non-small cell lung cancer based on support vector machine learning. Scientific Reports, 13(1): 4469. https://doi.org/10.1038/s41598-023-31189-4
[23] Yasin, P., Mardan, M., Abliz, D., et al. (2023). The potential of a CT-based machine learning radiomics analysis to differentiate brucella and pyogenic spondylitis. Journal of Inflammation Research, 16: 5585-5600. https://doi.org/10.2147/JIR.S429593
[24] Ladbury, C., Zarinshenas, R., Semwal, H., et al. (2022). Utilization of model-agnostic explainable artificial intelligence frameworks in oncology: A narrative review. Translational Cancer Research, 11(10): 3853. https://doi.org/10.21037/tcr-22-1626
[25] Cheng, X., Zhang, Y., Zhu, M., Sun, R., Liu, L., Li, X. (2023). Predicting response to CCRT for esophageal squamous carcinoma by a radiomics-clinical SHAP model. BMC Medical Imaging, 23(1): 145. https://doi.org/10.1186/s12880-023-01089-0
[26] Qiu, Q., Duan, J., Deng, H., et al. (2020). Development and validation of a radiomics nomogram model for predicting postoperative recurrence in patients with esophageal squamous cell cancer who achieved pCR after neoadjuvant chemoradiotherapy followed by surgery. Frontiers in Oncology, 10: 1398. https://doi.org/10.3389/fonc.2020.01398
[27] Xu, X., Chen, J., Huang, L., et al. (2019). Application of radiomics signature captured from CT to predicting brain metastases in stage Ⅲ/Ⅳ anaplastic lymphoma kinase-positive non-small cell lung cancer patients. China Oncology, 29(10): 815-823. https://doi.org/10.19401/j.cnki.1007-3639.2019.10.009
[28] Yang, F., Zhang, J., Zhou, L., et al. (2022). CT-based radiomics signatures can predict the tumor response of non-small cell lung cancer patients treated with first-line chemotherapy and targeted therapy. European Radiology, 32: 1-10. https://doi.org/10.1007/s00330-021-08277-y
[29] Iasonos, A., Schrag, D., Raj, G.V., Panageas, K.S. (2008). How to build and interpret a nomogram for cancer prognosis. Journal of Clinical Oncology, 26(8): 1364-1370. https://doi.org/10.1200/JCO.2007.12.9791