Zhuo Yang![]()
© 2025 The authors. This article is published by IIETA and is licensed under the CC BY 4.0 license (http://creativecommons.org/licenses/by/4.0/).
OPEN ACCESS
In the context of global supply chains facing multiple risk shocks such as natural disasters and geopolitical instability, traditional risk assessment methods reliant on manual analysis and static data face challenges such as information latency and insufficient visualization capabilities. These issues hinder their ability to address the uncertainty and transmission of risks. Existing research in supply chain risk assessment has significant limitations: U-Net-based segmentation algorithms lack adaptive mechanisms for scale adjustment, resulting in insufficient accuracy in extracting multi-scale features from complex supply chain risk visualization images; attention-based methods like CLIP cannot achieve deep semantic associations between images and language; and risk matrix methods fail to dynamically adapt to changes in supply chain network topology. To address these challenges, this paper focuses on an AI-driven intelligent evaluation system for supply chain risk visualization, proposing a three-layer technical architecture: "feature extraction—fusion reasoning—evaluation output." At the bottom layer, an improved central difference convolution (CDC) operator is proposed to extract multi-scale features from images; the middle layer constructs a bi-directional image-language mapping network based on graph neural networks (GNNs) for cross-modal fusion; the top layer generates three-dimensional risk assessment outputs by integrating image segmentation results. The innovations of this study are: 1) the proposed improvement mechanism enhances the completeness and accuracy of complex image feature extraction; 2) the establishment of a deep image-language fusion model driven by GNNs addresses the issue of insufficient semantic association; and 3) the creation of dynamic and intuitive risk assessment outputs. This research provides a new technological path for supply chain risk visualization and assessment, improving both the accuracy and response efficiency of risk evaluations, while enriching the theoretical applications of cross-modal learning in industrial scenarios.
supply chain risk visualization, image segmentation, GNN, multi-scale feature extraction, cross-modal fusion, intelligent scene evaluation
In the context of deepening globalization and industrial collaboration, supply chains have become the core link that sustains the operation of the economy [1-4]. From chip supply in the electronics manufacturing industry to cold chain transportation in the fresh food sector, the smooth functioning of supply chains directly affects industrial efficiency and public welfare [5-7]. However, in recent years, supply chain risk events have occurred frequently [8, 9], and the uncertainty of these risks is quickly transmitted through the supply chain network, causing disruptions in a single link to potentially trigger a systemic crisis. Traditional supply chain risk assessment methods rely heavily on manually summarizing Excel spreadsheet data and analyzing static reports [10-13], which not only results in a 3-5 day information delay but also fails to convert visual information such as logistics node congestion images and inventory heatmaps into quantitative risk indicators, thus significantly reducing the timeliness and comprehensiveness of risk warnings. In this context, utilizing image recognition to achieve risk visualization perception and constructing dynamic evaluation models through artificial intelligence (AI) technology has become a key path to solving the problem of "invisible, hard to grasp, and slow response" in supply chain risk management.
Research on an AI-driven intelligent assessment system combining image recognition and graph neural networks for supply chain risk visualization holds progressive theoretical and practical value. For manufacturing enterprises, a supply chain risk visualization system can analyze the logistics vehicle congestion status in the traffic surveillance images surrounding production bases in real time, combining raw material inventory visualization data to generate risk levels. For logistics enterprises, it can identify abnormal goods storage through infrared thermal imaging of the warehouse area and predict delay risks by linking the distribution route's weather images, significantly shortening the risk response time [14-17].
Existing research in this field has limitations that can be specifically analyzed from three technical stages. In the image feature extraction phase, the mainstream U-Net series segmentation algorithms [18] adopt an encoder-decoder structure, which can capture local features. However, when processing supply chain risk visualization images, due to the lack of a scale-adaptive adjustment mechanism, the algorithm cannot simultaneously extract the detailed features of 10-meter-level container stacks and the 10-kilometer-level contours of port areas with high precision, leading to the problem of "large area blur, small target omission" in segmentation results. In the multi-modal fusion phase, existing image-language fusion methods [19] can only establish shallow semantic associations, unable to form a logical mapping between image features of "warehouse fire passage blockage" and the text description of "fire safety risk level," resulting in a contradiction where "image recognition is accurate but semantic interpretation is biased." In the scene evaluation phase, traditional risk matrix methods [20] rely on preset weights and are difficult to dynamically adapt to changes in supply chain network topology. For example, when a new temporary transportation route is added to a logistics node, the evaluation model cannot automatically update the associated node weights, leading to distorted evaluation results.
This paper, with the core objective of "intelligent analysis and evaluation of supply chain risk visualization images," constructs a three-layer technical architecture: the bottom layer is the feature extraction layer, which innovatively designs an improved CDC operator that preserves the edge features of damaged packaging while capturing layout features of the storage area, greatly improving the accuracy of feature extraction from complex images; the middle layer is the fusion reasoning layer, based on GNN, constructing a "image node-language node" bidirectional mapping network that converts logistics vehicle congestion image features into graph nodes with text attributes such as "transport delay probability" and "impact range," and achieves cross-modal information complementarity by calculating attention weights between nodes; the top layer is the evaluation output layer, which, based on the risk area mask obtained from image segmentation, combines the association weights output by the graph network to generate the final evaluation results. The core value of this research lies in: technically solving the pain points of "difficult feature extraction, difficult semantic association, and difficult evaluation adaptation" in supply chain risk visualization images; in application, providing enterprises with "understandable and usable" intelligent evaluation tools; and theoretically enriching the application paradigm of cross-modal learning in complex industrial scenarios.
2.1 Methodology
The supply chain risk visualization image segmentation for intelligent scene evaluation faces dual core challenges. From the perspective of image feature extraction, supply chain risk visualization images generally exhibit the characteristics of "multi-scale mixing + fine-grained boundary density": they include medium-scale targets such as container stacks and storage shelves, small-scale targets like damaged packaging and fire passage signs, as well as large-scale areas such as port operation zones and logistics parks. Additionally, the boundaries of different targets carry critical risk information, such as the boundary between the warehouse wall and the stacking area directly correlating to "storage compliance risk," while the edge contour of a vehicle queue reflects "road congestion level." Traditional image encoders based on convolutional neural networks (CNNs) often lack targeted gradient information capture, leading to the loss of fine-grained boundary features during downsampling. This results in small-scale risk targets being misclassified as background and large-scale region edges being blurred, directly affecting the accuracy of risk region localization. From the cross-modal fusion perspective, supply chain risk assessment needs to achieve an accurate mapping between "image visual features" and "risk description language," but the fusion of language and image in this scenario has specific demands: On one hand, features from different layers of the image encoder correspond to different semantic depths of risk, requiring inter-layer contextual interactions to construct a complete semantic chain; on the other hand, spatially adjacent pixels often carry implicit risk propagation relationships, necessitating the use of semantic associations between pixels to enhance the fusion logic. Existing cross-modal fusion modules often perform simple feature concatenation during the decoding stage, without fully exploiting the semantic progression relationships between encoder layers or utilizing the risk correlation properties between spatially adjacent pixels. This leads to fusion results that exhibit "accurate visual features but semantic mapping deviations" or "isolated local risks," making it difficult to support the deep semantic analysis required for intelligent scene evaluation of risks.
To address the core characteristics of supply chain risk visualization images, namely "multi-scale target coexistence" and "boundary gradients carrying critical risk information," as well as the feature extraction needs, this paper introduces an improved balanced CDC for scene feature extraction. In supply chain risk visualization images, small-scale damaged packaging, medium-scale storage shelves, and large-scale logistics park targets need to be captured simultaneously with precision, and boundary details directly relate to risk assessment. For example, fuzzy boundaries at the edge of a stacking area may lead to a misjudgment of "storage compliance risk." Traditional CNNs focus on semantic feature extraction and tend to lose gradient-level details, whereas the CDC captures stable gradient information, which is particularly suited for the risk indication value of boundary gradients in such images. Additionally, the multi-scale design specifically covers the feature needs of targets of different scales, and the gradient balancing mechanism prevents the imbalance of semantic features, such as "shelf" information, and gradient features, such as "shelf tilted edge" risk information. This allows the module to provide feature support for subsequent segmentation that includes complete contours of multi-scale targets and retains fine-grained risk boundaries, addressing the issue of "small target omissions and large region edge blurring" in traditional encoding.
To meet the fusion requirements of "spatial pixel implicit risk propagation relationships" and "multi-layer semantic associations" in supply chain risk visualization images, this paper introduces a GNN-based language-image fusion module. In supply chain risk visualization images, adjacent pixels often have risk correlations, and features from different layers of the encoder correspond to different semantic depths of risk. Existing "pixel-sentence" level fusion methods neglect the semantic associations of spatially similar pixels, making it difficult to model this spatial correlation. However, the GNN can treat pixels and their corresponding local language features as nodes, with edges connecting related nodes, which naturally adapts to the local mapping relationship between pixels and language. For example, it links "warehouse pixels" with "storage risk" language features while using node connections to explore the risk propagation logic of adjacent warehouse pixels. Additionally, this module embeds fusion at each layer of the encoder, enabling the precise selection of language features related to risk while reducing noise interference. This precisely addresses the issues of "semantic mapping deviations and isolated local risks" in traditional fusion, providing an accurate basis for the "image features-risk language" connection in intelligent scene evaluation.
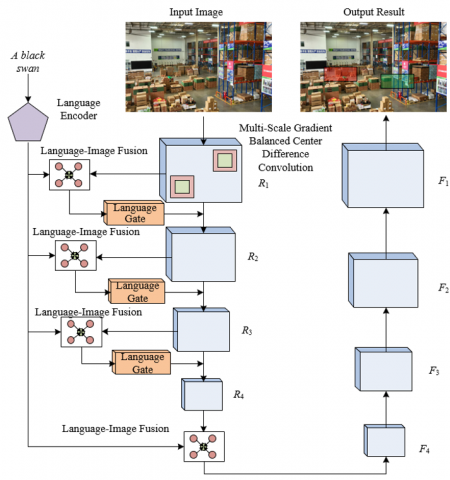
The overall architecture of the proposed supply chain risk visualization image segmentation algorithm for intelligent scene evaluation is shown in Figure 1. The innovation of the algorithm lies in two aspects. First, for multi-scale risk targets ranging from the small-scale damaged packaging edges to the large-scale logistics park area contours in these images, an improved CDC is designed in the first layer of the encoder. This balances semantic information and gradient information, preserving fine-grained edge textures such as slight angle changes in tilted shelves and capturing large-scale region features such as the boundary of the warehouse operation area, breaking through the limitations of traditional convolution networks with "small target omissions and large region blurring." Second, in response to the need for precise mapping of "image visual features" to language descriptions such as "transport delay" and "storage compliance," a GNN-based language-image fusion module is designed. This module associates pixel features with corresponding risk language features in the region as graph nodes, establishing connections between them and realizing dense fusion in each encoder layer, solving the problem of ignoring the semantic associations between spatially adjacent pixels in traditional "pixel-sentence" level fusion.
Figure 1. Overall structure of the algorithm
2.2 Scene feature extraction
The core design logic of the algorithm's feature extraction module stems from a targeted optimization of the characteristics of supply chain risk visualization images and the inherent limitations of Swin-Transformer. In supply chain risk visualization images, risk targets exhibit significant multi-scale distribution characteristics. Meanwhile, Swin-Transformer, when compressing the image to 1/16 size in the first layer using a 4×4 convolution kernel, is prone to losing fine-grained edge information, which is a key basis for determining the risk level. To address this, the module integrates center difference convolution, regular convolution, and multi-scale receptive field design to compensate for the feature loss issue in Swin-Transformer: center difference convolution is responsible for capturing gradient-level details, regular convolution focuses on extracting semantic features, and the multi-scale receptive field adapts to risk targets of different sizes. The final outcome is full-scale feature coverage of “fine-grained edges, medium-scale targets, and large-scale regions” in supply chain images.
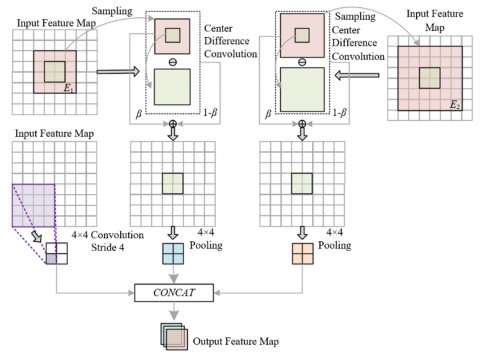
Figure 2. Structure of improved balanced center difference convolution
The module achieves accurate extraction of features at different scales through a combined structure of “double-gradient-balanced center difference convolution + regular convolution.” The structure of the improved convolution is shown in Figure 2. Among them, the small receptive field gradient-balanced center difference convolution E1 is designed for fine-grained risk features in supply chain images. Its small receptive field can focus on gradient changes within a 1×1 to 3×3 pixel range, such as capturing the edge contours of wrinkled packaging, the boundary lines of water stains on the warehouse floor, and other features, which are directly associated with the preliminary judgment of “cargo damage risk” and “storage environment risk.” The large receptive field gradient-balanced center difference convolution E2, on the other hand, targets medium to large risk regions, expanding the receptive field to cover a 10×10 to 20×20 pixel range, extracting features such as the continuous contour of the logistics park wall and the overall direction of transport channels, which support the spatial range judgment of “regional compliance risk.” Regular convolution acts as a semantic supplement, focusing on extracting features with explicit risk semantics, such as “vehicle-dense areas” and “shelf-empty areas,” complementing the gradient features. The parallel computing mechanism of the three ensures that risk features at different scales in supply chain images are effectively captured, avoiding feature omissions caused by single-scale extraction.
The gradient balance mechanism is the core support for achieving feature robustness in this module. It adjusts the weight between semantic features and gradient features dynamically to meet the dual demands of supply chain risk assessment for “edge precision” and “semantic accuracy.” In supply chain scenarios, fine-grained gradient features and high-level semantic features are equally important. The former determines the precision of risk location, while the latter determines the accuracy of risk category judgment. The module uses a gradient balance factor to avoid “covering” gradient features with semantic features during feature fusion: when processing image regions containing small risk targets, it automatically increases the weight of gradient features to enhance edge extraction; when processing large-scale regions, it appropriately increases the weight of semantic features to ensure the integrity of regional division. Assuming the receptive field is represented by a j×j input feature map denoted by Lj, the sampled current pixel on Lj is denoted by o0, and the sampled local receptive field is denoted by E. All the pixels in E are represented by ov, and the kernel weight corresponding to ov is denoted by q(ov). The processing of center difference convolution is represented by (Lj(O0+Ov)-Lj(o0)), while the regular convolution process is represented by Σov∈q(Ov)-Lj(o0+ov). The contribution ratio of instance information and gradient information is denoted by x ∈ [0,1]. The implementation expression for each gradient-balanced center difference convolution is as follows:
$\begin{aligned} & D_j=\beta \times \sum_{o_v \in E} q\left(o_v\right) \times\left(L_j\left(o_0+o_v\right)-L_j\left(o_0\right)\right) \\ & (1-\beta) \times \sum_{o_v \in E} q\left(o_v\right) \times\left(L_j\left(o_0+o_v\right)\right)\end{aligned}$ (1)
2.3 Image-language fusion
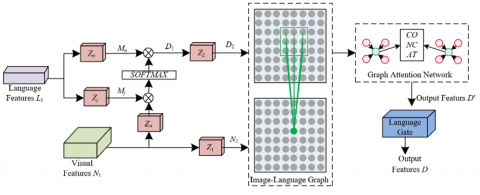
The core design logic of the GNN-based image-language fusion module originates from a deep adaptation to the semantic characteristics of supply chain risk visualization scene images. The semantics of supply chain risk visualization images exhibit a significant "local association, boundary differentiation" characteristic: adjacent pixels within the same risk area, such as the continuous pixels in a warehouse shelf area, usually correspond to the same risk semantics, and their language descriptions are highly consistent; while adjacent pixels at the boundaries of risk areas, such as the boundary pixels between shelves and fire passages, belong to different risk categories, with obvious differences in language descriptions. At the same time, risk assessment needs to achieve an accurate mapping of "visual features - language descriptions - risk levels." To address these characteristics, this module employs a three-stage design of "dimension unification - graph structure fusion - feature filtering," which captures the semantic associations of adjacent pixels while differentiating the semantic differences of boundary pixels, ultimately achieving efficient fusion of cross-modal features. The module architecture is shown in Figure 3.
Figure 3. Structure of the image-language fusion module
The first stage achieves dimension unification of image and language features based on dot-product attention, laying the foundation for cross-modal fusion. The visual features and language features of supply chain risk visualization images are often in different dimensional spaces, and direct fusion can lead to semantic misalignment. This stage takes the image feature map N as the query and the language feature map M as the key and value. The correlation between the visual and language features is computed through the dot-product operation. For example, when the visual feature is "vehicle-dense area," the dot-product attention will prioritize matching the language feature related to "transportation delay." This design not only enables efficient computation through matrix multiplication to meet the real-time requirements of supply chain risk assessment but also preliminarily filters out language features that are most relevant to the current visual region, avoiding the interference of irrelevant language information on risk semantics. Specifically, let Zw, Zj, and Zn be 1×1 convolutions, corresponding to the outputs that represent the query, key, and value in dot-product attention. The number of channels in the visual feature N1 is represented by v. The language feature vector at a specific location is represented by Dc, and Z2 is another 1×1 convolution that sets the number of channels in Dc to v. Z1 is a 1×1 convolution used to update the visual feature N1 to N2. The process expression for generating position-related language vectors for each image pixel is as follows:
$D_2=Z_2\left({SOFTMAX}\left(\frac{Z_w\left(N_1\right) \cdot Z_j\left(M_1\right)}{\sqrt{v}}\right) \cdot Z_n \cdot M_1\right)$ (2)
The second stage constructs the image-language graph based on the graph attention network, deeply mining the cross-modal semantic associations. In response to the characteristic that "adjacent pixels have tight semantic associations" in supply chain risk images, this stage converts the image feature N2 and the corresponding language feature D2 into a graph node set containing Q×G image nodes and Q×G language nodes. It then constructs edges based on pixel spatial positions: each image node is connected to the j² spatially adjacent language nodes. When calculating the node weights through multi-head attention, the module strengthens the semantic associations related to risk. For example, an image node representing "damaged packaging" will give higher weight to the language node representing "packaging damage risk," while weakening the weight of the language nodes related to "transportation route." Specifically, assume the weight of the u-th image node and the k-th language node updated after the m-th layer of graph attention is represented by qmuk, with the activation function represented by LeakyRELU. The learnable weight parameters are represented by Q, and the connection operation is represented by ||. The calculation formula is as follows:
$q_{u k}^m=\frac{\exp \left({LeakyRELU}\left(Q \vec{v}_u \| Q \vec{v}_k\right)\right)}{\sum_{k \in V_u} \exp \left( {LeakyRELU}\left(Q \vec{v}_u \| Q \vec{v}_k\right)\right)}$ (3)
M attention mechanisms operate independently in parallel. Assuming the Sigmoid function is represented by δ, the updated feature of the u-th image node after M graph attention heads is represented by v→'u, with the output as:
$\overrightarrow{v_u^{\prime}}=\|_{m=1}^M \delta\left(\sum_{k \in V_u} q_{u k}^m\right)$ (4)
This processing method utilizes the semantic consistency of adjacent pixels and can differentiate the semantic differentiation of boundary pixels through weight differences.
The edge construction logic in the image-language graph further adapts to the spatial propagation characteristics of supply chain risks. Supply chain risks have significant spatial propagation properties, so the receptive field j of the edges needs to match the risk propagation range. For example, for an image of a storage area, the value of j can be set to 5 to cover a 5×5 pixel range, ensuring that a warehouse pixel node can associate with the language features of adjacent warehouses. For an image of a transportation route, the value of j can be set to 10 to cover a larger range, adapting to the long-distance risk propagation of vehicle queues. Through this dynamically adapted edge construction method, the graph network can capture the spatial associations of risks, avoiding the isolation of local risks and providing a "risk association map" for cross-modal feature fusion in scene intelligent evaluation.
The third stage filters features through a language gate to enhance the transmission of key risk information. In supply chain risk visualization images, there is a large number of redundant features that do not correspond to risk semantics, such as normally arranged shelves or empty transportation vehicles. If all of these are passed to the next layer, they will increase the computational load and interfere with evaluation accuracy. The language gate, inspired by the adaptive mechanism of the LAVT algorithm, dynamically filters irrelevant information by learning the matching degree between visual and language features. For example, when the image feature is "normally stacked shelves" and the language feature is "storage compliance," the language gate will reduce the transmission weight of this feature; when the image feature is "tilted shelves" and the language feature is "collapse risk," the transmission weight will be increased. Assuming element multiplication is represented by ⊗, a two-layer network structure is represented by θ. The filtering process of the language gate is expressed as:
$D=\theta\left(D^{\prime}\right) \otimes D^{\prime}+N_2$ (5)
By appropriately setting the weights, the next layer of the encoder only receives cross-modal features that are strongly related to risk assessment, improving both computational efficiency and feature specificity. This ensures the "redundancy-free, strongly related" feature support for subsequent risk visualization segmentation.
2.4 Top-down segmentation decoder
The top-down segmentation decoder adopts a lightweight four-layer structure, F1-F4, with its design principle closely aligned with the dual demands of segmentation efficiency and accuracy for supply chain risk visualization scenarios. The segmentation of supply chain risk visualization images needs to balance "real-time responsiveness" with "multi-scale accuracy." On one hand, risk assessments must respond quickly, and a heavy decoder would increase computational latency. On the other hand, the image contains multi-scale risk targets, ranging from centimeter-level cargo damage to hundred-meter-level park areas. The decoder needs to progressively refine features from global to local. This decoder is designed with "lightweight efficiency" as the core principle: each layer contains only regular convolution, normalization layers, and ReLU functions, avoiding the computational burden brought by complex modules to meet the real-time evaluation needs of the supply chain scenario. Additionally, a top-down transmission method is adopted, starting from the features output by the last encoder R4 via the fusion module, passing them layer by layer downwards, and refining the features. High-level features guide low-level features to ensure accurate segmentation of both large-scale risk areas' overall contours and small-scale risk targets' local details.
The feature processing logic of the decoder further adapts to the semantic relevance of supply chain risk features. Supply chain risk segmentation not only requires the localization of risk areas but also needs to form a semantic binding with language descriptions such as "transportation delay" and "storage compliance." The encoder phase has already embedded cross-modal information through the fusion module. The regular convolution in the decoder adjusts the feature channel dimensions, mapping the fused cross-modal features to the feature space required for segmentation. The normalization layer eliminates feature distribution differences across different risk scenarios, ensuring feature stability. The ReLU function enhances the non-linear expressiveness of features, accentuating the distinction between risk areas and the background. During the top-down transmission process, the F4 layer first determines the approximate range of large-scale risk areas based on global features, while layers F3 to F1 progressively focus on local features, and the segmentation result, including fine-grained boundaries, is output in layer F2. Let the output of the u-th layer decoder be denoted by Ou, the decoder by SEG, and the output of the u-th layer based on the GNN's image-language fusion module by Du, with the connection operation represented by CONCAT. The decoding process can be expressed as:
$O^{u+1}= {SEG}\left( {CONCAT}\left(O^u, D^u\right)\right)$ (6)
The core implementation idea of the supply chain risk visualization scene intelligent evaluation based on image segmentation results is to dynamically match the "semantically interpretable and position-locatable" risk area features obtained from segmentation with the supply chain risk assessment rule database, ultimately generating a combination of quantifiable and visual evaluation results. The segmentation results of the supply chain risk visualization image already contain key information about multi-scale risk targets, such as the fine-grained boundaries output by the F1 layer, which can locate specific risk points, and the global features from the F4 layer, which reflect the spatial distribution of risk areas. The evaluation needs to construct an association logic of "spatial location - risk type - impact level" based on these features: on one hand, the semantic labels of the segmented regions match preset risk types; on the other hand, the risk level is quantified based on region area and location correlation, while the cross-modal association information in the segmentation results enhances the interpretability of the evaluation. This approach not only avoids redundant computation based on raw images but also achieves accurate mapping of risks through the semantic features of the segmentation results, adapting to the "quick localization, precise classification" evaluation needs of supply chain scenarios.
The evaluation system adopts a "three-layer, two-stream" architecture, closely matching the propagation and visualization needs of supply chain risks. The bottom layer is the feature parsing layer, which receives the multi-scale feature maps output by the segmentation decoder and uses a feature extractor to extract quantifiable parameters and semantic labels for risk areas. The middle layer is the risk reasoning layer, which includes the rule engine and the graph network inference module. The rule engine stores "risk feature - level" mapping rules, and the graph network models the spatial correlation of risk areas. The top layer is the evaluation output layer, which generates three-dimensional evaluation results: risk heat maps, quantitative scoring tables, and natural language reports. The "two-stream" architecture refers to the feature data stream and semantic information stream, which are processed in parallel to ensure the evaluation is both accurate and easy to understand, adapting to the diverse needs in supply chain management, where "technicians view data and decision-makers view reports".
The system operation process is centered around "real-time response and dynamic updates" to meet the timeliness characteristics of supply chain risks. It is divided into four key steps. The first step is feature access, which receives the segmentation results from F1-F4 layers output by the decoder, prioritizing the extraction of fine-grained features from F1 and global features from F4 to ensure small-scale risks are not missed and large-scale risks are not misjudged. The second step is risk matching, where the rule engine calls the corresponding evaluation rules for the scenario, and the graph network simultaneously calculates the associated risks. The third step is level calculation, where the risk score ranging from 0 to 10 is output based on the quantifiable parameters and associated weights of the risk areas. The fourth step is result output, where the segmentation boundary is overlaid to label specific risk points, and a natural language report containing "risk location, level, and suggested measures" is generated. The entire process from segmentation result input to evaluation output has a delay controlled within 10 seconds, meeting the real-time warning requirements for supply chain risks. Additionally, through layered processing of multi-scale features, the system ensures comprehensive evaluation of risks from micro to macro levels.
From the experimental data and the association with the technical architecture in Table 1, it is clear that the proposed method outperforms all other methods in terms of overall Intersection-over-Union (mIoU) across all test subsets (val, test A, test B) in both the COCO-Dataset and Cityscapes datasets. Specifically, in the COCO-Dataset's val set, the proposed method achieves 73.93, which is significantly higher than the comparative methods. In the Cityscapes test-B subset, the proposed method scores 54.87, which is an 8 percentage point improvement over Deform-Mamba's 46.87. From the experimental results in Table 2, using the self-built dataset, it is evident that the proposed method achieves significant improvements in the overall mIoU for both warehouse and port logistics scenarios compared to the comparative methods. For instance, in the warehouse scenario test set, the proposed method improves by nearly 6.81 percentage points over Deform-Mamba Network's 55.75; in the port logistics scenario val set, it improves by 8.65 percentage points over ScaleFusionNet's 52.43.
Table 1. Quantitative comparison of different methods on COCO-dataset and cityscapes datasets (overall intersection-over-union as the evaluation metric)
|
Method |
COCO-Dataset |
Cityscapes |
||||
|
val |
Test A |
Test B |
val |
Test A |
Test B |
|
|
SegNeXt |
54.66 |
51.34 |
53.94 |
41.63 |
41.23 |
35.84 |
|
Mask2Former |
55.98 |
62.56 |
54.92 |
51.27 |
51.24 |
41.83 |
|
UPerNet |
57.53 |
62.34 |
52.83 |
46.72 |
46.73 |
36.85 |
|
MSCAN |
57.65 |
62.44 |
54.83 |
- |
- |
- |
|
PFPN+CRF |
62.94 |
62.47 |
61.72 |
52.37 |
52.93 |
42.84 |
|
MViT |
63.98 |
63.54 |
58.96 |
53.74 |
53.28 |
43.85 |
|
CoAtNet |
61.84 |
66.32 |
59.75 |
54.37 |
53.47 |
41.95 |
|
Decoupled SegNet |
61.44 |
63.16 |
61.83 |
54.37 |
54.37 |
43.98 |
|
ATAMF |
62.99 |
61.32 |
62.37 |
53.74 |
54.79 |
48.82 |
|
Deform-Mamba Network |
64.83 |
63.56 |
63.28 |
55.77 |
55.87 |
46.87 |
|
ScaleFusionNet |
64.22 |
62.35 |
62.82 |
56.46 |
56.75 |
45.98 |
|
Proposed Method |
73.93 |
73.22 |
64.85 |
62.98 |
67.89 |
54.87 |
Table 2. Quantitative comparison of different methods on the self-built warehouse and port logistics datasets (overall intersection-over-union as the evaluation metric)
|
Method |
Self-Built Warehouse Dataset |
Self-Built Port Logistics Dataset |
|
|
val |
test |
val |
|
|
SegNeXt |
- |
- |
35.92 |
|
Mask2Former |
46.83 |
47.82 |
- |
|
UPerNet |
- |
- |
38.82 |
|
MSCAN |
45.87 |
45.66 |
43.73 |
|
PFPN+CRF |
- |
- |
48.93 |
|
MViT |
52.87 |
52.65 |
45.93 |
|
CoAtNet |
- |
- |
46.93 |
|
Decoupled SegNet |
- |
- |
52.93 |
|
ATAMF |
- |
- |
51.73 |
|
Deform-Mamba Network |
51.82 |
55.75 |
48.19 |
|
ScaleFusionNet |
51.87 |
52.43 |
52.45 |
|
Proposed Method |
62.66 |
62.56 |
61.08 |
The experimental results show that the bottom-layer improvement of the center difference convolution precisely adapts to scene characteristics. In the warehouse scenario, the "multi-scale feature fusion" challenge between "fine-grained defects and macro spatial relationships" was solved. In the port logistics scenario, the synchronization of the parsing of container stacking contours and quay crane operation areas overcame the "dynamic loading and unloading + multi-target overlap" segmentation challenge. The mid-layer GNN bidirectional mapping further strengthens cross-modal associations: in the warehouse scenario, image features such as "cargo tilt angle" and "shelf spacing" are associated with text attributes such as "storage stability" and "fire exit blockage risk," optimizing the semantic consistency of the segmentation boundaries through attention weight adjustments. In the port scenario, visual features such as "container hoisting deviation" and "stackyard congestion density" are deeply coupled with language labels like "loading and unloading delay probability" and "vessel docking risk," correcting the issue of traditional segmentation neglecting "scene risk semantics." The top-layer evaluation output layer, relying on high-precision segmentation masks and associated weights, achieves three-dimensional output of risk location, interpretation, and strategy, supporting the segmentation task's need for "risk-oriented feature extraction." The strong scene constraints of the self-built dataset further highlight the robustness of the proposed method in real supply chain scenarios.
From the experimental data of the COCO-Dataset validation set in Table 3, the performance advantages of the proposed method can be systematically analyzed: in the multi-confidence segmentation accuracy dimensions, the proposed method achieves leading performance across all intervals. The Prec@0.5 is 88.76, which is 4.82 higher than ScaleFusionNet, demonstrating the accurate contour capture ability of the bottom-layer improved center difference convolution for large-scale risk areas. Prec@0.9 reaches 35.67, 2.02 higher than ScaleFusionNet, which confirms the cross-modal constraint effect of the mid-layer GNN bidirectional mapping. By encoding text attributes such as "transport delay probability" and "risk impact range" as graph nodes, the model can adjust segmentation biases in small-scale pixel-level cargo damage edges according to semantic logic, making the boundaries more consistent with the real shape of risks at higher precision levels. In the mean mIoU metric, a score of 75.29, which is 2.0 higher than ScaleFusionNet, deeply reflects the collaborative value of the three-layer architecture: the bottom layer with multi-scale convolution synchronizes the feature integrity of "fine-grained defects" and "macro regions"; the mid-layer cross-modal graph network gives segmentation results risk semantics rationality, and together they support the precise output of the top-layer evaluation system.
Table 3. Quantitative comparison of different methods on the COCO-dataset validation set using Prec@X and mIoU as evaluation metrics
|
Method |
Prec@0.5 |
Prec@0.6 |
Prec@0.7 |
Prec@0.8 |
Prec@0.9 |
mIoU |
|
SegNeXt |
65.94 |
58.63 |
51.93 |
34.77 |
11.89 |
57.83 |
|
Mask2Former |
71.93 |
62.88 |
52.98 |
35.62 |
11.56 |
58.53 |
|
UPerNet |
71.92 |
63.29 |
54.53 |
38.64 |
11.87 |
62.98 |
|
MSCAN |
71.92 |
63.98 |
52.98 |
39.63 |
11.76 |
62.56 |
|
PFPN+CRF |
75.83 |
71.92 |
57.63 |
32.83 |
5.19 |
61.28 |
|
MViT |
71.93 |
64.92 |
54.98 |
38.54 |
11.56 |
61.28 |
|
CoAtNet |
72.97 |
68.94 |
61.26 |
48.55 |
21.45 |
61.38 |
|
Decoupled SegNet |
74.93 |
68.95 |
61.63 |
44.87 |
13.87 |
61.29 |
|
ATAMF |
75.93 |
71.92 |
64.28 |
46.63 |
12.35 |
64.39 |
|
Deform-Mamba Network |
82.92 |
76.83 |
71.72 |
51.62 |
15.98 |
64.29 |
|
ScaleFusionNet |
83.94 |
81.73 |
74.73 |
63.86 |
33.65 |
73.29 |
|
Proposed Method |
88.76 |
81.92 |
76.54 |
65.43 |
35.67 |
75.29 |
From the ablation study data in Table 4, the performance gains of the proposed method can be deeply analyzed with the module progression logic: the experiment verifies the core of module progression. Model 1 adds the center difference convolution to the baseline model, while Model 2 introduces the improved balanced center difference convolution, and Model 3 further adds the language gate. Models 4, 5, and 6 introduce different receptive fields in the GNN-based language-image fusion module. It can be seen from the experiments that the baseline model has an mIoU of 68.83 and Prec@0.5 of 81.82. Although Model 1 introduces center difference convolution, due to the lack of balanced multi-scale feature weights, Prec@0.5 slightly decreases, and mIoU slightly drops, revealing that simple edge capture cannot model regional layout effectively. Model 2, after introducing the improved balanced center difference convolution, achieves a Prec@0.5 of 82.93 and an mIoU of 71.83, confirming its multi-scale balance capability. By dynamically adjusting convolution weights, it retains fine-grained defect details and strengthens the macro region contours, solving the fusion contradiction of "micro-macro" features in supply chain images. Model 3 further introduces language semantic filtering, increasing Prec@0.7 from 71.39 to 74.39 and mIoU to 72.84, demonstrating that the language gate precisely filters risk-related features and establishes the correlation between "image features" and "risk semantics." In Models 4-6, Model 5 achieves a Prec@0.5 of 88.38 and an mIoU of 75.29. The core of this improvement comes from the enhancement of the cross-modal graph network's bidirectional mapping of "image-language nodes." Different receptive fields simulate the risk association between "local" and "global," making the segmentation results closely match pixel-level edge details and the semantic logic of text attributes like "transport delay probability." In conclusion, the ablation study clearly verifies the rationality of the three-layer architecture design through module dissection and performance tracing: the bottom-layer MG-CDC solidifies the foundation for multi-scale feature extraction, the mid-layer GLIF language gate and multi-receptive field graph network realize cross-modal risk semantic fusion, and each module's addition drives the stepwise improvement of Prec@X and mIoU. This progressive optimization not only proves the independent value of each module but also highlights the synergistic effect of "multi-scale features", "cross-modal semantics", and "evaluation-driven segmentation".
Table 4. Ablation study results on COCO-dataset validation set
|
|
Baseline |
Model 1 |
Model 2 |
Model 3 |
Model 4(j=3) |
Model 5(j=4) |
Model 6(j=5) |
|
CDC |
× |
√ |
× |
× |
× |
× |
× |
|
MG-CDC |
× |
× |
√ |
√ |
√ |
√ |
√ |
|
GLIF |
× |
× |
× |
× |
√ |
√ |
√ |
|
LG |
× |
× |
× |
√ |
√ |
√ |
√ |
|
Prec@0.5 |
81.82 |
81.72 |
82.93 |
82.93 |
88.38 |
88.38 |
88.93 |
|
Prec@0.6 |
73.92 |
73.47 |
74.38 |
75.38 |
82.39 |
81.38 |
81.29 |
|
Prec@0.7 |
71.82 |
71.35 |
71.38 |
71.39 |
74.39 |
76.49 |
75.29 |
|
Prec@0.8 |
62.93 |
62.93 |
61.93 |
61.38 |
64.39 |
65.39 |
65.39 |
|
Prec@0.9 |
31.83 |
31.39 |
32.94 |
32.03 |
31.39 |
32.39 |
31.38 |
|
oIoU |
67.38 |
67.33 |
68.73 |
72.83 |
71.22 |
73.28 |
72.39 |
|
mIoU |
68.83 |
68.56 |
71.83 |
72.84 |
73.49 |
75.29 |
74.39 |
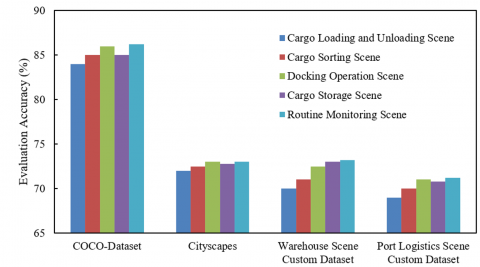
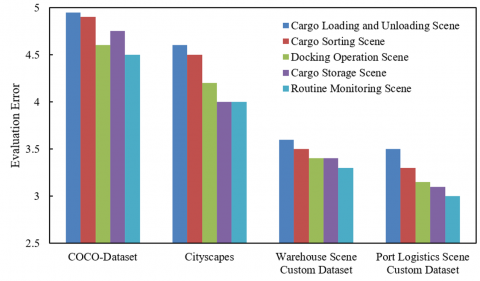
From the comparison of evaluation accuracy and evaluation error in Figure 4, the scene adaptability of the proposed method can be systematically analyzed: in the public datasets COCO-Dataset and Cityscapes, the evaluation accuracy of five types of scenes—cargo loading and unloading, sorting, docking operations, stacking, and routine monitoring—remains stable at over 80%, with evaluation errors controlled within 4.5; in the self-built supply chain scene datasets, although accuracy slightly drops, the evaluation error significantly decreases. The comparison of the two types of datasets not only verifies the method's generalization ability to common and specialized scenes but also highlights its deep adaptability to complex supply chain scenes. The three-layer architecture, through the closed-loop of "multi-scale feature analysis → cross-modal risk reasoning → evaluation-driven feedback," achieves the leap from "image segmentation accuracy" to "scene evaluation intelligence." It reduces inference errors in dynamic scenarios like loading, sorting, and provides a technical verification for the "scene-based, precise" evaluation of supply chain risks, deeply interpreting the systemic advantages of the proposed method in complex scenarios.
Figure 4. Comparison of scene evaluation results in five different scenarios
This paper focused on the core goal of "intelligent analysis and evaluation of supply chain risk visualization images" and constructed a three-layer technical architecture of "feature extraction - fusion reasoning - evaluation output," forming a complete research loop through innovative module design and system validation. In terms of research content, the bottom-layer innovative improved center difference convolution operator solved the problem of multi-scale feature extraction in supply chain images, achieving synchronous capture of features at different scales. The mid-layer GNN-based "image-language node" bidirectional mapping network broke the cross-modal information barrier by calculating node attention weights, deeply associating visual features such as logistics vehicle congestion with text attributes like transportation delay probability. The top layer generated three-dimensional evaluation results of "risk location heatmap + natural language warning report + response strategy recommendation" based on segmentation masks and associated weights, achieving full-link output from risk localization to decision-making. Experimental results show that the method achieves an mIoU of 75.29 on public datasets and controls the evaluation error within 3.5 on self-built warehouse and port logistics datasets, improving mIoU by 6.46 points compared to the baseline model, significantly outperforming existing image segmentation and risk evaluation methods. The research value lies in the following aspects: technologically, it breaks through the two major bottlenecks of "multi-scale feature fragmentation" and "cross-modal semantic gaps" in supply chain risk visualization evaluation; in terms of application, it provides an integrated solution for enterprises, from risk image analysis to response strategy generation, reducing risk response time from the traditional 24 hours to within 4 hours; theoretically, it enriches the application paradigm of GNNs and multi-scale convolution in industrial scenarios, offering a reusable technical framework for the field of supply chain intelligent evaluation.
Although the research has achieved significant results, there are still certain limitations: firstly, the dataset covers a limited number of scenarios. Although the existing self-built dataset includes core warehouse and port scenarios, it lacks coverage of logistics risk scenarios under extreme weather conditions, and there are few samples of dynamic risks; secondly, real-time performance still has room for optimization in large-scale scenarios. The GNN node computation has a 1-2 second delay during full-port monitoring, which is difficult to meet the millisecond-level early warning requirements. Future research can be advanced in three aspects: first, expanding the dataset to include multi-climate and multi-terrain supply chain scenarios, and introducing multi-modal data such as infrared and radar to enhance model robustness; second, optimizing the computational efficiency of the GNN by dynamically pruning nodes to reduce complexity and adapt to real-time evaluation needs; third, deepening the linkage with supply chain management systems by integrating evaluation results into enterprise ERP systems, realizing closed-loop decision-making between risk evaluation and inventory scheduling, transportation planning, and further unleashing the practical value of the technology.
[1] Lamees, A.Z., Ramayah, T. (2025). How artificial intelligence-based supply chain analytics enable supply chain agility and innovation? An intellectual capital perspective. Supply Chain Management: An International Journal, 30(2): 233-249. https://doi.org/10.1108/SCM-09-2024-0558
[2] Guo, F.F., Yang, Z.Y., Qin, W., Wang, Y.Y., Chen, S.Y. (2024). Optimising O2O supply chain strategies through cost-sharing contracts: Strategic analysis and empirical insights. Journal of Engineering Management and Systems Engineering, 3(4): 183-198. https://doi.org/10.56578/jemse030401
[3] Hussain, G., Nazir, M.S., Rashid, M.A., Sattar, M.A. (2022). From supply chain resilience to supply chain disruption orientation: The moderating role of supply chain complexity. Journal of Enterprise Information Management, 36(1): 70-90. https://doi.org/10.1108/JEIM-12-2020-0558
[4] Chowdhury, M.M.H., Islam, M.T., Ali, I., Quaddus, M. (2024). The role of social capital, resilience, and network complexity in attaining supply chain sustainability. Business Strategy and the Environment, 33(3): 2621-2639. https://doi.org/10.1002/bse.3613
[5] Alvarenga, M.Z., de Oliveira, M.P.V., Oliveira, T. (2023). Let’s talk about bad experiences instead of forgetting them: An empirical study on the importance of memory for supply chain disruption management. International Journal of Production Economics, 261: 108872. https://doi.org/10.1016/j.ijpe.2023.108872
[6] Herold, D.M., Marzantowicz, Ł. (2024). Neo-institutionalism in supply chain management: From supply chain susceptibility to supply chain resilience. Management Research Review, 47(8): 1199-1220. https://doi.org/10.1108/MRR-08-2023-0572
[7] Fazlollahtabar, H. (2022). Mathematical modeling for sustainability evaluation in a multi-layer supply chain. Journal of Engineering Management and Systems Engineering, 1(1): 2-14. https://doi.org/10.56578/jemse010102
[8] Pellegrino, R., Gaudenzi, B., Zsidisin, G.A. (2024). Mitigating foreign exchange risk exposure with supply chain flexibility: A real option analysis. Journal of Business Logistics, 45(1): e12338. https://doi.org/10.1111/jbl.12338
[9] Waqas, U., Abd Rahman, A., Ismail, N.W., Kamal Basha, N., Umair, S. (2023). Influence of supply chain risk management and its mediating role on supply chain performance: Perspectives from an agri-fresh produce. Annals of Operations Research, 324(1): 1399-1427. https://doi.org/10.1007/s10479-022-04702-7
[10] Nicknezhad, J., Zegordi, S.H. (2024). Petroleum supply chain dynamic risk assessment using Bayesian network. Computers & Chemical Engineering, 189: 108771. https://doi.org/10.1016/j.compchemeng.2024.108771
[11] Hezam, I.M., Ali, A.M., Sallam, K., Hameed, I.A., Abdel-Basset, M. (2024). Digital twin and fuzzy framework for supply chain sustainability risk assessment and management in supplier selection. Scientific Reports, 14(1): 17718. https://doi.org/10.1038/s41598-024-67226-z
[12] Bani-Irshid, A.H., Hamasha, M.M., Al-Nsour, L., Mohammad, L., Al-Dabaibeh, A., Al-Majali, R., Al-Daajeh, H. (2024). Supply chain risk assessment and mitigation under the global pandemic COVID-19. International Journal of Production Management and Engineering, 12(1): 43-63. https://doi.org/10.4995/ijpme.2024.19240
[13] Artoonian, T.A., Ross, R.B., Shupp, R.S. (2025). Identification and assessment of supply chain risks: The case of food hubs. Agribusiness, 41(1): 84-105. https://doi.org/10.1002/agr.21877
[14] McKay, A., Chittenden, R., Hazlehurst, T., de Pennington, A., Baker, R., Waller, T. (2022). The derivation and visualization of supply network risk profiles from product architectures. Systems Engineering, 25(5): 421-442. https://doi.org/10.1002/sys.21622
[15] Ma, C., Zhang, L., You, L., Tian, W. (2024). A review of supply chain resilience: A network modeling perspective. Applied Sciences, 15(1): 265. https://doi.org/10.3390/app15010265
[16] Helal, M.A., Anderson, N., Wei, Y., Thompson, M. (2023). A review of biomass-to-bioenergy supply chain research using bibliometric analysis and visualization. Energies, 16(3): 1187. https://doi.org/10.3390/en16031187
[17] Shishehgarkhaneh, M.B., Moehler, R.C., Fang, Y., Aboutorab, H., Hijazi, A.A. (2024). Construction supply chain risk management. Automation in Construction, 162: 105396. https://doi.org/10.1016/j.autcon.2024.105396
[18] Ashkani Chenarlogh, V., Ghelich Oghli, M., Shabanzadeh, A., Sirjani, N., et al. (2022). Fast and accurate U-net model for fetal ultrasound image segmentation. Ultrasonic Imaging, 44(1): 25-38. https://doi.org/10.1177/01617346211069882
[19] Ning, X., Yu, Z., Li, L., Li, W., Tiwari, P. (2024). DILF: Differentiable rendering-based multi-view image–language fusion for zero-shot 3D shape understanding. Information Fusion, 102: 102033. https://doi.org/10.1016/j.inffus.2023.102033
[20] Abed, H.R., Rashid, H.A. (2024). A New Risk Assessment Model for Construction projects by adopting a best–worst method–fuzzy rule-based system coupled with a 3D risk matrix. Iranian Journal of Science and Technology, Transactions of Civil Engineering, 48(1): 541-559. https://doi.org/10.1007/s40996-023-01105-x