S.M.C. Subashini*![]() | Subramaniam Sakthivel
| Subramaniam Sakthivel![]()
© 2025 The authors. This article is published by IIETA and is licensed under the CC BY 4.0 license (http://creativecommons.org/licenses/by/4.0/).
OPEN ACCESS
Hybrid classifiers are neural network models that are structured with two different network architectures to create the best deep learning model. The hybrid models are developed generally to meet certain complex feature learning problems. However, the nature of hybrid classifiers causes the network nodes to learn 'n' number of features, which increases the computational complexity of the classifiers. Therefore, the implementation of a hybrid classifier reaches an impossible state when the processor and memory spaces are restricted in real-time applications. The proposed work utilizes the feedforward neural network architecture with two hidden layers in combination with the eXtreme Gradient Boosting (XGBoost) algorithm to form a hybrid classifier called H-StrokeNet, and a Crow Search Optimization (CSO) algorithm is included in the work to reduce the complexity of the hybrid network by providing optimized feature extraction. The performance of the proposed work is verified with the regular XGBoost algorithm and deep neural networks using the Laboratory of Processing Image, Signals, and Computer Science (LAPISCO) dataset, and a comparative analysis is made with different algorithms such as support vector machine (SVM), Decision Tree (DT), Naïve Bayes (NB), k-Nearest Neighbor (kNN), and XGBoost. Results show the superior performance of the proposed system with an overall accuracy of 96.55%, whereas it is 92.09% with the XGBoost classifier.
stroke classification, neural network, optimization algorithm, eXtreme Gradient Boosting (XGBoost)
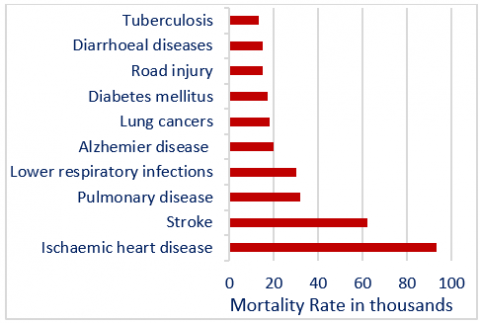
Stroke is a serious global health issue which became second second-largest cause of death from 2000-2019. As per World Health Organisation statistics, around 6.2 million deaths occur due to stroke and the percentage increases from 5.6 million to 6.2 million [1]. Figure 1 shows the detailed statistics. Thus, detecting stroke from brain images is performed through automatic image processing applications for better diagnosis. Image processing applications are widely used in various health care systems. Specifically in the stroke analysis, the brain images are obtained as magnetic resonance imaging (MRI) images and computed tomography (CT) images. These images are analyzed, and the stroke lesions are detected to define the stroke type effectively.
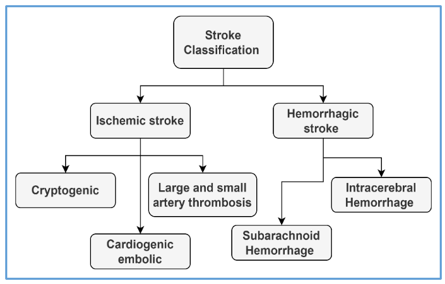
Strokes are generally classified into two types as ischemic and hemorrhagic strokes. Ischemic stroke occurs due to a clot in the blood vessel, whereas hemorrhagic stroke occurs due to bleeding in the brain. Further, these two types are categorized into multiple types. A detailed classification of stroke is depicted in Figure 2. The major objective of this research is to classify ischemic and hemorrhagic strokes from computed tomography images. Earlier brain stroke classification is performed manually, and the time-consuming manual examination leads to errors at times, which affect patients. Image processing applications are developed using machine learning algorithms and provide excellent results for classifying brain strokes.
Traditional machine learning algorithms like SVM, random forest, DT algorithms are widely used for stroke classification. Also, the existing machine learning models struggle with scalability and fail to deliver reliable results due to inadequate feature processing. Due to this, ML models exhibit increased false-positive and false-negative rates. Furthermore, the manual annotation and traditional preprocessing methods which are used in ML based approaches are time consuming and prone to errors. This affects decision-making in clinical settings in real time environment. The classification accuracy of the existing methods can be improved if optimal features are selected for the classifier model. Thus, a hybrid classifier, H-StrokeNet is presented with an optimization model for optimal feature extraction and selection for brain stroke classification. To address these limitations a novel H-StrokeNet is proposed in this research work which is a hybrid architecture that combines feed-forward neural networks (FNN) and XGBoost along with the CSO algorithm. This integrated approach optimizes feature extraction and selection, reduces computational overhead, and improves classification accuracy. The CSO used in the proposed work reduces the inefficiencies of conventional methods and provides a robust and scalable framework for accurate and efficient stroke classification, which is suitable for real-time clinical applications.
The novelty of the H-StrokeNet approach presents its unique combination of FNN, XGBoost, and CSO. The proposed hybrid model overcomes limitations of traditional classification methods, which utilize simple machine learning or deep learning techniques. The proposed hybrid combination utilizes the strengths of each module to address the challenges of stroke classification. Specifically, the FNN used in the proposed work provides an effective mechanism for initial feature selection and hierarchical learning. Whereas XGBoost enhances classification accuracy through robust ensemble learning and prevents overfitting through regularization. Finally, the incorporation of CSO that utilizes swarm intelligence optimizes the feature selection process through the intelligent food-hiding and evasion behavior of crows. Optimization ensures a balanced exploration and exploitation of the search space. The proposed multi-layered design reduces computational complexity and enhances classification performance using fine-tuned features. This results in achieving superior accuracy and precision compared to conventional models.
Figure 1. Leading cause of death (2000-2019)
Figure 2. Stroke classification
The major contributions of this research work are summarized as follows:
•An optimized hybrid classifier H-StrokeNet is presented for classifying hemorrhage and ischemic stroke from brain images.
•Optimized H-StrokeNet is presented using feed forward neural network and XGBoost algorithms.
•Optimal feature extraction from brain images performed through swarm intelligence CSO algorithm. From the extracted features, the essential features are selected and classified through the H-StrokeNet.
•Comparative analysis with existing machine learning algorithms like SVM, DT, NB, kNN, and XGBoost algorithms is presented to validate the better performance of proposed optimized H-StrokeNet model.
The remaining discussions are presented in the following order. A brief study on recent research works for brain stroke classification is presented in Section 2. The proposed optimized H-StrokeNet is presented in Section 3. Experimental results and discussions are presented in Section 4. The conclusion is presented in the last section.
A brief literature review on different brain stroke classification models is presented in this section. A machine learning based stroke classification model is presented by Sirsat et al. [1] that classifies the abnormal brain tissues into partial anterior circulation syndrome, total anterior circulation stroke and lacunar syndrome from brain magnetic resonance imaging images. The presented classification model includes Delaunay triangulation and fractional order Darwinian particle swarm optimization algorithm for segmenting stroke lesions from brain MRI images. The experimentation model extracts the initial features using SVM and a random classifier and performs segmentation using the optimization model. Better classification results are attained by the presented model compared to conventional learning-based approaches. Similar model was presented by Bandi et al. [2] for brain stroke classification from MRI images using SVM and random forest algorithms. The presented approach performs classification with and without a feature selection model and evaluates the performances to validate the minimized computation complexity.
The machine learning based stroke prediction model presented by Ojaghihaghighi et al. [3] includes multiple machine learning algorithms that evaluate the performance based on the classification results. The study confirms that SVM and random forest algorithms provide better classification performances compared to other machine learning algorithms. Similar machine learning based stroke classification model presented by Karthik and Menaka [4] predicts the stroke risk factors from brain images through improvised random forest algorithm as an ensemble approach. Experimentation of standard brain stroke images validates that improved random forest algorithm provides better results than traditional machine learning algorithms.
Pre-diagnosis for stroke can reduce the chances for cerebrovascular accident death. The patients who have the possibility of having a stroke can have high chances for cerebrovascular accidents [5]. Thus, proper delineation of brain stroke lesions is necessary so that the parameters which have higher prevalence for stroke can be diagnosed in a better manner. Segmentation of stroke lesion provides the details of influenced tissues. The segmented results reduce the manual efforts and help physicians perform effective diagnosis so that better treatment can be provided. The limitations in manual lesion structure delineation are addressed by Subudhi et al. [6] and presented with an automatic model which effectively segments the abnormal structures from brain images. Discrete curvelet transformation is initially used to extract multi-scale features so that the features relevant to ischemic stroke can be extracted. Further the multiscale features are classified through radial basis kernel SVM to attain better segmentation performances.
The stroke detection model presented by Zhu et al. [7] addresses the limitation of electromagnetic imaging system and presents a graph degree mutual information model which differentiates the ischemic and hemorrhage stroke effectively. The experimental analysis considers the performance of graph degree mutual information model to demonstrate robustness. Initially the signals are converted into graphs with variable amplitudes and then the relationship between each pair of graphs are calculated based on mutual information. Finally, the information is classified through a SVM to detect the stroke type. Experimentation results provides that the graph model performs classification with minimum computation time compared to existing methodologies.
A weakly semi-supervised learning model is presented by Ghazali and Ramli [8] for stroke classification. The presented learning model incorporates an active learning procedure to select the least confident data and exclude it for classification process. Thus, the computation complexity is reduced, and classification accuracy is improved. Experimentation on high intensity transient signals provides better accuracy and sensitivity compared to existing approaches with reduced labeling cost. The stroke detection model presented by Jayachitra and Prasanth [9] incorporates optimized fuzzy model for detecting ischemic stroke lesions from MRI images. The presented approach performs segmentation using fuzzy approach and extracts the multi-textural features from the brain image. The extracted features are further classified through gaussian NB classifier and attained better classification accuracy and sensitivity.
The features of clustering process are incorporated by Guo et al. [10] with modified distorted born iterative method for brain stroke classification. The presented adaptive clustering model clusters the features in two-dimensional scenario and categorizes the stroke effectively compared to traditional distorted born iterative approach. An optimized clustering model presented by Dey and Rajinikanth [11] which incorporated k-means clustering and arithmetic optimization algorithms for better performances in stroke detection. The limitations in clustering-based segmentation are overcome by the presented optimized clustering model. Optimized cluster centroid initialization is performed through the arithmetic optimization model to attain better segmentation and classification results compared to traditional clustering-based approaches.
The stroke classification model presented by Thiyagarajan and Murugan [12] employs different thresholding approaches and compares the performances with machine learning approaches. Three machine learning algorithms are incorporated with machine learning algorithms and identifies that random forest with single step thresholding attain better performance over conventional thresholding models. Similar thresholding-based stroke classification model presented by Tomasetti et al. [13] incorporated distorted born iterative method to differentiate hemorrhagic and ischemic strokes. The presented approach detects and differentiates the stroke by mimic the brain tissues and reconstruct the dielectric properties. The measured and stimulated data are compared to distinguish the stroke targets effectively over traditional approaches.
The brain stroke classification model presented by Karadima et al. [14] developed a semantic segmentation guided detector network. The presented detector network includes performing initial segmentation using U-shaped model which utilizes diffusion weighted imaging process. Further, binary classification is performed using two stage deep learning models to differentiate the normal and stroke lesions from MRI images. The brain segmentation model presented by Lee et al. [15] differentiates different stroke affected regions by analyzing brain images using time efficient deep learning model. Experimentations confirmed the better performance of deep learning-based segmentation compared to traditional approaches.
The learning model-based stroke classification approach presented by Wei et al. [16] incorporated convolutional neural network for extracting stroke lesions from MRI images and employed VGG-UNet for segmentation. The classification model that combines machine learning and deep learning [17] algorithms attained better results compared to traditional methods. From the literature review, it is observed that machine learning algorithms are widely used for brain stroke classification. SVM and random forest algorithms are used in much research work. However, the classification performances can be improved further if the features are optimally selected through optimization algorithms. The computation complexity of classifiers can be reduced when the optimal features are provided for classification, and this will improve the classification accuracy. Thus, in this research work, an optimization algorithm is incorporated with a hybrid classifier for efficient detection of stroke from brain images.
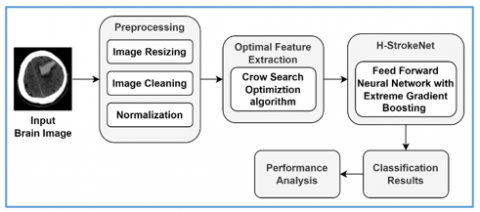
The proposed H-StrokeNet model for stroke classification incorporated a feed forward neural network architecture with XGBoost algorithm. In addition to that a swarm intelligence optimization algorithm CSO is employed for initial feature extraction from the input brain image. The input is a brain image which is initially preprocessed, and the steps included in the preprocessing are image resizing, image cleanup, and normalization. In the next step the optimal features are extracted from the preprocessed image using Crow Search Optimization (CSO). The extracted features are further fed into the H-StrokeNet which has feed forward neural network and XGBoost for feature selection and classification. The final classification results provide the details of stroke or normal output. An overview of proposed stroke classification model is presented in Figure 3.
Figure 3. Proposed stroke classification model overview
3.1 Preprocessing
The preprocessing step of proposed model includes image resizing where the unnecessary backgrounds are initially cropped, and the resizing is performed through resampling method. The resampling process initially selects a point and calculates the weighted average of its neighbors and assigns obtained values to the new pixels. Thus, all the input images are resized into 256×256. This resizing reduces the processing time. After image resizing, image cleanup is performed which removes the skull, extra tissues, and noise artifacts. Binary thresholding and masking are employed for image cleaning. Binary thresholding transforms the pixels values either 0 or 255. Anything below zero is changed into zero which indicates black and anything above 255 is converted into 255 which indicates white. Thus, the final output after thresholding will contain either black or white matter.
In the proposed model binary thresholding, the pixel which is smaller than 200 are converted into 0 and the pixel greater than 200 are converted into 255 for better presentation. The results of thresholding are used as mask to the original image so that the output after thresholding and masking will provide clear view of brain tissue on a black background.
After image cleaning, normalization is performed for transforming data attributes. Normalization is employed to balance the bright and dark tones in the image so that better contrast between health brain tissue and damaged area can be obtained. For normalization, all the image pixels are divided by 255 which converts the pixels the values [0,255] into [0,1]. Then mean and standard deviation of image is obtained for all the images. Further means are deducted from all the pixels and then divided by the standard deviation values. Finally, the image is again upscaled from [0,1] to [0,255]. Essential formulations for initial pre-processing are formulated as follows:
$Mean(\mu)=\frac{1}{N} \sum_{i=1}^N x_i$ (1)
$Standard \, Deviation(\sigma)=\sqrt{\frac{1}{N} \sum_{i=1}^N\left(x_i^2-\mu^2\right)}$ (2)
$Normalization(z)=\frac{x_i-\mu}{\sigma}$ (3)
where, the value of $i^{t h}$ pixel is indicated as $x_i$ and the total number of pixels is indicated as $N$. After initial preprocessing, the optimal features from the input are extracted using CSO.
3.2 Optimal feature extraction
CSO is a swarm intelligence optimization algorithm which is formulated based on crows hiding and food stealing behavior. Compared to other swarm intelligence algorithms, the CSO provides a better balance between exploration and exploitation. The selection of CSO over other optimization algorithms like Particle Swarm Optimization (PSO) or Genetic Algorithms (GA) is due to its unique capability in achieving a balanced exploration and exploitation of the search space which is essential for optimal feature selection in high-dimensional stroke classification tasks. Unlike PSO which mainly depends on acceleration coefficients to attain the global best solution, CSO utilizes randomized movement strategy, which provides better avoidance of local optima. Similarly, conventional GA highlights genetic operations like crossover and mutation but it lacks adaptability to refine solutions dynamically during search iterations. CSO, inspired by the intelligent food-hiding behavior of crows incorporates a probability mechanism which provides dynamic shifts between local and global search. This effectively reduces redundancy and improves search efficiency compared to other traditional optimization algorithms.
Crows are intelligent birds, and they can remember the human face and are able to warn when encountering danger. The clever characteristics of crows are their food hiding ability and location remembering skill. Crows will correctly reach the hidden food location, however in some cases, the other crows in the group follow each other to reveal the hiding place. If the crow identifies that it is being followed, then immediately it will change the food hiding place to avoid food theft. Based on this behavior the optimization algorithm is framed with the following principles. The first one considers all the crows as a social animal and the second one is crows can remember the hidden food location. The third one is crows follow each other for stealing food and the fourth one is crows do random movement to protect the hiding location to avoid food stealing. Consider N number of crows so that all the crows are initially considered as solution in the problem dimension d. The location of each crow i at iteration t is represented as a vector function which is formulated as
$c_i^t=\left[c_{i 1}^t, c_{i 2}^t, c_{i 3}^t, . . c_{i d}^t\right]$ for $i=1,2,3, \ldots, N$ (4)
where the possible location solution is indicated as $c_i^t$ for $i^{t h}$ crow in $d^{t h}$ dimension. In the food hiding and food stealing process, two conditions are used to explain crow behavior. In which in the first condition, if a crow wants to steal another crow food and the first crow (a) does not observe that second crow (b) is following, then the second crow will discover the first crow food hiding location and update its position as follows.
$c_b^{(t+1)}=\left(c_b^{(t)}+r_b\right) \times f_a^{(t)} \times\left(m_a^{(t)}-c_b^{(t)}\right)$ (5)
where the flight length is indicated as $f_a^{(t)}$ and $r_b$ represents a random number which is in the range $[0,1]$. In the second condition if the first crow (a) observed that second crow (b) is following to discover the food hiding location then, first crow (a) moves randomly which is formulated as:
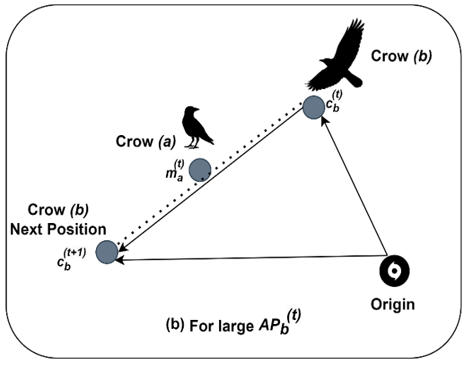
$c_b^{(t+1)}=\left\{\begin{aligned}\left(c_b^{(t)}+r_b\right) \times f_a^{(t)} \times\left(m_a^{(t)}-c_b^{(t)}\right) & \text { if } r_a \geq A P_b^{(t)} \\ \, select random position & Otherwise \end{aligned}\right.$ (6)
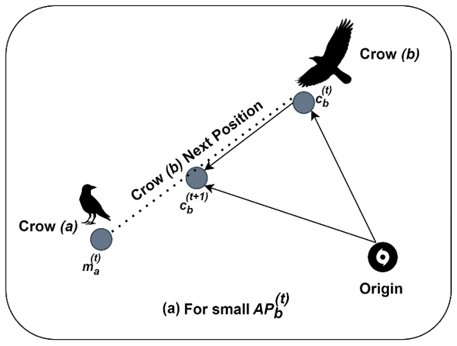
where the perception probability of first crow $(a)$ at iteration $t$ is represented as $A P_b^{(t)}$. The random number $r_b$ and $r_a$ ranges are given as $[0,1]$. The flight length $f_a^{(t)}$ defines the crow searching capability and high values of $f_a^{(t)}$ provides global search and low values of $f_a^{(t)}$ contributes local search process.
Figure 4(a) and (b) describe the importance of perception probability $A P_b^{(t)}$. In Figure 4(a) for smaller $A P_b^{(t)}$ the probability of occurrence for first condition defined in Eq. (5) is high so that the algorithm performs local search. In Figure 4(b) for larger $A P_b^{(t)}$ the probability of occurrence for second condition defined in Eq. (6) is high so that the algorithm performs global search. From this it can be observed that the flight length defines the search ability of the algorithm. Finally, the memory function of crow is updated as follows.
$m_b^{(t+1)}=\left\{\begin{array}{cl}\left(c_b^{(t+1)}\right) & \text { if } f\left(c_b^{(t+1)}\right) \geq f\left(c_b^{(t)}\right) \\ m_b^{(t)} & Otherwise \end{array}\right.$ (7)
where, $m_b^{(t)}$ indicates the crow memory at current iteration and $m_b^{(t+1)}$ indicates the crow memory at next iteration. This update process is repeated until the termination criterion is reached. From the optimal features extracted through CSO algorithm, the essential features are selected and classified through H-StrokeNet.
Figure 4. CSO
3.3 Optimized H-StrokeNet
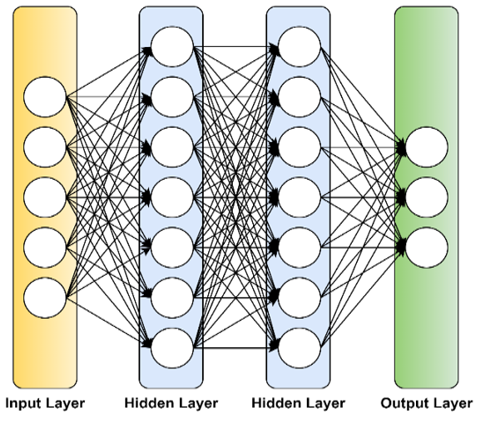
The architecture of H-StrokeNet includes a feed forward neural network and an XGBoost algorithm. The initial feature selection is performed through feed forward neural network and classified through XGBoost algorithm. The feed forward network has various information processing units which are artificial neurons, and it is organized as layers so that sequential information processing is performed in the network model. In the architecture, the output layer is replaced with XGBoost block to obtain the final classification results. The neural network with a linear transfer function can be mathematically expressed as a linear regression model to predict the output as follows.
$f(x, w)=\sum_{i=1}^m x_i w_i+w_0$ (8)
where weights are represented as $w_i$ and bias factors are represented as $w_0$. The input vector $x=\left(x_1, x_2, \ldots, x_m\right)$ is fed into the input layer and the neuron $i$ is given an activation equal to $x_i$.The activation is propagated through the hidden layer and finally to the output layer. The number of neurons in the output layer corresponds to dimension of output vector. This procedure is termed as forward pass so that the network is termed as feed forward network. Further for $\tilde{x}=$ $\left(x_1, x_2, \ldots, x_m\right)^T$ the condensed form of output model is obtained as:
$f(x, w)=\tilde{x}^T w$ (9)
with a nonlinear activation function $h$ and $H$ hidden neurons, the activation of $k^{t h}$ output neuron is formulated as:
$f_k(x, w)=h^{(2)}\left\{\sum_{j=1}^H w_{k j}^{(2)} h^{(1)}\left(\tilde{x}^T w_j^{(1)}\right)\right\}$ (10)
where weight matrix is represented as $w_{k j}^{(2)}$ which includes weight factors for hidden neuron and output neuron. Different activations function like hyperbolic tangent, logistic sigmoid, and rectified linear unit can be used. Figure 5 depicts a simple illustration of feed forward neural network with two hidden layers.
Figure 5. FNN with two hidden layers
Further the features selected through the feed forward network are classified through XGBoost (XGBoost) algorithm. XGBoost is an efficient and flexible which supports both classification and regression operations. XGBoost has decision rules like decision trees, however it is more efficient than DTs. XGBoost is developed based on gradient boosting machine, in which the final learning weights are smoothened, and overfitting is avoided by adding a loss function as a regularization term. Using first and second order statistics the loss function is optimized in XGBoost which prevents overfitting. Compared to conventional gradient boosting, XGBoost performs better due to parallel and distributed computation. Thus, XGBoost is incorporated with feed forward neural network as a hybrid model to attain better classification performances in the proposed stroke classification process. For the given data $D=\left\{x_i, y_i\right\}$ with m features XGBoost use $k$ additive functions to predict the output values of tree ensemble model. mathematically the process is formulated as:
$\hat{y}_i=\sum_{k=1}^K f_k\left(x_i\right)$ where $f_k \in F$ (11)
where regression tree space is represented as F and it is mathematically expressed as:
$F=\left\{f(x)=w_q(x)\right\}$ where $\left(q: R^m \rightarrow T, w_q \in R^T\right)$ (12)
where each tree structure is represented as $q$ and the leaves in the tree are represented as $T$. The function $f_k$ indicates the independent tree structure and weights $w$. The objective function to reduce errors of ensemble trees in XGBoost is formulated as:
$L^{(t)}=\sum_{i=1}^n l\left(\left(y_i, \hat{y}_j^{(t-1)}\right)+f_t\left(x_i\right)\right)+\varphi\left(f_k\right)$ (13)
where the calculated error between measured and predicted values is represented as an objective function $l . y_i$ indicates the regulated values, and $\hat{y}_i$ indicates the predicted values. The complexity penalized with ' $r$ ' the regression tree function is represented as $\varphi$ which is mathematically expressed as:
$\varphi\left(f_k\right)=\gamma T+\frac{1}{2} \lambda\|\omega\|^2$ (14)
where, $\omega$ is the weight function, $\gamma$ indicates the minimal loss, regularization function is represented as $\lambda$. These loss and regularization functions are used to control the tree complexity and avoid overfitting by smoothening the final weights. Further to simplify the objective function of XGBoost, Taylor expansion is applied, and it is mathematically expressed as:
$F=\sum_{i=1}^m\left[f_t\left(x_i\right) g_i+\frac{1}{2}\left(f_t\left(x_i\right)\right)^2 h_i\right]+\gamma T+\frac{1}{2} \lambda \sum_{i=1}^T \omega_j^2$ (15)
where the first and second order derivatives on the loss function are represented as $g_i$ and $h_i$ respectively. Thus, by optimizing the loss function, XGBoost minimizes the loss and attains better classification performance compared to other ensemble methods. The results of the ensemble model provide the details of the stroke. Summarized pseudocode for the proposed stroke classification model is presented as follows.
|
Pseudo Code for the proposed H-StrokeNet |
|
Input: Brain CT Image, Output: Stroke classification |
|
Initialize optimization model parameters, neural network and boosting model parameters |
|
Initialize crow location, perception probability $A P_b^{(t)}$, flight length $f_a^{(t)}, r_a, r_b$ number of neurons, activation function, hidden neurons |
|
Begin |
|
Initialize preprocessing |
|
Resize input using resampling |
|
Perform image cleaning through thresholding |
|
Calculate mean as per Eq. (1) |
|
Calculate standard deviation as per Eq. (2) |
|
Normalize the input image as per Eq. (3) |
|
end preprocessing |
|
Initialize SCO, N crows in d dimensional space |
|
Select the crow location $c_i^t$ as per Eq. (4) |
|
Begin case 1: if the first crow (a) does not observe that second crow (b) |
|
then $c_b^{(t+1)}=\left(c_b^{(t)}+r_b\right) \times f_a^{(t)} \times\left(m_a^{(t)}-c_b^{(t)}\right)$ |
|
else |
|
$c_b^{(t+1)}=\left\{\begin{array}{cc}\left(c_b^{(t)}+r_b\right) \times f_a^{(t)} \times\left(m_a^{(t)}-c_b^{(t)}\right) & \text { if } r_a \geq A P_b^{(t)} \\ select random position & Otherwise \end{array}\right.$ |
|
Update crow memory $m_b^{(t+1)}$ as per Eq. (7) |
|
end optimization |
|
Initialize network model |
|
Obtain neural network linear transfer function as per Eq. (8) |
|
Obtain a condensed form of output as per Eq. (9) |
|
Calculate output neuron as per Eq. (10) |
|
Define regression tree space $F=\left\{f(x)=w_q(x)\right\}$ |
|
Predict output using gradient boosting as per equation (11) |
|
Calculate regression tree function $\varphi\left(f_k\right)=\gamma T+\frac{1}{2} \lambda\|\omega\|^2$ |
|
Obtain loss function $L^{(t)}$ as per Eq. (13) |
|
Obtain the loss function as first and second order derivatives as per Eq. (15) |
|
End classification |
|
End all |
The proposed optimized H-StrokeNet model performance is verified through simulation analysis, and this section presents a detailed discussion on experimentation and results. The experimentation is done using the Python tool, and the essential packages to perform preprocessing, optimization, classification are included. Experimentations are done on a personal computer which has an Intel i5 processor, 16GB of memory and NVIDIA GeForce GPU. The operating system is Windows 11. For initial preprocessing, OpenCV and NumPy library packages are included. Using the resize function in OpenCV, the input images are resized, and the stroke images are categorized into a separate array using the Numpy array function. For modeling neural networks and boosting algorithms, Tensorflow is imported into the package. For the optimization model, the pyMetaheuristic library function is included, which covers a wide range of swarm intelligence algorithms.
Experimentations are performed using LAPISCO dataset, which has ischemic, hemorrhagic, and healthy brains CT images. The data is collected from more than 25 patients, and a total of 446 slices of horizontal cross section images are present in the dataset. Specifically, 142 slices for hemorrhagic, 157 for ischemic and 147 healthy slices. Though the proposed model experimentation dataset, which has only 446 CT images, challenges overfitting, generalize to unseen data are reduced by implementing data preprocessing procedures like normalization and thresholding. This ensures that the proposed model processes high-quality input and reduces noise while performing the successive tasks. Additionally, the dataset was balanced across hemorrhagic, ischemic, and normal cases, which minimize class imbalance issues.
For experimentation, the entire dataset is divided into 80:20 for training and testing, and the experimentations are repeated for 10 trials with different inputs. The use of an 80:20 train-test split, along with 10 repeated trials provided a strong validation to evaluate the proposed model stability. Furthermore, the hybrid architecture of H-StrokeNet, combining feed-forward neural networks, XGBoost, and CSO, enhances the model capacity to learn generalized patterns from limited data. While these strategies improve reliability and applicability in real-world clinical analysis. The hyper parameters used in the simulation analysis are listed in Table 1 and Table 2 depicts the details of training and test data used for experimentation.
The preprocessing stage in the proposed model ensures that high-quality input data is processed by the classifier. The proposed model employed binary thresholding and normalization techniques in the preprocessing stage. During binary thresholding the pixel values below 200 are converted to 0 which represents black color. Whereas the pixel value above 200 are converted to 255 represents the white. This thresholding separates the brain tissue from surrounding noise and irrelevant details which results in a clear binary image with only black and white regions. The output after thresholding acts as a mask and highlights the critical areas of the brain for subsequent analysis. Normalization in the proposed model preprocessing balances the pixel intensity distribution and improves contrast between normal and affected regions. All pixel values are initially scaled from the range [0, 255] to [0, 1] by dividing by 255. The mean and standard deviation of the image are calculated with the mean subtracted from each pixel value and divided by the standard deviation. This process ensures uniformity and enables better feature extraction. Finally, the normalized pixel values are rescaled back to [0, 255]. This optimizes the images for further processing in the H-StrokeNet architecture. These preprocessing steps collectively reduce noise and improve the model's classification accuracy.
Table 1. Hyperparameter details
|
S. No |
Description |
Range/Value |
|
1 |
Perception Probability |
0.1 |
|
2 |
Flight Length |
2 |
|
3 |
$r_a, r_b$ |
[0.1] |
|
4 |
Number of hidden states |
2 |
|
5 |
Hidden layer activation function |
Sigmoid |
|
6 |
Hidden neuron weights |
0.7 |
|
7 |
Neural Network Learning rate |
0.01 |
|
8 |
XGBoost Number of trees |
100 |
|
9 |
XGBoost γ and λ |
1 |
|
10 |
XGBoost Learning Rate |
0.1 |
Table 2. Data samples used for training and testing
|
S. No. |
Type |
Training Images |
Testing Images |
Total |
|
1 |
Hemorrhagic |
114 |
28 |
142 |
|
2 |
Ischemic |
126 |
31 |
157 |
|
3 |
Normal |
118 |
29 |
147 |
|
Total |
446 |
|||
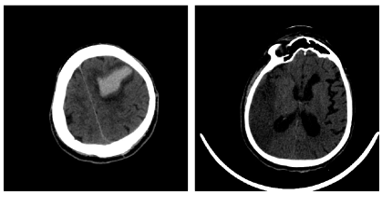
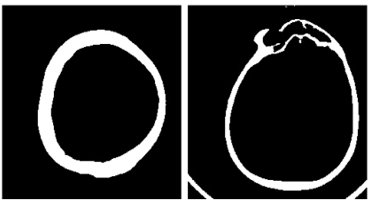
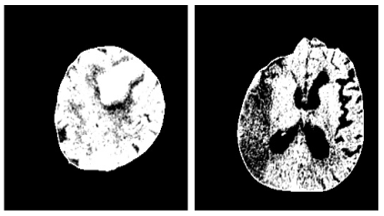
Figure 6 depicts the image samples from the dataset for Hemorrhagic and Ischemic Brain Stroke. In Figure 6, the left side image represents the Hemorrhagic stroke brain image and right-side image represents the Ischemic Brain Stroke. Figure 7 depicts the results after thresholding process and Figure 8 depicts the results after normalization. Performance metrics like recall, precision, f1-score, loss and accuracy are considered to evaluate the proposed model. The performance obtained by the proposed model for 10 trials is presented in Table 3.
Figure 6. Input images from dataset
Figure 7. Images after thresholding
Figure 8. Images after normalization
Table 3. Proposed model performance metrics
|
Trial |
Accuracy |
Precision |
Recall |
F1-Score |
Loss |
|
1 |
0.964 |
0.924 |
0.975 |
0.949 |
0.04 |
|
2 |
0.966 |
0.948 |
0.978 |
0.963 |
0.16 |
|
3 |
0.965 |
0.946 |
0.975 |
0.960 |
0.08 |
|
4 |
0.967 |
0.948 |
0.976 |
0.962 |
0.12 |
|
5 |
0.964 |
0.946 |
0.982 |
0.964 |
0.16 |
|
6 |
0.967 |
0.944 |
0.976 |
0.960 |
0.28 |
|
7 |
0.967 |
0.948 |
0.978 |
0.963 |
0.16 |
|
8 |
0.964 |
0.946 |
0.974 |
0.960 |
0.19 |
|
9 |
0.965 |
0.948 |
0.976 |
0.962 |
0.28 |
|
10 |
0.966 |
0.948 |
0.978 |
0.963 |
0.24 |
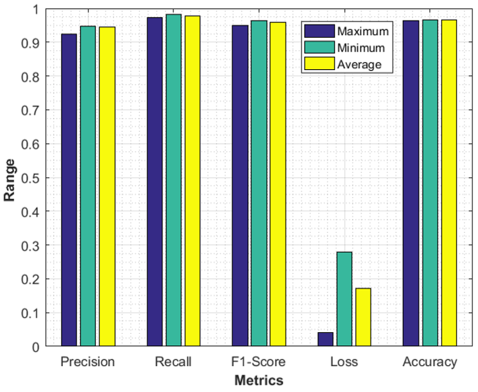
The average, minimum and maximum values for all the metrics are graphically represented in Figure 9. The minimum and maximum precision attained by the proposed model is 0.924 and 0.948 respectively. The average precision obtained by the proposed model is 0.945. The minimum, maximum and average recall values obtained by the proposed model are 0.974, 0.982 and 0.977, respectively. The minimum, maximum and average f1-scores obtained by the proposed model are 0.949, 0.964 and 0.960 respectively. The minimum, maximum and average loss obtained by the proposed model is 0.040, 0.280 and 0.171 respectively. The minimum, maximum and average accuracy values obtained by the proposed model are 0.964, 0.967 and 0.966 respectively.
Figure 9. Proposed model performance analysis
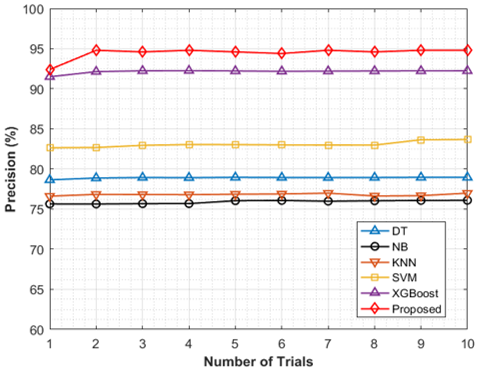
Figure 10. Precision comparative analysis
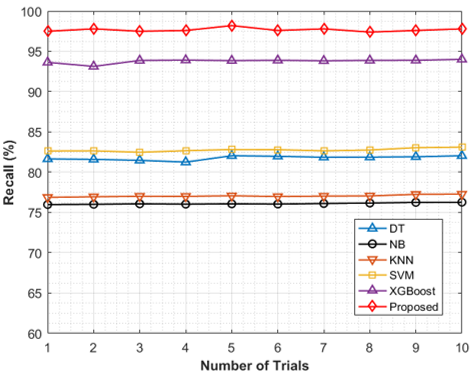
Figure 11. Recall comparative analysis
The proposed model performance metrics are compared with traditional machine learning algorithms like SVM [18], DT [19], NB [20], kNN, and XGBoost algorithms. The initial preprocessed steps followed for the proposed model are used for the machine learning algorithms. The classification model performances are obtained for 10 trials like the proposed model and the results are used for comparative analysis. Figure 10 depicts the precision comparative analysis, and it is observed from the results that the precision obtained by the proposed model is maximum in all trials compared to traditional machine learning algorithms. The average precision obtained by the proposed model after 10 trials is 94.46% whereas the conventional methods DT attains 78.91%, NB attains 75.9%, K-NN attains 76.81%, SVM attains 83.07% and XGBoost attains 92.14% which is lower than the proposed model. Figure 11 depicts the recall comparative analysis.
Figure 12. F1-Score comparative analysis
It is observed from Figure 11 that the recall value obtained by the proposed model is maximum in all trials compared to traditional machine learning algorithms. The average recall obtained by the proposed model after 10 trials is 97.68% whereas the conventional methods DT attains 81.77%, NB attains 76.11%, K-NN attains 77.06%, SVM attains 82.77% and XGBoost attains 93.8% which is lower than the proposed model. Figure 12 depicts the F1-score comparative analysis, and it is observed from the results that the F1-score obtained by the proposed model is maximum compared to conventional algorithms. The average F1-score obtained by the proposed model after 10 trials is 96.04% whereas the conventional methods DT attains 80.31%, NB attains 76%, K-NN attains 76.94%, SVM attains 82.92% and XGBoost attains 92.96% which is lower than the proposed model.
Figure 13. Accuracy comparative analysis
The accuracy metric comparative analysis is presented in Figure 13. The given accuracy graph highlights the consistent and superior performance of the proposed H-StrokeNet model compared to traditional algorithms DT, NB, KNN, SVM, and XGBoost, across 10 trials. The proposed model achieves an average accuracy of 96.55%, with individual trial accuracies ranging from 96.4% to 96.7%, which indicates the model stability and reliability. In comparison, the existing XGBoost model performs better and attains an average accuracy of 92.1%. However, the attained accuracy is 4.4% lower than the proposed method. Other traditional algorithms exhibit less performance compared to the proposed specifically DT attains an average accuracy of 80.57%, SVM attains an average accuracy of 81.98%, NB attains an average accuracy of 76.64%, and KNN attains an average accuracy of 74.97%. The reduced performance of these methods is due to the ability in handling high-dimensional feature spaces and lack of advanced optimization mechanisms. The consistent accuracy of H-StrokeNet across all trials demonstrates its robustness in processing noisy and complex data. By integrating advanced preprocessing techniques, optimal feature selection, and a hybrid architecture, the proposed model achieves both scalability and adaptability compared to existing methods.
Table 4 depicts the overall comparative analysis of the proposed model and conventional machine learning models metrics. The average values obtained for all the models are comparatively presented to validate the better performance of the proposed model.
From the comparative analysis presented in Table 4, it is observed that proposed model exhibits maximum classification accuracy compared to conventional methods. Thus, the presented optimized H-StrokeNet effectively classifies the normal and stroke brain inputs. The existing algorithms exhibit less performance due to various limitations. Specifically, DT, NB, and KNN are less effective in handling complex feature relations and high-dimensional data. This leads to suboptimal feature selection which results in increased errors. Whereas SVM struggles with scalability and requires careful hyperparameter tuning. Also, it may not adapt well to dynamic datasets like brain CT scans. Though the traditional XGBoost exhibits better performance, it lacks an integrated optimization mechanism provided by CSO. However, in the proposed H-StrokeNet, a better balance between exploration and exploitation in the feature space is provided, which improves the overall performance. Moreover, the performance advantage of the proposed model over existing algorithms is primarily due to its hybrid architecture, which combines FNN with XGBoost and integrates CSO for feature selection. The feed-forward neural network effectively captures hierarchical relationships among features, while XGBoost enhances classification by utilizing robust ensemble learning and overfitting prevention. The incorporation of CSO further refines the feature selection process and ensures that only the most relevant features are used for the classification.
The proposed model performance metrics validate its interpretability and reliability. Achieving an average accuracy of 96.55% and a precision of 94.46% across 10 trials demonstrates the proposed model ability to generalize across varied data. The high recall value of 97.68% reflects the model’s sensitivity in detecting stroke lesions and reducing the chances of misclassification. These results indicate that the preprocessing steps effectively direct the model to focus on relevant regions which leads to accurate and clinically meaningful outputs. Together, proposed model outputs and robust performance metrics provide assurance that the model not only achieves high accuracy but aligns with clinical expectations. This makes the proposed model more interpretable and suitable for real-world applications.
Table 4. Comparative analysis
|
S. No |
Algorithms |
Precision |
Recall |
F1-Score |
Accuracy |
|
1 |
DT |
78.908 |
81.773 |
80.31479 |
80.578 |
|
2 |
NB |
75.9 |
76.11 |
76.00479 |
76.636 |
|
3 |
KNN |
76.813 |
77.058 |
76.93523 |
74.973 |
|
4 |
SVM |
83.068 |
82.767 |
82.91711 |
81.98 |
|
5 |
XGBoost |
92.143 |
93.799 |
92.96344 |
92.088 |
|
6 |
Proposed |
94.46 |
97.68 |
96.04181 |
96.55 |
This research work presents an optimized hybrid classifier H-StrokeNet for brain stroke classification. The proposed optimized H-StrokeNet is obtained by combining feed forward neural network and XGBoost algorithm. To reduce the computation complexity of classifier and to provide optimal feature for classifier model, swarm intelligence CSO is employed in the proposed work. The optimal features from the input are extracted using CSO and the essential feature to classify normal and stroke is performed by the H-StrokeNet model. Experimentations on standard brain stroke dataset presents the maximum performance of proposed model in terms of recall, precision, F1-score, and accuracy compared to conventional machine learning algorithms like DT, SVM, NB, k-NN, and gradient boosting algorithms. Further the proposed model can be extended by incorporating hybrid deep learning models for better enhancement in classification accuracy.
[1] Sirsat, M.S., Fermé, E., Camara, J. (2020). Machine learning for brain stroke: A review. Journal of Stroke and Cerebrovascular Diseases, 29(10): 105162. https://doi.org/10.1016/j.jstrokecerebrovasdis.2020.105162
[2] Bandi, V., Bhattacharyya, D., Midhunchakkravarthy, D. (2020). Prediction of brain stroke severity using machine learning. Revue d'Intelligence Artificielle, 34(6): 753-761. https://doi.org/10.18280/ria.340609
[3] Ojaghihaghighi, S., Vahdati, S.S., Mikaeilpour, A., Ramouz, A. (2017). Comparison of neurological clinical manifestation in patients with hemorrhagic and ischemic stroke. World Journal of Emergency Medicine, 8(1): 34-38. https://doi.org/10.5847/wjem.j.1920-8642.2017.01.006
[4] Karthik, R., Menaka, R. (2017). A multi-scale approach for detection of ischemic stroke from brain MR images using discrete curvelet transformation. Measurement, 100: 223-232. https://doi.org/10.1016/j.measurement.2017.01.001
[5] Ortiz-Ramón, R., Hernández, M.D.C.V., González-Castro, V., Makin, S., Armitage, P.A., Aribisala, B.S., Bastin, M.E., Deary, I.J., Wardlaw, J.M., Moratal, D. (2019). Identification of the presence of ischaemic stroke lesions by means of texture analysis on brain magnetic resonance images. Computerized Medical Imaging and Graphics, 74: 12-24. https://doi.org/10.1016/j.compmedimag.2019.02.006
[6] Subudhi, A., Acharya, U.R., Dash, M., Jena, S., Sabut, S. (2018). Automated approach for detection of ischemic stroke using delaunay triangulation in brain MRI images. Computers in Biology and Medicine, 103: 116-129. https://doi.org/10.1016/j.compbiomed.2018.10.016
[7] Zhu, G., Bialkowski, A., Guo, L., Mohammed, B., Abbosh, A. (2020). Stroke classification in simulated electromagnetic imaging using graph approaches. IEEE Journal of Electromagnetics, RF and Microwaves in Medicine and Biology, 5(1): 46-53. https://doi.org/10.1109/JERM.2020.2995329
[8] Ghazali, N., Ramli, D.A. (2021). Weakly semi-supervised classification of transcranial doppler ultrasound signal for ischemic stroke detection. Procedia Computer Science, 192: 3895-3904. https://doi.org/10.1016/j.procs.2021.09.164
[9] Jayachitra, S., Prasanth, A. (2021). Multi-feature analysis for automated brain stroke classification using weighted Gaussian naïve Bayes classifier. Journal of Circuits, Systems and Computers, 30(10): 2150178. https://doi.org/10.1142/S0218126621501784
[10] Guo, L., Khosravi-Farsani, M., Stancombe, A., Bialkowski, K., Abbosh, A. (2021). Adaptive clustering distorted born iterative method for microwave brain tomography with stroke detection and classification. IEEE Transactions on Biomedical Engineering, 69(4): 1512-1523. https://doi.org/10.1109/TBME.2021.3122113
[11] Dey, N., Rajinikanth, V. (2022). Automated detection of ischemic stroke with brain MRI using machine learning and deep learning features. Magnetic Resonance Imaging, 2022: 147-174. https://doi.org/10.1016/B978-0-12-823401-3.00004-3
[12] Thiyagarajan, S.K, Murugan, K. (2023). Arithmetic optimization-based K means algorithm for segmentation of ischemic stroke lesion. Soft Computing. https://doi.org/10.1007/s00500-023-08225-6
[13] Tomasetti, L., Høllesli, L.J., Engan, K., Kurz, K.D., Kurz, M.W., Khanmohammadi, M. (2021). Machine learning algorithms versus thresholding to segment ischemic regions in patients with acute ischemic stroke. IEEE Journal of Biomedical and Health Informatics, 26(2): 660-672. https://doi.org/10.1109/JBHI.2021.3097591
[14] Karadima, O., Lu, P., Sotiriou, I., Kosmas, P. (2022). Experimental validation of the DBIM-TwIST algorithm for brain stroke detection and differentiation using a multi-layered anatomically complex head phantom. IEEE Open Journal of Antennas and Propagation, 3: 274-286. https://doi.org/10.1109/OJAP.2022.3150100
[15] Lee, J., Lee, M., Lee, J., Kim, R.E., Lim, S.H., Kim, D. (2023). Fine-grained brain tissue segmentation for brain modeling of stroke patients. Computers in Biology and Medicine, 153: 106472. https://doi.org/10.1016/j.compbiomed.2022.106472
[16] Wei, Y.C., Huang, W.Y., Jian, C.Y., Hsu, C.C.H., et al. (2022). Semantic segmentation guided detector for segmentation, classification, and lesion mapping of acute ischemic stroke in MRI images. NeuroImage: Clinical, 35: 103044. https://doi.org/10.1016/j.nicl.2022.103044
[17] Moulaei, K., Afshari, L., Moulaei, R., Sabet, B., Mousavi, S.M., Afrash, M.R. (2024). Explainable artificial intelligence for stroke prediction through comparison of deep learning and machine learning frameworks, Scientific Reports, 14: 31392. https://doi.org/10.1038/s41598-024-82931-5
[18] Ganesh, B.J., Vijayan, P., Vaidehi, V., Murugan, S., Meenakshi, R., Rajmohan, M. (2024). SVM-based Predictive Modeling of Drowsiness in Hospital Staff for Occupational Safety Solution via IoT Infrastructure, International Conference on Computer, Communication and Control, Indore, India, pp. 1-5. https://doi.org/10.1109/IC457434.2024.10486429
[19] Machap, K., Narani, S.R. (2024). IoT audio sensor networks and decision trees for enhanced rain sound classification. International Journal of Advances in Signal and Image Sciences, 10(1): 35-44. https://doi.org/10.29284/ijasis.10.1.2024.35-44
[20] Sekar, S., Parvathy, P.R., Gupta, G.K., Rajagopalan, T., Basavaraddi, C.C.S.C.B., Padmanaban, K., Murugan, S. (2025). Intrusion detection and prevention using Bayesian decision with fuzzy logic system. International Journal of Electrical and Computer Engineering, 15(1): 1200-1208. http://doi.org/10.11591/ijece.v15i1.pp1200-1208