Alvin A. Ancy*![]() | Suresh Ponnan
| Suresh Ponnan![]() | Ajith T. Bosco Raj
| Ajith T. Bosco Raj![]()
© 2025 The authors. This article is published by IIETA and is licensed under the CC BY 4.0 license (http://creativecommons.org/licenses/by/4.0/).
OPEN ACCESS
The COVID-19 virus brought huge changes all over the globe. Several works focused on classifying Lung disorders (Lung cancer, Pneumonia, COVID-19, and Healthy) images, but their proposed techniques did not achieve better accuracy. The main goal is to identify it at an early stage. The proposed work is to distinguish the types of lung disease, either in benign or malignant phase, and help to expert the radiologists in patient care. To classify lung disorder in stages, whether it is benign or malignant, a new technique known as ResVGG19 is employed for image analysis on CT scans of lungs. This finding comes with the help of Tensor Flow assistance in developing the simulation outcomes. Hence, obtain ResVGG19 classifier accuracy at 97.6% has surpassed both ResNet50 and U-Net. The experimental results verify that the suggested model has outperformed all other learning models, including ResNet50, U-Net, and VGG-Net. ResVGG19-Net produced results of 97.6% accuracy, 92% precision, 91% recall, and 91.3% F1-score when accuracy, precision, and recall were taken into account. The performance of ResVGG19-Net is superior to that of the state-of-the-art.
image processing, CNN model, early detection, COVID-19, ResVGG19, model comparison
Lung-related diseases, including coronavirus, flu, pneumonia, and lung cancer, are health concerns worldwide. Effective therapy and desirable patient outcomes both require timely diagnosis [1]. As AI develops and medical imaging continues to improve, algorithms are now available to detect and stage these diseases.
In Wuhan, China, in year of 2019, a brand-new coronavirus (COVID-19) was found. This can be a brand-new coronavirus that has never been found in people [2]. When this study was released, the infectious disease was still having an impact on the world, and past tendencies indicated that it might not be the last [3]. Artificial intelligence has been utilized to computerize the determination of various illnesses. Through different machine learning strategies, AI has illustrated its adequacy and high performance in programmed picture classification challenges [4]. Moreover, machine learning portrays models that will learn from and choose based on many cases within the input information. Deep learning (DL) is a widely used method for building systems that can precisely anticipate higher-order frameworks and perform as well as people. For the segmentation of medical images using deep learning (DL), tumors have been primary targets [5].
The work introduces a sophisticated CNN model with assigned prior and self-scan for the algorithmic analysis of the coronavirus. Especially, ResNet50 and ResVGG19 architectures were used in the model since the prediction of results was done from datasets. The study's main contribution is:
i) When applied to lung CT images, the widely used pre-processing methods, such as the median filter, Gaussian filter, and Gabor filter distort edges and boundaries and are incredibly laborious. Consequently, the proposed study employs Data Augmentation with Adaptive Histogram Equalization (DAAHE), which eliminates the previously described problems and enhances performance.
ii) Many segmentation methods found in literature need to determine the number of statistical predicates, or clusters, which adds to their processing time. Without the use of any statistical data, the suggested segmentation technique finds the lung disorder with efficiency. The research employs Region Proposal Network (RPN) and Bounding Box regression methods to isolate the lung disorder location.
iii) When applied to CT images of the lungs, classification techniques like CNN, Resnet50, U-Net and VGG are found to be more computationally intensive and do not yield the desired level of accuracy. Hence, a brand-new hybrid ResVGG19 learning technique is proposed in this research study to immensely enhance the execution time and decreases the false positives while increasing the classification distinction.
iv) The techniques proposed ResVGG19 classifier to differentiate the lung disorder as benign or malignant to get better classification compared to other classification methods.
v) To demonstrate the effectiveness of the suggested method, a detailed evaluation is conducted that compares the segmentation and classification cases with a variety of performance metrics.
The organization of the paper is as follows: In Section 2, a number of research publications pertaining to the various segmentation and classification techniques applied to lung CT images are specifically analyzed. Section 3 formulates the problem description and provides the key information for the suggested system. In the fourth portion of this study, the simulation results are analyzed and discussed. portion 5 presents the last portion, in which the author summarizes the entire book.
Researchers within the field of computer vision have been utilizing different innovations to focus on early infection recognizable proof from the begin of this pandemic. Among the world's top causes of cancer-related mortality is still lung cancer. Since the disease frequently shows no symptoms until it has progressed, early detection is essential to increasing survival rates. Lung cancer diagnosis with low-dose computed tomography (LDCT) is a very successful technology nowadays. When combined with artificial intelligence (AI) techniques, LDCT can thereby significantly improve the accuracy and logic of early lung cancer detection [6].
According to Budati and Karumuri [7], an ideal lung nodule segmentation has proposed a scalable intelligent segmentation framework composed of several component parts, which were fine tuned to get better outcomes. Regarding the division of lung nodules from CT images the system utilizes the control of diverse profound neural systems (DNNs) for computerized, correct separation. Our suggested UDCT framework enhances the neural network's detection and classification skills by fusing the segmentation power of U-Net with the architectural discovery power of DARTS. Mammeri et al. use the most recent developments in deep learning, particularly YOLO v7 (You Only Look Once version 7), and transfer learning approaches to meet the urgent need for early identification and diagnosis of lung disorders. In order to improve patient outcomes, lung disorders require effective and precise diagnostic methods because of their high frequency and death rate [8].
Muhtasim et al. [9] illustrate the adequacy of combining exchange learning with morphological highlights for the location of lung cancer. This approach leverages the qualities of both profound learning and conventional include extraction strategies, coming about in progressed discovery exactness. Sudha and Uma Maheswari effectively illustrate the potential of a half breed molecule wind swarm optimization combined with an optimized Veil R-CNN for programmed lung cancer discovery. The proposed approach accomplished a greatest exactness of 96.67% [10].
Saha et al. [11] effectively illustrates the potential of VER-Net, a crossover exchange learning show, for exact and proficient lung cancer location. VER-Net performed well on tests of precision, accuracy, review, and F1-score, scoring 91%, 92%, 91%, and 91.3%, in that arrange. In the following investigations, we look at the benefits and disadvantages of leveraging both ML and DL-based models towards solving the widespread COVID-19 problem. Information on the strategies for carrying out the search for COVID-19 is provided in detail in this distribution [12].
To attempt to contain the virus, a CronaSona app was created. For all users, but particularly for COVID-19 patients and physicians, it is a responsive mobile application. By employing deep learning techniques, it seeks to provide a dependable COVID-19 diagnostic tool, expediting the diagnosis and referral processes, and concentrating on COVID-19 transmission predictions. With consecutive results of 97%, 97.6%, and 96.6%, it exhibits the best accuracy, F1-score, and precision [13]. By monitoring and evaluating COVID-19 using a deep learning method, radiologists and specialists can enhance prognosis execution. The most popular use of deep learning methods for COVID-19 identification is on X-ray images. This method produced a higher frequency of findings than the study on the benchmark dataset, with 95.86% accuracy and 95.9% recall, utilizing a deep learning example employing VGG-16 [14]. Further, with the implemented threshold segmentation technique rightly in the designed deep learning model, the X-ray images are preprocessed to yield efficient features [15]. Then, YOLOv3 detector is utilized to detect normal and pneumonia-infected individuals from those images, and SVM or Softmax can be employed to classify the individuals into either normal or pneumonia. According to the research study, the suggested system's overall F1-score, recall, accuracy, and precision are 99%. ResNet has a specific attention mechanism for features crucial to pneumonia detection.
An exhaustive analysis yields 96% accuracy in pneumonia identification, indicating that our attention method improves pneumonia detection accuracy greatly [16].
Masked neural network (MNN) is trained on pre-processed data. The last layer of the MNN is mined for the most important features, and the chest X-rays are then classified using the K-nearest neighbor (KNN) algorithm to identify pneumonia. In order to train a model with minimal losses and 98.07% accuracy, this work created classifiers, dropout regularization, and mask generating techniques [17]. The real-time polymerase chain reaction (RT-PCR) test is frequently used to accurately confirm coronavirus. The main drawback of RT-PCR is that, in addition to having a high false-negative rate of detection, the technique can be costly and time-consuming. Additionally, we classified three type of lung diseases in three ways using CP_DeepNet [18]. F1-score, exactness, exactness, review, specificity, range beneath the bend, and precision were all achieved by CP_DeepNet, with scores of 99.62%, 99.79%, 99.52%, 99.69, 99.62, and 99.72%, separately.
For the reason of classifying the COVID-19 confirmed patient's lung aggravation degree (mellow, advancing, or serious), we have made a counterfeit insights motor. When compared to existing classification calculations, the comes about illustrates that the CNN show can accomplish testing precision of up to 95.65%. For the relatively large dataset, the enhanced CNN achieved 92.80% testing accuracy for screening pneumonia in the chests’ X-ray images. It consists features extraction, reliable and adaptive ROI estimation, dataset acquiring, image quality improvement and particularly illness prediction [19].
For better classification of the lung CT images of cancer patients, the proposed system employs a ResVGG-19 classifier, which is completely unique in the existing literature. By accurately identifying the benign and malignant tumors present in lung disease CT scans, the classification method that was presented improved accuracy and turned out to be the most significant.
2.1 Gap in literature
As shown by the existing literature, there is at least one problem with current deep learning models.
Due to its extreme complexity, the Genetic Algorithm is expensive and takes a long time to process.
During training and testing, the majority of current researchers have disregarded feature selection strategies that use statistical tests. It has been noted that we can improve deep learning models' performance by employing the feature selection strategy.
According to earlier study, future studies may employ feature selection and deep learning classification algorithms in comparison to their predecessors.
2.2 Problem definition
Most of the researchers have neglected the use of the statistical test for feature selection. Most of the researchers have focused on the population-based meta-heuristic genetic algorithm. Genetic algorithms are very complex and computationally costly, which makes them time-consuming.
In order to overcome this drawback, a novel deep learning technique will be designed by using the hybrid ResVGG-19 method for classification method for Lung disorders.
The widespread COVID-19 has provoked critical investigation into mechanized strategies for diagnosing the infection utilizing diagnostic imaging, especially chest X-rays and CT scans. These modalities give valuable bits of knowledge into the movement and severity of lung diseases caused by the SARS-CoV-2 infection.
Collect an expansive, large expansive huge dataset of lung CT filter images commented on with the stages of lung cancer, pneumonia, and COVID-19. These images should come from reliable medical sources and should include various stages of the diseases. Ensure the images are labeled accurately, indicating the disease (lung cancer, pneumonia, COVID-19) and its stage. Normalize the images to ensure consistent pixel intensity values. Fragment the lung locale from the CT checks to center the investigation on important regions. Select a ResVGG-19 demonstrate design and Part the information into preparing, approval, and test sets. Prepare the demonstrate on the preparing set and approve its execution on the approval set. Design the output layer of the demonstration to have different classes comparing to diverse stages of each malady (e.g., benign lung cancer, malignant lung cancer, benign pneumonia, malignant pneumonia, benign COVID-19, malignant COVID-19). Utilize a reasonable misfortune work like categorical cross-entropy for multi-class classification.
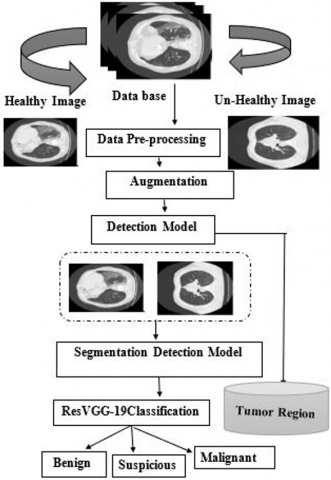
Analyze the confusion matrix to see how well the demonstration recognizes between distinctive stages and illnesses in Figure 1.
Figure 1. Experiment pipeline for proposed system flow structure
3.1 Bilinear interpolation
Bilinear insertion could be a resampling strategy utilized in image preparation to gauge the value of an unused pixel based on the values of surrounding pixels [20].
3.1.1 Algorithm: Bilinear interpolation
Step 1: Identify the Surrounding Pixels:
Identify the four surrounding pixels in the original image (a, b). These pixels form a rectangle around the point (a, b). Let the coordinates are $\left(a_1, b_1\right),\left(a_2, b_1\right),\left(a, b_2\right),\left(a_2, b_2\right)$.
Step 2: Compute the Weights:
Compute the distances from the point (x, y) to each of the four surrounding pixels. These distances are used to calculate the weights for the interpolation [21].
$w_1=\left(a_2-a\right)\left(b_2-b\right)$ (1)
$w_2=\left(a-a_2\right)\left(b_2-b\right)$ (2)
$w_3=\left(a_2-a\right)\left(b-b_1\right)$ (3)
$w_4=\left(a-a_2\right)\left(b-b_1\right)$ (4)
Step 3: Interpolate in One Direction (Horizontal Interpolation):
Interpolate along the top and bottom boundaries of the rectangle formed by $\left(a_1, b_1\right),\left(a_2, b_1\right),\left(a, b_2\right),\left(a_2, b_2\right)$.
$v_1=f\left(a_1, b_1\right) w_1+f\left(a_2, b_1\right) w_2$ (5)
$v_2=f\left(a_1, b_2\right) w_3+f\left(a_2, b_2\right) w_4$ (6)
Step 4: Interpolate in the Other Direction (Vertical Interpolation):
Finally, interpolate between $v_1$ and $v_2$ along the vertical direction,
$f(a, b) \approx v_1\left(b_2-b\right)+v_2\left(b-b_1\right)$ (7)
For COVID-19 image processing jobs where a trade-off between accuracy and computing economy is required, bilinear interpolation is a preferred option since it achieves a balance between simplicity and efficacy [21]. After pre-processing, the lung dataset is given to the Data Augmentation section.
3.2 Data augmentation
Data augmentation can be considered an essential process in machine learning, mainly for tasks including lung image data like Healthy, COVID, Non-COVID, Pneumonia, and Lung cancer image classification [22]. It also assists with model generalization by synthesizing various transformation forms of the training dataset in Figure 2. The improved output pictures which are provided to the procedure of adaptive histogram equalization [23]. Accuracy model according to the degree of augmentation can be demonstrated in Table 1.
Figure 2. Some of the data augmentation examples it is worth considering as follows
Table 1. Comparison of the models with and without information expansion (DA)
|
Author |
Model |
Without DA |
With DA |
||
|
Input |
Accuracy |
Input |
Accuracy |
||
|
Waheed et al. [24] |
COVID-19 detection |
Healthy 721 Unhealthy 402 |
85% |
Healthy 1390 Unhealthy 1665 |
Kumar and Mallik [2] |
|
Shyni and Chitra [25] |
COVID-19 and Pneumonia |
Healthy 1578 Unhealthy 412 pneumonia 1485 |
94.19% |
Healthy 2230 Unhealthy 2127 pneumonia 1352 |
94.94% |
|
Shyni and Chitra [22] |
Classification |
Total 8732 |
74% |
Total 43660 |
78.06% |
|
Lemley et al. [26] |
CNN |
Total 4000 |
88.15% |
Total 48260 |
95.66% |
|
Ullah et al. [27] |
ML Classification |
CT Image 2910 |
88.31% |
CT images 80000 |
95.88% |
3.3 AHE
In contrast to standard Histogram Equalization, which applies histogram equalization to the entire picture, AHE operates when the image is separated into distinct sub-regions or tiles from which histogram equalization is applied. This technique can aid in enhancing local contrast and highlighting details in previously overshadowed areas of an image [28]. CLAHE is a base-variant of AHE that tries to prevent sounds from enhancing contrast [29].
3.3.1 Algorithm: AHE
Step 1: Divide the image into tiles or regions.
Step 2: Let the image be divided into m×n tiles.
Step 3: For each tile Ti,j, calculate the histogram $H_{i, j}(k)$ for intensity levels k.
Step 4: Calculate the Cumulative Distribution Function (CDF) for each tile.
$C D F_{i, l}(k)=\sum_{i=0}^k H_{i, j}(l)$ (8)
Step 5: Normalize the CDF.
$C D F_{i, j}^{\prime}(k)=\frac{C D F_{i, l}(k)-C D F_{i, l}(o)}{C D F_{i, l}(255)-C D F_{i, l}(o)} \times 255$ (9)
Step 6: Map the original pixel intensities in each tile to the new values using the normalized CDF.
$V_{i, j}^{\prime}(a, b)=C D F_{i, j}^{\prime}\left(V_{i, j}(a, b)\right)$ (10)
where, $V_{i, j}(a, b)$ is the original intensity and $I_{i, j}^{\prime}(a, b)$ is the new intensity.
Interpolate the pixel values at the boundaries of the tiles to ensure smooth transitions.
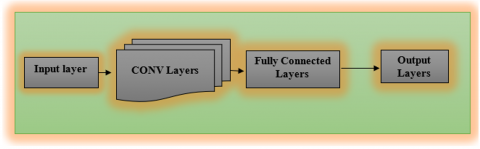
3.4 Segmentation with deep learning
The act of dividing an image into two or more sections is primarily emphasized by the variety of definitions [30]. The objective of segmentation is to give each pixel in an image a name so that those pixels that have the same label have similar properties shown in Figure 3.
Step 1: Choose a deep learning model architecture for segmentation.
Step 2: Train the model on labelled segmentation datasets.
Step 3: Predict segmentation masks for a fresh collection of lung images using the learnt model.
Figure 3. ResVGG-19 CNN block
3.4.1 Algorithm: Deep learning-based segmentation
Step 1: Region Proposal Network (RPN)
RPN may be a key component in present-day object location systems, such as Quicker R-CNN, which produces candidate object districts. These proposed calculations are at that point utilized by the discovery arrangement to classify objects and refine their bounding boxes [31].
Anchors:
Fixed-size reference boxes are placed uniformly across the lung image.
Anchors={(x,y,w,h)} for each position on the feature map.
Objectless Score and Bounding Box Prediction.
$P_{ {object }}=\sigma\left({Conv}\left(f_{ {map }}\right)\right)$ (11)
$t_x, t_y, t_w, t_h={Conv}\left(f_{ {map }}\right)$ (12)
Step 2: Feature Extraction based on Region of Interest (RoI)
RoI pooling is an essential factor required in object detection networks, including Faster R-CNN, which allows the selection of a fixed-size feature map from a variable-sized region of interest [32]. It is useful in this research to extract features properly, thereby having the capacity to take objects of varying sizes and aspect ratios.
$F_{{RoI }}= ROI\ Pooling\ \left(f_{{map }}\right., RoIs)$ (13)
Step 3: SoftMax Classification
Softmax classification is a method widely employed in machine learning and used mainly in neural networks to solve multi-class classification problems. The SoftMax function transform the raw class scores, or logits, through converting the vectors into probabilities that always sum to 1. This proposed network to predict the probability of each class and select the most likely class as the output [33].
Compute the raw class scores (logits) for each class.
Convert the logits into probabilities using the SoftMax formula.
$P_{{class }}={Softmax}\left(W_{c l s} \cdot f_{R o I}+b_{c l s}\right)$ (14)
Step 4: Bounding Box Regression
The essential objective of bounding box regression is to alter the facilities of the starting bounding box recommendations to adjust with the genuine boundaries of the objects within the lung image. This alteration is learned amid the preparation based on the contrasts (offsets).
$t_x, t_y, t_w, t_h=W_{c l s} . f_{R o I}+b_{c l s}$ (15)
Step 5: Mask Prediction
Mask R-CNN is an expansion of the Quicker R-CNN protest location system that includes the capability to create pixel-level covers for each question recognized in a lung image. It coordinates the qualities of Speedier R-CNN for protest location with a semantic division assignment to create profoundly exact protest covers.
$mask\ Head\ M_{mask}=\sigma\left({Conv}\left(f_{{RoI }}\right)\right.$ (16)
$\begin{gathered}{ Binary\ Mask\ Prediction }\ M_{ {binary }}= { throshold }\left(M_{ {mask }}\right)\end{gathered}$ (17)
3.5 Classification
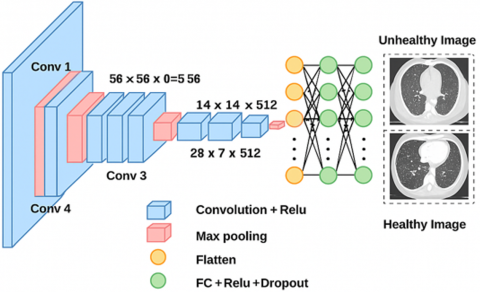
(1) VGG-19 classification
The input of the VGG19 model is a 224 × 224, 3-channel picture with its average RGB value eliminated. Its 19 weighted layers (Figure 4) are made up of 16, and the minimal slot size of 3×3. The architecture is exactly the same as in the previous array with five max-pooling layers, but this time it has a two-pixel stride and a 2×2 core size.
(2) Resnet50 classification
ResNet50 is a residual network model that has a maximum of 26 million parameters and 50 layers. In actuality, Microsoft unveiled the deep convolutional neural network model in 2015. Instead of learning features, we learn residuals in the residual network by subtracting taught features from the layer inputs.
Figure 4. VGG-19 architecture
3.5.1 Proposed hybrid ResVGG-19 classification
We began our trials by choosing the ResVGG-19 convolutional neural network, pre-trained, and actually enhanced by freezing some of the layers in order to avoid data overlearning, all too often the case given the size of the picture selection used by us. The number of convolutional layers used in ResVGG-19 model is 69. Concerning the network’s input picture, it has a resolution of 512×512×3. It also has 5 layers of Max pooling of size 2×2 on the whole network and 69 layers of convolutional to a fixed size filter of 3×3. There is no disconnection in the two levels, though, at the top, there is a SoftMax output layer. The ResVGG-19 model has more than 138 million parameters, which shows that the given network is a real behemoth. To construct the complex structural architecture, outward convolution layers are used to extend deeply the ability to learn emergent properties; it places multiple.
Figure 5. Flowchart for ResVGG-19 classification
A flow graph of the classification is shown in Figure 5. Vertical flip isn’t discussed because flipping the X-ray lung images would not compromise practical views as they are not vertically aligned. Following this, the machine learning classifier utilizes augmented images [34] where the test sample is only 20% of the entire dataset, while the remaining 80% is for the training function. Offering the classifier a diverse and properly preprocessed set of images, this study enhances the classifier’s learning and generalization capability.
Matric evaluation:
Convolution algorithms are often evaluated using a number of metrics to see how effectively the model is doing on classification tasks. It can be used to identify its advantages and disadvantages. The following are some important CNN classification performance measures.
(1) Accuracy
Accuracy $=\frac{\text { Amount of accurate forecaste }}{\text { Total number of forecaste }}$ (18)
(2) Precision
One way to measure positive figure exactness would be precision. The ratio of accurately predicted positive perceptions to all predicted positives is displayed.
Precision $=\frac{\text { True positives }}{\text { True positives }+ \text { False positives }}$ (19)
(3) Recall
Review is the ratio of correctly predicted positive views to all perceptions in the actual lesson, and it gauges the show's ability to identify positive moments.
Recall $=\frac{\text { True positives }}{\text { True positives }+ \text { False Negatives }}$ (20)
3.5.2 Confusion matrix
A lattice that tracks how many classifications the show made precisely and conversely is termed a disarray lattice. It enlightens on the kinds of mistakes that are being made. The symbols are used, including wrong positive (FP), untrue negative (FN), genuine positive (TP), and genuine negative (TN).
In cross-validation, the dataset is separated into various subsets, the demonstrate is prepared on a couple of these subsets, and it is at that point assessed on the remaining subsets. It helps in assessing the vigor and generalizability of the demonstration. By reducing the impacts of overfitting and information changeability, it offers a more precise appraisal of the model's execution.
(1) Computing Equipment
Using a TensorFlow 2 backend and the Keras APIs, experiments were programmed. An Intel Xeon Gold 6150 was recorded as the server that was utilized. 2.7GHz 18 centers (16 empowered centers) and 24.75MB L3 cache (3.7GHz most extreme turbo recurrence, 3.4GHz least). The server highlighted six channels of 360GB Slam. A NVIDIA Quadro P5000 GPU (2,560 Centers, 16GB Memory) was housed on this server.
(2) Experiment Setup
For each image mode and each experiment, the ResVGG19 model was adjusted to produce the best feasible results for the combined datasets. Learning rates were adjusted in increments of one order of magnitude, ranging from 10-3 to 10-6. Batch sizes ranging from two to sixteen were utilized. There were 4 to 96 nodes in the deep layer. Two different dropout rates were used: 0.1 and 0.2. In our proposed work, we processed two distinct sets of samples: one is a private dataset, and the other is a public dataset. The private data were collected from the International Cancer Center Neyyoor (ICC) and the Pranav Scan Center (PSC) in Nagercoil. The public datasets were sourced from the internet, as detailed in Table 2.
The database provided the sample photos. N-CLAHE-MEDICAL-IMAGES on github.com is the source of these images. In this instance, a few of the images are examined and fed into the CAD program in Figure 6.
Table 2. Private and public sample datasets
|
Dataset |
Availability |
Number of Cases |
Types |
|
Internet (LIDC) |
Public |
432 |
Healthy lung Images |
|
ICC |
Private |
45 |
Healthy |
|
Internet (LIDC) |
Public |
1018 |
Lung Disorder Images (Pneumonia, COVID, Lung cancer) |
|
ICC |
Private |
205 |
Lung Disorder Images (Pneumonia, COVID, Lung cancer) |
|
PSC Nagercoil |
Private |
323 |
Lung Disorder Images (Pneumonia, COVID, Lung cancer) |
|
PSC Nagercoil |
Private |
119 |
Healthy lung Images |
Figure 6. Sample input images from the LIDC dataset
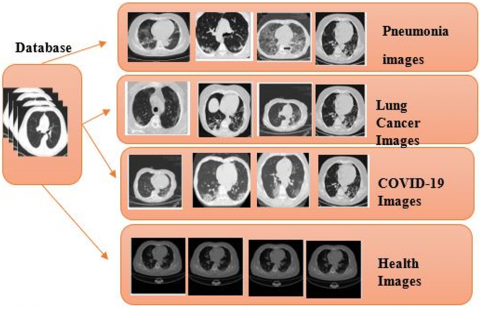
A few of the lung disorder samples are displayed in Figure 7. The sample lung disorder datasets can be divided into i) Healthy, ii) Lung cancer, iii) COVID, and iv) Pneumonia. The dataset was collected from the ICC, which contains more than 800 example photos, 400 and 400 examples, respectively. The cells of the input image that were affected were identified. The procedure entails both the detection of affected cells and their extraction of the affected region.
Figure 7. Sample lung disorders datasets
The proposed algorithms' outline output is shown in Figure 8. To the suggested deep learning segmentation with AHE, the output image is Coarse Heatmap. Pixels with comparable intensities are grouped together and subsequently segmented using deep learning segmentation algorithm. The tumour cells are distinguished from normal lung images by the proposed DL segmentation.
Figure 8. Outline result of the system flow (a) Input image, (b) Augmented image, (c) Pre-processed output image, d) Coarse heat map, (e) Result of segmentation, (f) Classification prediction
Our suggested Deep Learning (DL) segmentation technique is one of the most effective and accurate region detection segmentation methods for lung disorders. The normal region and the damaged region are divided using various image processing techniques, which form the basis of the DL segmentation. The proposed approach is straightforward, yet it uses segmentation to split images with lighter background objects into different regions in Figure 9. This is a strong technique. The advantages of these segmentations are that they consistently divide the affected region, even in the sample images' smaller areas.
Figure 9. Proposed DL segmentation: a) Healthy image 1, b) Pneumonia image, c) Lung cancer image, d) COVID-19 images
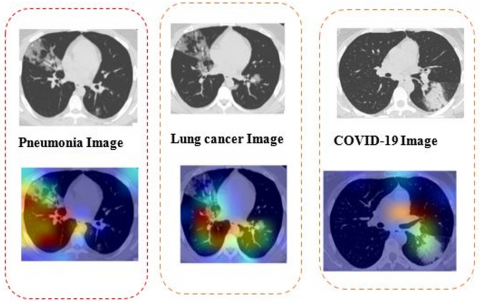
ReLU activation is carried out once the target class c's relevance has been determined by calculating the weighted sum of the activation maps. This leads to the creation of a course heatmap with spatial dimensions that match those of the convolutional feature maps. The classifier's behavior at positive gradients of the input data concerning the target class is examined using ReLU. As previously indicated, the study's base learners are DL-based models. Our goal in creating Grad-CaM images was to draw attention to the most significant portions of a picture that affect the base learners' predictions in Figure 10.
Figure 10. Proposed coarse heat map: a) Pneumonia image, b) Lung cancer image, c) COVID-19 images
Figure 11. Segmentation result: a) Pneumonia image, b) Lung cancer image, c) COVID-19 images
The proposed DL based segmentation is carried out in lung disorder, which can be separated into Pneumonia, Lung Cancer, COVID-19, and Healthy images in Figure 11. The pre-processed image is fed to the segmentation section. Using the proposed segmentation algorithm, predict and accurately extract the affected boundaries. The above figure displays the benign and malignant stages of lung disorders predicted by images. Finally predicted the stages of the lung disorder, whether benign stage and malignant. This technique eliminates every flaw in the previous approaches and produces accurate visual results for separating the damaged region from healthy regions. The proposed segmentation prediction time is 4 milliseconds compared to other segmentation algorithms.
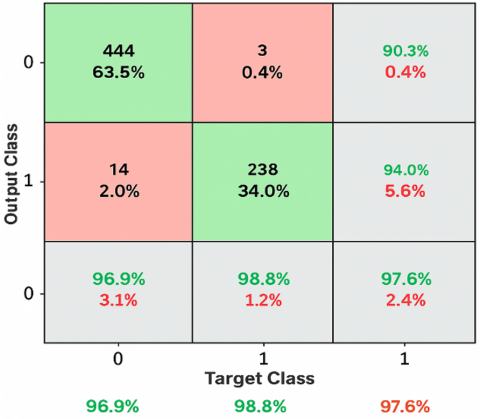
The classification was performed using a ResVGG-19 Classifier, which compares the predicted values of the output class with the target class. The classifier used in the study was almost perfect in distinguishing between the benign stage, with an accuracy of 100%, and the malignant stage, with 97.6%. The results are as depicted in Figure 12. Table 3 represents the proposed Classification performance matrix, which is compared with K-means clustering, bounding box algorithms, but the metrics are PSNR, MSE, SSM, Correlation, Energy, and Smoothness.
Figure 12. Confusion matrix
Table 3. Performance matrix for the proposed algorithm
|
Metrics |
K-Means Cluster [35] |
Bounding Box [36] |
Proposed Methodology |
|
PSNR |
90.2 |
93.76 |
98.2 |
|
MSE |
0.049 |
0.0997 |
0.0235 |
|
SSM |
0.62 |
0.90 |
0.93 |
|
Correlation Energy |
0.31 |
0.44 |
0.98 |
|
Smoothness |
5.4 |
7.64 |
9.68 |
The accuracy level of the suggested Deep learning-based segmentation performance assessment is 97.6% greater than that of the alternative techniques, as indicated in Table 4.
As seen in Table 4, the segmentation accuracy of the suggested research project outperforms the current methods significantly. The Deep Learning based segmentation along with ResVGG-19 classifier approach used in the proposed research, yields excellent findings with a 97.1% accuracy rate. Table 5 illustrates that the deep learning classifier yielded an accuracy of 97.6%, surpassing the accuracy attained by alternative methods. Higher levels, however, occasionally cause regions to fuse, which makes larger tumours more likely to be labelled as malignant.
Table 4. Performance analysis of segmentation techniques
|
|
Method |
Segmentation Accuracy (%) |
|
Teixeira et al. [37] |
K-means clustering |
84.3 |
|
Kumar et al. [38] |
Convolution Neural Network |
86.58 |
|
Shao and Wang [33] |
Softmax |
87.14 |
|
Hassan [13] |
CronaSona model |
92.3 |
|
Yoon and Kang [17] |
Masked encoder-based classifier |
95.1 |
|
PROPOSED METHOD |
Deep Learning based segmentation along with ResVGG-19 classifier |
97.6 |
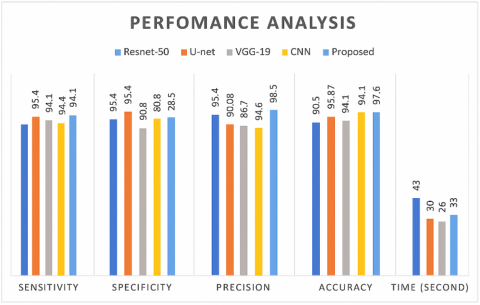
Table 5. Comparison of classifier performance
|
Classifier |
ResNet50 |
U-Net |
VGG-19 |
CNN |
Proposed |
|
Sensitivity |
90.2 |
93.54 |
94.1 |
92.3 |
96.7 |
|
Specificity |
93.5 |
94.41 |
85.6 |
92.3 |
92.3 |
|
Precision |
95.4 |
90.89 |
87.4 |
82.6 |
98.5 |
|
Accuracy |
90.5 |
93.87 |
90.5 |
94.13 |
97.6 |
|
Time (Second) |
43 |
30 |
26.6 |
33 |
20 |
The accuracy acquired from the classifier with deep learning technique from Table 4 is 97.1%, higher than other methods. Perhaps for some of its higher values, some of the required region will be combined in some cases for the larger tumor marked malignant in Figure 13.
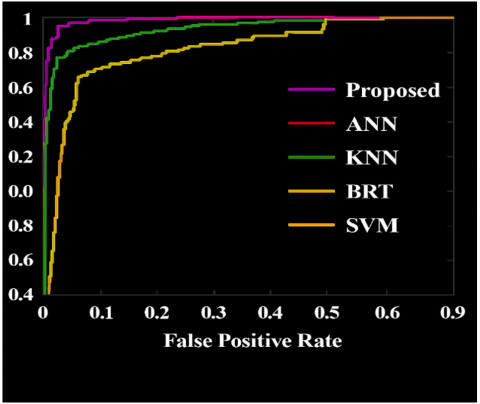
Together with the suggested classifiers, the ROC curve compares the different classifiers (Res-Net 50, VGG-19, U-Net, and CNN). The True Positive value, obtained by dividing the number of lung disease categorized as Affected by the actual Affected cells, is high, indicating that our approach was better than the other approach for a simple analysis of the affected cells from the lung disease cells as presented in Figure 14.
Figure 13. Performance analysis of classifier metrics
Figure 14. Performance analysis of classifier RoC curve
From confusion matrices, we collected classification analysis values, which are true positive, false positive, true negative and false negative, as displayed in Table 6. The proposed method True positive is 48.5, False positive is 64.9, False negative value is 35.1 and true negative value is 51.5. Better accuracy will result if there are fewer false negative values. The proposed method has a false negative value of 35.1, which is significantly lower than that of other methods. Our proposed methods outperformed other classifiers, such as ResNet50, U-Net, VGG-19, and CNN, achieving better results.. The experiment's conclusions demonstrate that using ResVGG-19 classifiers significantly improves overall accuracy when compared to traditional classifiers. Tests on additional images revealed that the recommended approach performs effectively in every situation, irrespective of how clear or hazy the objects are against the background.
Table 6. Performance analysis of confusion matrix
|
Technology (%) |
True Positive |
False Positive |
False Negative |
True Negative |
|
Resnet50 |
41.1 |
55.5 |
43.1 |
56.4 |
|
U-Net |
46.1 |
55.9 |
44.1 |
53.9 |
|
VGG-19 |
44.9 |
56.6 |
43.4 |
55.1 |
|
CNN |
43.7 |
58.2 |
41.8 |
56.3 |
|
Proposed |
48.5 |
64.9 |
35.1 |
51.5 |
In the process of evaluating the classification performance, test and training sets were derived from the full data set. The Lung benign and malignant disease data were split in 90-10%, 80-20%, and 70-30% ratios for determining the impact of various splits on the performance of the diagnostic system. As indicated in Table 7, to enable easy comparison, the average of the outcome for each split was calculated.
Table 7. Performance analysis of the ResNet50
|
Classifier |
Data (Testing-Training) |
Type of Class |
Sensitivity |
Specificity |
Precision |
Accuracy |
|
ResVGG-19 |
90%-10% |
Benign |
0.959 |
0.961 |
0.919 |
0.976 |
|
Malignant |
0.915 |
0.896 |
0.942 |
|||
|
Avg. Value |
0.935 |
0.928 |
0.931 |
|||
|
80%-20% |
Benign |
0.915 |
0.941 |
0.941 |
0.973 |
|
|
Malignant |
0.974 |
0.967 |
0.942 |
|||
|
Avg. Value |
0.945 |
0.954 |
0.94 |
|||
|
70-30% |
Benign |
0.963 |
0.976 |
0.974 |
0.969 |
|
|
Malignant |
0.931 |
0.961 |
0.964 |
|||
|
Avg. Value |
0.947 |
0.969 |
0.969 |
A proposed CAD will enhance the classification accuracy by differentiating CT images of lung disorders as benign or malignant. For enhancing the CT images of lung cancer, the AHE was applied for the enhancement of the pre-processing step of the images. The architecture of hybrid ResVGG-19 is the most efficient for the lung disorder classification task, performing well in any data situation, whether or not data augmentation processes are integrated. The results show that the AHE methodology is a very successful method for improving the contrast of medical images without sacrificing information, and that the performance of AHE-enhanced image instances is significantly better than that of normal contrast images. Upon examining the segmentation technique outcomes, it is possible to conclude that the RPN with Bounding Box Regression techniques outperforms other methods currently found in the literature in terms of producing suitable results. Lastly, a ResVGG19-based categorization is used to determine if the images are benign or malignant. The computational complexity is greatly reduced by the ResVGG19 classifier. The CNN, Resnet50, U-Net, and VGG-19 are contrasted with the suggested ResVGG19 classifier's performance. The suggested system's obtained accuracy of 97.6% is more than the current categorization methods used on lung CT scans in the literature. It is clear from this that the suggested classifier has a great deal of promise for use in computer-aided diagnosis systems to accurately categorize diseases. AI-led disease diagnosis has a highly promising future, and as new technologies are developed, it just gets better.
[1] Pandey, S.K., Bhandari, A.K. (2023). A systematic review of modern approaches in healthcare systems for lung cancer detection and classification. Archives of Computational Methods in Engineering, 30(7): 4359-4378. https://doi.org/10.1007/s11831-023-09940-x
[2] Kumar, S., Mallik, A. (2023). COVID-19 detection from chest X-rays using trained output based transfer learning approach. Neural Processing Letters, 55(3): 2405-2428. https://doi.org/10.1007/s11063-022-11060-9
[3] Santosh, K.C., GhoshRoy, D., Nakarmi, S. (2023). A systematic review on deep structured learning for COVID-19 screening using chest CT from 2020 to 2022. Healthcare, 11(17): 2388. https://doi.org/10.3390/healthcare11172388
[4] Gao, C., Wu, L., Wu, W., Huang, Y., Wang, X., Sun, Z., Xu, M., Gao, C. (2025). Deep learning in pulmonary nodule detection and segmentation: A systematic review. European Radiology, 35(1): 255-266. https://doi.org/10.1007/s00330-024-10907-0
[5] Bhosale, Y.H., Patnaik, K.S. (2023). PulDi-COVID: Chronic obstructive pulmonary (lung) diseases with COVID-19 classification using ensemble deep convolutional neural network from chest X-ray images to minimize severity and mortality rates. Biomedical Signal Processing and Control, 81: 104445. https://doi.org/10.1016/j.bspc.2022.104445
[6] Thakral, G., Gambhir, S. (2024). Early detection of lung cancer with low-dose CT scan using artificial intelligence: A comprehensive survey. SN Computer Science, 5(5): 441. https://doi.org/10.1007/s42979-024-02811-7
[7] Budati, M., Karumuri, R. (2024). An intelligent lung nodule segmentation framework for early detection of lung cancer using an optimized deep neural system. Multimedia Tools and Applications, 83(12): 34153-34174. https://doi.org/10.1007/s11042-023-17791-8
[8] Mammeri, S., Amroune, M., Haouam, M.Y., Bendib, I., Corrêa Silva, A. (2024). Early detection and diagnosis of lung cancer using YOLO v7, and transfer learning. Multimedia Tools and Applications, 83(10): 30965-30980. https://doi.org/10.1007/s11042-023-16864-y
[9] Muhtasim, N., Hany, U., Islam, T., Nawreen, N., Mamun, A.A. (2024). Artificial intelligence for detection of lung cancer using transfer learning and morphological features. The Journal of Supercomputing, 80(10): 13576-13606. https://doi.org/10.1007/s11227-024-05942-z
[10] Sudha, R., Maheswari, K.U. (2024). Automatic lung cancer detection using hybrid particle snake swarm optimization with optimized mask RCNN. Multimedia Tools and Applications, 83(31): 76807-76831. https://doi.org/10.1007/s11042-024-19113-y
[11] Saha, A., Ganie, S.M., Pramanik, P.K.D., Yadav, R.K., Mallik, S., Zhao, Z. (2024). VER-Net: A hybrid transfer learning model for lung cancer detection using CT scan images. BMC Medical Imaging, 24(1): 120. https://doi.org/10.1186/s12880-024-01238-z
[12] Panjeta, M., Reddy, A., Shah, R., Shah, J. (2024). Artificial intelligence enabled COVID-19 detection: Techniques, challenges and use cases. Multimedia Tools and Applications, 83(2): 4639-4666. https://doi.org/10.1007/s11042-023-15247-7
[13] Hassan, S.A. (2024). An AI healthcare ecosystem framework for COVID-19 detection and forecasting using CronaSona. Medical & Biological Engineering & Computing, 62(7): 1959-1979. https://doi.org/10.1007/s11517-024-03058-3
[14] Khero, K., Usman, M., Fong, A. (2024). Deep learning framework for early detection of COVID-19 using X-ray images. Multimedia Tools and Applications, 83(3): 6883-6908. https://doi.org/10.1007/s11042-023-15995-6
[15] Asnake, N.W., Salau, A.O., Ayalew, A.M. (2024). X-ray image-based pneumonia detection and classification using deep learning. Multimedia Tools and Applications, 83(21): 60789-60807. https://doi.org/10.1007/s11042-023-17965-4
[16] Li, D. (2024). Attention-enhanced architecture for improved pneumonia detection in chest X-ray images. BMC Medical Imaging, 24(1): 6. https://doi.org/10.1186/s12880-023-01177-1
[17] Yoon, T., Kang, D. (2024). Enhancing pediatric pneumonia diagnosis through masked autoencoders. Scientific Reports, 14(1): 6150. https://doi.org/10.1038/s41598-024-56819-3
[18] Mehmood, M.H., Hassan, F., Rahman, A.U., Khan, W., Mostafa, S.M., Ghadi, Y.Y., Algarni, A.M., Ali, M. (2024). CP_DeepNet: A novel automated system for COVID-19 and pneumonia detection through lung X-rays. Multimedia Tools and Applications, 83: 88681-88698. https://doi.org/10.1007/s11042-024-18921-6
[19] Goyal, S., Singh, R. (2023). Detection and classification of lung diseases for pneumonia and COVID-19 using machine and deep learning techniques. Journal of Ambient Intelligence and Humanized Computing, 14(4): 3239-3259. https://doi.org/10.1007/s12652-021-03464-7
[20] Ershov, A.A.E. (2023). Bilinear interpolation of program control in approach problem. Ufa Mathematical Journal, 15(3): 41-53. https://doi.org/10.13108/2023-15-3-41
[21] Wang, X.H., Jia, X.Y., Zhou, W., Qin, X.Y., Guo, H.M. (2019). Correction for color artifacts using the RGB intersection and the weighted bilinear interpolation. Applied Optics, 58(29): 8083-8091. https://doi.org/10.1364/AO.58.008083
[22] Shyni, H.M., Chitra, E. (2022). A comparative study of X-ray and CT images in COVID-19 detection using image processing and deep learning techniques. Computer Methods and Programs in Biomedicine Update, 2: 100054. https://doi.org/10.1016/j.cmpbup.2022.100054
[23] Lemley, J., Bazrafkan, S., Corcoran, P. (2017). Smart augmentation learning an optimal data augmentation strategy. IEEE Access, 5: 5858-5869. https://doi.org/10.1109/ACCESS.2017.2696121
[24] Waheed, A., Goyal, M., Gupta, D., Khanna, A., Al-Turjman, F., Pinheiro, P.R. (2020). COVIDGAN: Data augmentation using auxiliary classifier GAN for improved COVID-19 detection. IEEE Access, 8: 91916-91923. https://doi.org/10.1109/ACCESS.2020.2994762
[25] Shyni, H.M., Chitra, E. (2024). PulmonNet V1: Leveraging the benefit of Leaky ReLU activation for the local and multi-scale global feature integration of chest radiographs to classify pulmonary diseases. Biomedical Signal Processing and Control, 96: 106600. https://doi.org/10.1016/j.bspc.2024.106600
[26] Lemley, J., Bazrafkan, S., Corcoran, P. (2017). Transfer learning of temporal information for driver action classification. MAICS, pp. 123-128. https://www.researchgate.net/profile/Joseph-Lemley/publication/316748306_Transfer_Learning_of_Temporal_Information_for_Driver_Action_Classification/links/59109a6c458515bbcb4cedae/Transfer-Learning-of-Temporal-Information-for-Driver-Action-Classification.pdf.
[27] Ullah, M., Wahab, A., Saeed, S., Khan, S.U., Ali, H., Humayun, S., Abbasi, B.A., Saud, S., Naveed, K., Khan, S.A., Fahad, S. (2021). Coronavirus and its terrifying inning around the globe: The pharmaceutical cares at the main frontline. Chemosphere, 275: 129968. https://doi.org/10.1016/j.chemosphere.2021.129968
[28] Zhu, Y., Huang, C. (2012). An adaptive histogram equalization algorithm on the image gray level mapping. Physics Procedia, 25: 601-608. https://doi.org/10.1016/j.phpro.2012.03.132
[29] Vijayalakshmi, D., Nath, M.K. (2023). A strategic approach towards contrast enhancement by two-dimensional histogram equalization based on total variational decomposition. Multimedia Tools and Applications, 82(13): 19247-19274. https://doi.org/10.1007/s11042-022-13932-7
[30] Emek Soylu, B., Guzel, M.S., Bostanci, G.E., Ekinci, F., Asuroglu, T., Acici, K. (2023). Deep-learning-based approaches for semantic segmentation of natural scene images: A review. Electronics, 12(12): 2730. https://doi.org/10.3390/electronics12122730
[31] Tian, S., Chen, R., Zou, W., Li, X. (2024). MI-RPN: Integrating multi-modalities and multi-scales information for region proposal. Multimedia Tools and Applications, 83(20): 58267-58292. https://doi.org/10.1007/s11042-023-16484-6
[32] Vaidya, K.S., Patil, P.M., Alagirisamy, M. (2023). Hybrid CNN-SVM classifier for human emotion recognition using ROI extraction and feature fusion. Wireless Personal Communications, 132(2): 1099-1135. https://doi.org/10.1007/s11277-023-10650-7
[33] Shao, H., Wang, S. (2023). Deep classification with linearity-enhanced logits to softmax function. Entropy, 25(5): 727. https://doi.org/10.3390/e25050727
[34] Mzoughi, O., Yahiaoui, I. (2023). Deep learning-based segmentation for disease identification. Ecological Informatics, 75: 102000. https://doi.org/10.1016/j.ecoinf.2023.102000
[35] Ramesh, N., Salama, M.E., Tasdizen, T. (2012). Segmentation of haematopoeitic cells in bone marrow using circle detection and splitting techniques. In 2012 9th IEEE International Symposium on Biomedical Imaging (ISBI), Barcelona, Spain, pp. 206-209. https://doi.org/10.1109/ISBI.2012.6235520
[36] Rani, K.V., Ancy, A.A. (2018). Multiscale Image Enhancement Based on Natural Visual System. Journal of Signal Processing, 4(2): 1-6.
[37] Teixeira, L.O., Pereira, R.M., Bertolini, D., Oliveira, L.S., Nanni, L., Cavalcanti, G.D., Costa, Y.M. (2021). Impact of lung segmentation on the diagnosis and explanation of COVID-19 in chest X-ray images. Sensors, 21(21): 7116. https://doi.org/10.3390/s21217116
[38] Kumar, S., Arif, T., Alotaibi, A.S., Malik, M.B., Manhas, J. (2023). Advances towards automatic detection and classification of parasites microscopic images using deep convolutional neural network: Methods, models and research directions. Archives of Computational Methods in Engineering, 30(3): 2013-2039. https://doi.org/10.1007/s11831-022-09858-w