Juan Xiao*![]() | Xiaobo Yin
| Xiaobo Yin![]() | Zhenyu Wang
| Zhenyu Wang![]()
© 2025 The authors. This article is published by IIETA and is licensed under the CC BY 4.0 license (http://creativecommons.org/licenses/by/4.0/).
OPEN ACCESS
With the continuous advancement of medical imaging technologies, 3D reconstruction and quantitative analysis of medical images have become increasingly vital in disease diagnosis, treatment planning, and surgical assistance. The integration of deep learning has brought new opportunities and challenges to medical image processing. Although current deep learning-based 3D reconstruction methods have achieved certain progress, they still face significant issues in practical applications, particularly in terms of the accuracy, robustness, and overall quality of feature point extraction and matching. Traditional feature extraction and matching techniques often struggle with noise, occlusions, and viewpoint variations, while existing deep learning methods show limited generalizability and stability when applied to multi-modal medical image reconstruction. To address these challenges, this study proposes a novel feature extraction and matching approach based on SuperPoint and SuperGlue, integrated with Neural Radiance Fields (NeRF) for 3D reconstruction. SuperPoint and SuperGlue enable accurate extraction and matching of key points in medical images, effectively overcoming limitations of traditional methods. Meanwhile, NeRF facilitates high-fidelity modeling and optimization of lighting and textures in 3D scenes, significantly enhancing reconstruction quality and accuracy. By combining these technologies, the proposed approach substantially improves the precision of 3D reconstruction and quantitative analysis of medical images, demonstrating strong potential for clinical applications.
medical imaging, 3D reconstruction, feature point extraction and matching, SuperPoint, SuperGlue, Neural Radiance Fields (NeRF)
With the rapid development of medical imaging, medical images play an increasingly important role in disease diagnosis, treatment planning, and surgical assistance [1-7]. Especially in the application of computer-aided diagnosis (CAD) systems, how to accurately extract key information from medical images and perform 3D reconstruction has become a research hotspot [8, 9]. 3D reconstruction of medical images can not only provide more intuitive information about the location and morphology of lesions [10], but also help to better understand the spatial structure and functional characteristics of the lesion area [11, 12]. In recent years, deep learning technology has provided strong support for medical image processing [13-15], especially convolutional neural networks (CNN), which have achieved remarkable results in image classification, segmentation, and reconstruction. However, how to further improve the accuracy and interpretability of medical images remains a major challenge in the current field.
Relevant studies have shown that 3D reconstruction of medical images can provide clinicians with richer pathological information and improve the accuracy of disease diagnosis [16, 17]. At the same time, feature point extraction and matching, as key steps in image reconstruction [18], their accuracy directly affects the quality of the final reconstruction results. Accurate feature point matching can effectively solve problems such as scale, rotation, and viewpoint differences between images, thereby achieving efficient image registration and fusion. With the development of deep learning methods, deep learning-based medical image processing technology has become increasingly mature [19], especially in the field of 3D reconstruction and quantitative analysis of medical images [20, 21], and has made significant progress. Researchers are constantly exploring new methods and models in order to improve the accuracy and efficiency of 3D reconstruction, and to help provide more accurate disease diagnosis and treatment plans in clinical practice.
However, existing 3D reconstruction methods for medical images still have some defects and shortcomings. Although traditional feature point-based matching methods have made breakthroughs in accuracy, their robustness in dealing with complex medical images is still insufficient and is easily affected by noise, occlusion, and image quality [22]. Deep learning methods, although showing excellent performance in processing large-scale data, still have certain limitations in the process of feature extraction and matching, such as high computational complexity and long model training time [23, 24]. In addition, existing methods often lack sufficient generality and accuracy when dealing with multi-modal medical images, resulting in unstable reconstruction effects, which are difficult to meet the actual needs of clinical applications.
This paper mainly studies two aspects: first, a medical image feature point extraction and matching method based on SuperPoint and SuperGlue, aiming to improve the accuracy and robustness of feature point matching; second, a 3D reconstruction method of medical images based on NeRF, aiming to improve the effect and accuracy of 3D reconstruction. By combining these two technologies, this paper proposes a new 3D reconstruction and quantitative analysis method for medical images, which can effectively improve the accuracy and efficiency of medical image processing. The research in this paper has important application value, which can not only provide clinicians with more accurate diagnostic information, but also provide new ideas and methods for research in medical imaging.
Medical images often have complex structures and high variability. Differences between different pathological features, different scanning angles, and different imaging modalities make the tasks of image alignment and fusion very complex. In order to achieve accurate 3D reconstruction, it is first necessary to extract representative feature points from medical images. These feature points can accurately reflect the structural information of the images. The extraction and matching of feature points help to align and register images from different viewpoints, thus providing a solid foundation for subsequent 3D modeling and quantitative analysis.
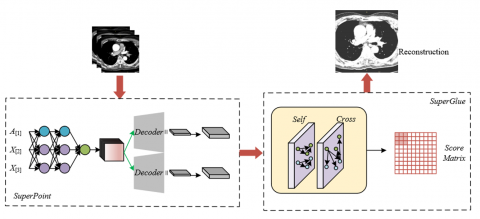
Figure 1. Workflow of feature point extraction and matching for medical images
In order to deal with the complexity and variability that may exist in medical images, this paper proposes an efficient and accurate feature point extraction and matching scheme based on the SuperPoint and SuperGlue models, as shown in Figure 1. SuperPoint, as an advanced feature point extraction method, can automatically identify stable and information-rich key feature points from medical images. These feature points play a crucial role in the image registration process. SuperPoint adopts a CNN architecture and extracts representative keypoints from local regions through learned feature maps during training.
In terms of feature point matching, this paper adopts the SuperGlue method to optimize and enhance matching accuracy. SuperGlue combines global and local contextual information and uses a graph neural network (GNN) to achieve efficient feature point matching. Different from traditional matching methods, SuperGlue can effectively overcome the feature point mismatching problem caused by viewpoint differences, morphological variations, etc., and shows strong robustness, especially when processing multi-modal medical images. Through SuperGlue’s matching mechanism, corresponding feature points in medical images from different viewpoints and imaging modalities can be accurately found, which provides accurate image registration information for 3D reconstruction.
Assuming that the matching score between feature point u in image X and feature point k in image Y is denoted by Tu,k, SuperGlue calculates the score using the matching descriptors ou, and the calculation formula is as follows:
${{T}_{u,k}}=<o_{u}^{X},o_{k}^{Y}>$ (1)
In the process of NeRF 3D reconstruction of medical images, due to the high spatial complexity and detail-rich lesion structures typically present in medical images, directly using traditional Multilayer Perceptron (MLP) networks for 3D reconstruction may not sufficiently capture these complex details, especially in the rendering of density and color. In order to avoid the pseudo-linear characteristics in MLP networks leading to overly smooth and blurred rendering results of adjacent sampling points, this paper proposes an optimization method based on positional encoding. In the 3D reconstruction of medical images, the 3D coordinates of observation points and the observation direction are key input parameters of the network, and the introduction of positional encoding can effectively enhance the sensitivity of the neural network to spatial information. By encoding the input coordinates, especially in the densely distributed regions of medical images, the encoding strategy can help the network distinguish adjacent sampling points, thereby avoiding overly similar output values caused by similar input parameters.
3.1 Positional encoding optimization
In the process of 3D reconstruction of medical images, due to the complexity and high precision requirements of medical images, the traditional NeRF rendering method may have certain deficiencies. Especially when dealing with medical image data at different scales, near-view images tend to produce blurring phenomena, while far-view images may appear with aliasing artifacts. This phenomenon is particularly evident in medical images that require clear anatomical structures and lesion boundaries. In traditional NeRF, a single ray is emitted from the camera to the center of a pixel for sampling. Although this is suitable for relatively simple rendering tasks, in the 3D reconstruction process of medical images—especially when considering changes in camera viewing angles and their effects on tissue details—this method cannot fully capture fine structures and spatial differences in the images. Medical images often present complex organ shapes and lesions, especially intertwined different tissue structures under multiple views, so traditional ray-based rendering methods are difficult to effectively handle the influence of different viewpoints and view distances on image rendering, thus affecting the quality and accuracy of 3D reconstruction. The formula of classical NeRF is:
$Z\left( e \right)=\int_{{{s}_{v}}}^{{{s}_{d}}}{S\left( s \right)\delta \left( e\left( s \right) \right)z\left( e\left( s \right),f \right)fs}$ (2)
The corresponding positional encoding formula is:
$\varepsilon \left( o \right)=\left( \begin{align} & SIN\left( {{2}^{0}}\tau o \right), COS\left( {{2}^{0}}\tau o \right), \\ & ...,SIN\left( {{2}^{M-1}}\tau o \right), COS\left( {{2}^{M-1}}\tau o \right) \\\end{align} \right)$ (3)
Mip-NeRF introduces the concept of cone rendering, which can more accurately simulate viewpoint changes and image depth information in actual shooting scenes. In practical implementation, the input of Mip-NeRF includes not only a 3D Gaussian function, but also corresponding positional information encoding. This helps to approximately represent the cone region required for integration, thereby enabling more accurate rendering of each pixel in medical images. Suppose the cone is located at the image plane (p + f), 1ˆ is the indicator function, with radius ė, and a frustum is sampled between two positions s₀ and s₁, the set of all points a within it is given by the following formula:
$D\left(a, p, \dot{e}, s_0, s_1\right)=\hat{1}\left\{\begin{array}{l}\left(\begin{array}{l}s_0<\frac{f^S(a-o)}{\|f\|_2^2}<s_1\end{array}\right) \\ \wedge\left(\frac{f^S(a-o)}{\|f\|_2^2\|a-o\|_2}>\frac{1}{\sqrt{1+\left(\dot{e} /\|f\|_2\right)}}\right)\end{array}\right\}$ (4)
In order to encode all points within the frustum, Mip-NeRF uses multivariate Gaussian functions to approximate the density and color values of these points. Since the points within the frustum have a certain spatial distribution, and this distribution is symmetrical around the cone, it can be modeled using Gaussian functions. Specifically, Mip-NeRF obtains the mean and covariance of each frustum by computing the mean and variance along the ray direction, as well as the variance perpendicular to the ray direction. These parameters can accurately describe the density changes and spatial structures of tissues or lesion areas in medical images. For example, in the reconstruction process of lung CT images, such Gaussian-based modeling can accurately express the density differences between lung tissue and lesions, thereby ensuring the clear presentation of lung details under different viewpoints. This optimization method helps to improve rendering accuracy, avoiding blurring problems caused by single-ray sampling in traditional methods, while maintaining the structural details and boundary clarity in images. To obtain the multivariate Gaussian function, it is first necessary to calculate the mean and covariance of the set D (a, p, ė, s0, s1). Such a Gaussian distribution is completely determined by the starting point p, the vector f representing ray direction and distance, the mean along the ray direction, the variance along the ray direction, and the variance perpendicular to the ray direction. Let the midpoint sω=(s₀+s₁)/2 and the half-width value sσ=(s1−s2)/2, the formulas for computing the mean along the ray, the variance along the ray direction, and the variance perpendicular to the ray direction are as follows:
$\begin{align} & {{\omega }_{s}}={{s}_{\omega }}+\frac{2{{s}_{\omega }}s_{\sigma }^{2}}{3s_{\omega }^{2}+s_{\sigma }^{2}} \\ & \delta _{t}^{2}=\frac{s_{\sigma }^{2}}{3}-\frac{4s_{\sigma }^{2}\left( 12s_{\omega }^{2}-s_{\sigma }^{2} \right)}{15{{\left( 3s_{\omega }^{2}+s_{\sigma }^{2} \right)}^{2}}} \\ & \delta _{e}^{2}={{{\dot{e}}}^{2}}\left( \frac{s_{\omega }^{2}}{4}+\frac{5s_{\sigma }^{2}}{12}-\frac{4s_{\sigma }^{2}}{15\left( 3s_{\omega }^{2}+s_{\sigma }^{2} \right)} \right) \\\end{align}$ (5)
Assuming U is a unit vector along the f direction, the coordinate frame is transformed into the world coordinate system, then:
$\begin{align} & \omega =p+{{\omega }_{s}}f \\ & \sum{=\delta _{s}^{2}\left( f{{f}^{S}} \right)+}\delta _{s}^{2}\left( U-\frac{f{{f}^{S}}}{\left\| f \right\|_{2}^{2}} \right) \\\end{align}$ (6)
Next, encoding is performed based on ω and Π to facilitate the subsequent encoding of the Gaussian distribution. According to Eq. (3), the PE encoding matrix O and encoding formula ε(a) are obtained.
$\begin{aligned} & O=\left[\begin{array}{cccccccccc}1 & 0 & 0 & 2 & 0 & 0 & & 2^{M-1} & 0 & 0 \\ 0 & 1 & 0 & 0 & 2 & 0 & \cdots & 0 & 2^{M-1} & 0 \\ 0 & 0 & 1 & 0 & 0 & 2 & & 0 & 0 & 2^{M-1}\end{array}\right]^T, \\ & \varepsilon(a)=\left[\begin{array}{c}\operatorname{SIN}(O a) \\ \operatorname{COS}(O a)\end{array}\right]\end{aligned}$ (7)
Finally, the positional encoding on the multivariate Gaussian is computed. Based on the Gaussian formula of sine and cosine functions shown in Eq. (8) and the mean and variance encoding formula in Eq. (9), a closed-form solution can be further derived:
$\begin{aligned} & R_{a \sim V\left(\omega, \delta^2\right)}[\operatorname{SIN}(a)]=\operatorname{SIN}(\omega) \exp \left(-\left(\delta^2 / 2\right)\right) \\ & R_{a \sim V\left(\omega, \delta^2\right)}[\operatorname{COS}(a)]=\operatorname{COS}(\omega) \exp \left(-\left(\delta^2 / 2\right)\right)\end{aligned}$ (8)
$\begin{align} & {{\omega }_{\varepsilon }}=O\omega \\ & \sum{_{\varepsilon }}=O\sum{{{O}^{S}}} \\\end{align}$ (9)
Assuming the element-wise product of the two matrices is denoted by p, and the diagonal matrix of the covariance matrix is denoted by DI (Πε), the final positional encoding is obtained as:
$\varepsilon(\omega, \Pi)=R_{a \sim V\left(\omega_{\varepsilon}, \Pi_{\varepsilon}\right)}[\varepsilon(a)]=\left[\begin{array}{l}\operatorname{SIN}\left(\omega_{\varepsilon}\right) \circ \exp \left(-\left(\frac{1}{2}\right) D I\left(\Pi_{\varepsilon}\right)\right) \\ \operatorname{COS}\left(\omega_{\varepsilon}\right) \circ \exp \left(-\left(\frac{1}{2}\right) D I\left(\Pi_{\varepsilon}\right)\right)\end{array}\right]$ (10)
3.2 Input encoding optimization
Unlike traditional image generation tasks, 3D reconstruction of medical images requires special attention to eliminating inter-patient individual differences, and focusing on learning and reconstructing the spatial structure of the same type of tissues or lesion areas. Therefore, this paper introduces the idea of GLO, which realizes input encoding optimization by pairing medical images with a set of random vectors. In this method, each image in the medical image dataset is mapped to a corresponding random vector, thereby capturing individual differences among different images. For each specific medical image, this set of random vectors can represent the unique individual differences in the image, including minor variations in anatomical structures or personalized features of lesions. By using these random vectors as inputs, the network can better identify and process individual differences in medical images, and then focus on learning and reconstructing a unified 3D anatomical model.
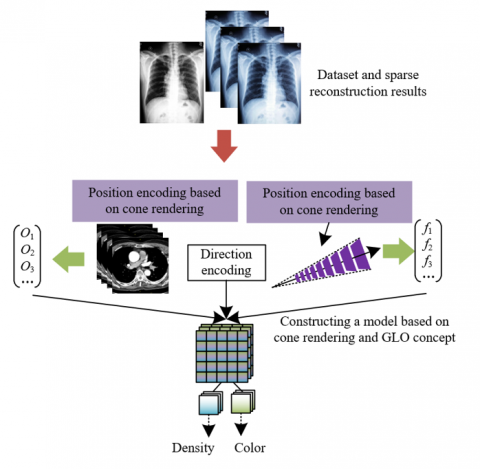
During the 3D reconstruction of medical images, the encoding optimization step based on the GLO idea first initializes a set of f-dimensional random vectors C = {c1, c2, ..., cv} for the medical image dataset {a1, a2, ..., av}, and pairs each image with its corresponding random vector to obtain a new dataset {(c1, a1), (c2, a2), ..., (cv, av)}. These vectors are input into a trained neural network, which learns to map these random vectors to the salient features in the images, thereby capturing the differences between images. This is especially important for 3D reconstruction of medical images, because images of different patients or the same patient at different times may have subtle differences, affecting disease diagnosis and progression assessment. Through this optimization, the model can focus on the shared structural features in the images rather than individual differences, thus enhancing the model's understanding and generation capability of anatomical structures during the reconstruction process. Figure 2 shows the adopted positional encoding optimization and input encoding optimization process.
Figure 2. Positional encoding optimization and input encoding optimization process
3.3 NeRF network construction based on encoding optimization
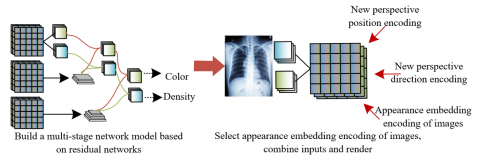
Lighting, exposure, and other external factors in medical images may affect the color performance of the image but do not affect the tissue density and anatomical structure in the image. Therefore, this paper draws on the GLO idea and assigns a 48-dimensional random vector to each medical image as an appearance embedding code, which is specially used to encode the impact of lighting and external condition changes on image color. Specifically, for each medical image, this appearance embedding code only acts on the color output part of the image to ensure that during the 3D reconstruction of the NeRF, the color part can more accurately reflect the influence of external environmental changes without interfering with the modeling of density and structure. Then, the original form of Eq. (2) can be transformed into:
$Z\left( e,u \right)=\int_{{{s}_{v}}}^{{{s}_{d}}}{S\left( s \right)\delta \left( e\left( s \right) \right)z\left( e\left( s \right),f,{{c}_{u}} \right)fs}$ (11)
In terms of implementation steps, for each ray sampling in the medical image dataset, the network inputs the corresponding appearance embedding code for each ray. In this way, the network can distinguish the external condition differences of each image from its internal density and structural information, thereby focusing on learning and reconstructing medical structural features such as organs and lesions in the image. For each medical image, the appearance embedding code is combined with the ray data to transmit the influence of external conditions such as lighting and exposure, without interfering with the NeRF network's modeling of density and anatomical structures. This separation of color and density can effectively reduce the interference of external factors on the 3D reconstruction results and improve the robustness and accuracy of the network in diverse medical image environments. Ultimately, this encoding-optimized NeRF network can accurately capture the 3D anatomical structures and lesion areas in images under various shooting conditions, achieving high-quality 3D reconstruction of medical images and supporting more accurate clinical diagnosis and treatment planning. Figure 3 shows the overall training process of the model.
Figure 3. Overall training process of the model
The experimental results shown in Figure 4 demonstrate that the SuperPoint algorithm has significant advantages in medical image feature point extraction, especially when facing complex and diverse medical images. This algorithm can not only identify common geometric structure features but also effectively extract feature points on smooth surfaces. Compared with traditional geometric feature extraction methods, SuperPoint can better handle low-texture regions, showing strong dispersion and robustness. Its excellent performance on smooth surfaces, especially in medical imaging applications, indicates that it can deal with more types of tissue and organ surfaces, avoiding the precision degradation caused by the neglect of these regions in traditional methods. Therefore, the SuperPoint algorithm provides strong support for improving the accuracy and reliability of medical image feature point matching.
Figure 4. Example of feature extraction results from medical images
Table 1. Feature extraction, matching, and reconstruction results of the proposed model
|
|
SuperPoint+SuperGlue |
SIFT |
SURF |
ORB |
|
|
Image 1 |
Keyframe Count |
43 |
|||
|
Avg. Match Num. |
236.24 |
146.36 |
138.65 |
168.95 |
|
|
Reconstructed Point Cloud Count |
9178 |
9125 |
9136 |
8124 |
|
|
Image 2 |
Keyframe Count |
42 |
|||
|
Avg. Match Num. |
245.36 |
215.36 |
178.26 |
168.62 |
|
|
Reconstructed Point Cloud Count |
12548 |
9158 |
6893 |
5326 |
|
|
Image 3 |
Keyframe Count |
53 |
|||
|
Avg. Match Num. |
425.36 |
412.56 |
213.56 |
128.63 |
|
|
Reconstructed Point Cloud Count |
12635 |
11256 |
11356 |
8124 |
|
As can be seen from Table 1, the feature extraction and matching method based on SuperPoint and SuperGlue performs better than traditional methods across different images. Specifically, for images 1, 2, and 3, the number of keyframes using SuperPoint and SuperGlue are 43, 42, and 53 respectively, all showing relatively high stability. In terms of the number of matches, the average match numbers of the SuperPoint+SuperGlue combination in images 1, 2, and 3 are 236.24, 245.36, and 425.36, respectively. Compared with SIFT (146.36, 215.36, 412.56), SURF (138.65, 178.26, 213.56), and ORB (168.95, 168.62, 128.63), the match number is significantly higher, indicating that the SuperPoint+SuperGlue combination can identify and match more feature points during feature extraction and matching, especially in complex scenes, offering better accuracy and robustness. In terms of reconstructed point cloud count, the SuperPoint+SuperGlue method also shows superior results across all images, particularly in image 1 and image 2, where the point cloud counts (9178, 12548) are higher than those of traditional methods, suggesting that this method can generate richer and more detailed reconstruction results in the 3D reconstruction process.
Table 2. Evaluation results of reconstructed images
|
|
SupePoint+SupeGlue |
SIFT |
SURF |
ORB |
|
|
Image 1 |
SSIM |
0.685 |
0.678 |
0.678 |
0.652 |
|
PSNR |
23.26 |
23.624 |
23.262 |
23.215 |
|
|
LPIPS |
0.348 |
0.356 |
0.345 |
0.378 |
|
|
Image 2 |
SSIM |
0.652 |
0.648 |
0.612 |
0.489 |
|
PSNR |
21.236 |
21.365 |
21.362 |
18.236 |
|
|
LPIPS |
0.335 |
0.389 |
0.489 |
0.552 |
|
|
Image 3 |
SSIM |
0.715 |
0.684 |
0.623 |
0.562 |
|
PSNR |
21.365 |
22.362 |
22.321 |
21.325 |
|
|
LPIPS |
0.156 |
0.187 |
0.226 |
0.245 |
|
1) PSNR
2) SSIM
3) MSSIM
Figure 5. Influence of the number of input images on reconstruction performance
According to the experimental results in Table 2, the feature point extraction and matching method based on SuperPoint and SuperGlue performs excellently in image reconstruction quality evaluation indicators. Specifically, in terms of Structural Similarity Index (SSIM), the values of the SuperPoint+SuperGlue combination in images 1, 2, and 3 are 0.685, 0.652, and 0.715, respectively, all superior to SIFT, SURF, and ORB. Particularly in image 3, the SSIM value of SuperPoint+SuperGlue is significantly higher than other methods, indicating that this method can better preserve the structure and details of the image. Regarding Peak Signal-to-Noise Ratio (PSNR), SuperPoint+SuperGlue also shows good performance across all images, especially in image 1 and image 2, where the PSNR values are 23.26 and 21.236, slightly lower than SIFT but higher than other methods. In addition, the Learned Perceptual Image Patch Similarity (LPIPS) results show that the SuperPoint+SuperGlue combination also performs better than other methods across all images. Especially in image 3, the LPIPS value is the lowest (0.156), indicating that this method can maintain a smaller perceptual difference during the reconstruction process, thereby providing a reconstruction effect closer to the real image.
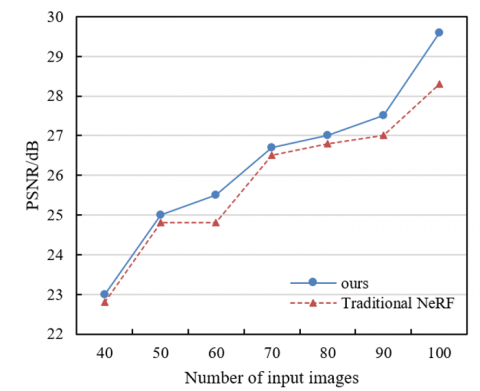
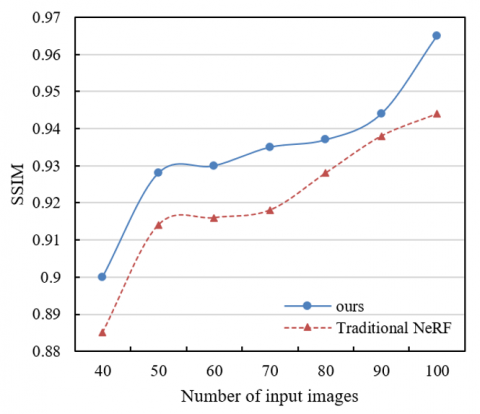
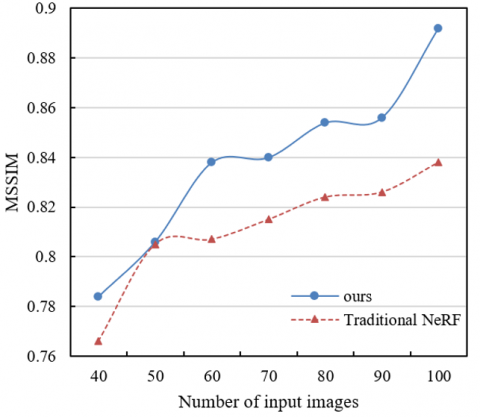
According to the experimental results shown in Figure 5, with the increase of the number of input images, the method proposed in this paper (i.e., the combination of SuperPoint+SuperGlue and NeRF) demonstrates significant improvements in all metrics, including PSNR, SSIM, and Mean SSIM (MSSIM). In terms of PSNR, as the number of input images increases from 40 to 100, the PSNR value of the proposed method gradually increases from 23 to 29.6, indicating that more input images help to improve the signal-to-noise ratio of the reconstructed image. In contrast, although the PSNR value of the traditional NeRF method also increases, its growth rate is slightly lower, rising from 22.8 to 28.32. Similarly, SSIM and MSSIM results show the same trend. For SSIM, the proposed method increases from 0.9 to 0.965, which is obviously higher than that of the traditional NeRF method (from 0.885 to 0.944). In terms of MSSIM, the proposed method increases from 0.784 to 0.892, while traditional NeRF increases from 0.766 to 0.838. These data indicate that with the increase of input image quantity, the improved method proposed in this paper can better capture and reconstruct image details, especially in the case of multiple image combinations, where the improvement in reconstruction performance is more significant.
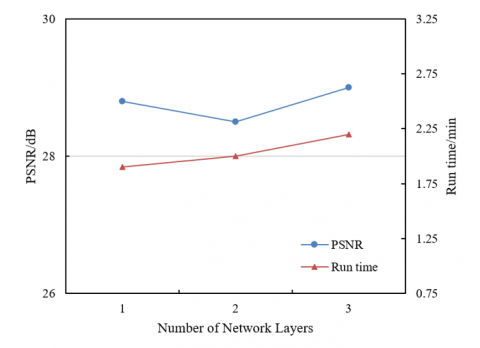
According to the experimental results shown in Figure 6, with the increase in the number of network layers, both PSNR and running time show some changes. In terms of PSNR, when the number of network layers increases from 1 to 3, the PSNR value slightly increases from 28.8 to 29, indicating that increasing the number of network layers helps to further improve the signal-to-noise ratio of the 3D reconstructed images. However, the improvement of PSNR brought by increasing the number of layers is relatively small, suggesting that under the given experimental conditions, the effect of increasing network layers on PSNR has a certain marginal effect. In terms of running time, with the increase in network layers, the running time increases from 1.9 seconds to 2.2 seconds, showing that the computational complexity and the time required increase as the number of network layers increases. Specifically, from 1 layer to 2 layers, the running time increases by 0.1 seconds, while from 2 layers to 3 layers, it increases by 0.2 seconds, reflecting that increasing the number of network layers will increase the computational burden to a certain extent.
Figure 6. Influence of different network layers on PSNR and running time
According to the results in Figure 7, with the increase of input image quantity, the maximum value, quartile, median, and minimum value of PSNR all show changing trends. As the number of input images increases from 40 to 100, the overall PSNR performance gradually improves, and the distribution range of PSNR becomes more concentrated. Specifically, when the number of images is relatively small (e.g., 40 or 50), the PSNR values show large fluctuations (e.g., maximum value up to 5.7, quartiles between 5.2 and 5.3), while with more input images (e.g., 80 or 100), the maximum value and quartiles become more stable and exhibit smaller fluctuations (maximum value around 6.1, quartiles between 5.2 and 5.4). In addition, the minimum value also decreases with the increase of input image quantity, indicating that more input images can effectively improve the worst-case quality of the reconstructed image.
Figure 7. Influence of the number of input images on MAE of image reconstruction
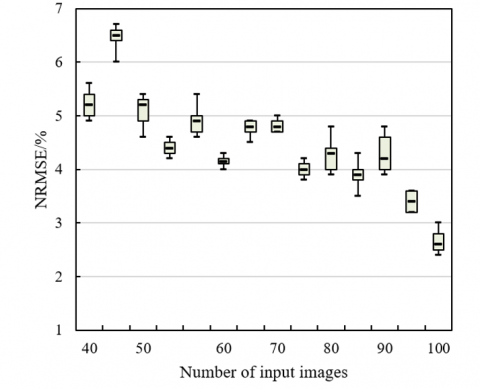
According to the experimental results shown in Figure 8, with the increase of input image quantity, the Normalized RMSE (NRMSE) values of the reconstructed images show different changing trends. When the number of input images is relatively small (e.g., 40 or 50), the NRMSE values are relatively high, and large fluctuations are observed in the maximum, quartile, median, and minimum values. For instance, under the condition of 40 input images, the maximum value is 5.6, the quartile is 5.4, the median is 5.2, and the minimum value is 4.9. However, as the number of input images increases (e.g., from 70 to 100), the fluctuation range of NRMSE gradually decreases, and the values show a decreasing trend. For example, when there are 100 input images, the maximum value drops to 4.3, the quartile decreases to 4.7, the median drops to 4.2, and the minimum value is 3.2. This indicates that with the increase of input images, the reconstruction error gradually decreases, and the quality becomes more stable and accurate.
Figure 8. Influence of the number of input images on NRMSE of image reconstruction
This paper mainly focused on the integration and innovation of two key technologies: first, the medical image feature point extraction and matching method based on SuperPoint and SuperGlue; second, the medical image 3D reconstruction method based on NeRF. By combining these two technologies, this paper proposed a new method for 3D reconstruction and quantitative analysis of medical images, aiming to improve the accuracy and efficiency of medical image 3D reconstruction. In terms of feature point extraction and matching, the advantages of SuperPoint and SuperGlue technologies can effectively improve the accuracy and robustness of feature point matching, which is crucial for the accurate analysis of medical images. At the same time, using NeRF technology for 3D reconstruction can more realistically and meticulously reconstruct the 3D structures in medical images, significantly improving the quality of image reconstruction. Through the analysis of experimental results, the proposed method in this paper showed excellent performance in multiple evaluation indicators, especially in image quality evaluation indicators such as PSNR, SSIM, and MSSIM, demonstrating that as the number of input images increases, the quality of image reconstruction gradually improves. In addition, through the analysis of different network layers, the number of input images, and NRMSE, this paper further proved the importance of increasing the number of input images to improve the accuracy of 3D reconstruction, indicating that more input data can enhance the stability and detail restoration of the reconstructed images. These results validated the potential of the proposed method in improving the accuracy and efficiency of 3D reconstruction of medical images and provide a new technical path for medical image analysis and clinical application.
However, this paper also has certain limitations. First, although increasing the number of input images can improve image quality, the consumption of computing resources and the increase in running time need to be further optimized. In addition, the application of the proposed method is mainly concentrated in the field of medical images, and its applicability and universality in other fields still need to be further verified. Secondly, although the SuperPoint and SuperGlue methods perform well in feature extraction and matching, there is still room for improvement in processing images with high noise or low quality. Future research directions can be carried out from the following aspects: first, the structure of the neural network can be further optimized to improve the computational efficiency of the algorithm and reduce the time required for large-scale data processing; second, more feature extraction and matching methods can be explored to enhance the adaptability and robustness of the method in different types of medical images; finally, other deep learning technologies (such as generative adversarial networks, CNN, etc.) can be considered to combine with the method proposed in this paper to further improve the quality and accuracy of 3D reconstruction and expand its application in other fields.
[1] Priya, S., Santhi, B. (2021). A novel visual medical image encryption for secure transmission of authenticated watermarked medical images. Mobile Networks and Applications, 26(6): 2501-2508. https://doi.org/10.1007/s11036-019-01213-x
[2] Fakheri, S., Yamaghani, M., Nourbakhsh, A. (2024). A densenet-based deep learning framework for automated brain tumor classification. Healthcraft Frontiers, 2(4): 188-202. https://doi.org/10.56578/hf020402
[3] Chennamma, H.R., Basavarajappa, B.K.H., Basavaraju, M., Sowmya, K.N., Kumar, A.V.S. (2024). Medical image authentication using statistical correlations. International Journal of Safety and Security Engineering, 14(5): 1487-1493. https://doi.org/10.18280/ijsse.140516
[4] Arif, M., Wang, G. (2020). Fast curvelet transform through genetic algorithm for multimodal medical image fusion. Soft Computing, 24(3): 1815-1836. https://doi.org/10.1007/s00500-019-04011-5
[5] Zhang, Y.L. (2023). Multi-modal medical image matching based on multi-task learning and semantic-enhanced cross-modal retrieval. Traitement du Signal, 40(5): 2041-2049. https://doi.org/10.18280/ts.400522
[6] Narayan, V., Faiz, M., Mall, P.K., Srivastava, S. (2023). A comprehensive review of various approach for medical image segmentation and disease prediction. Wireless Personal Communications, 132(3): 1819-1848. https://doi.org/10.1007/s11277-023-10682-z
[7] Hou, X.X., Liu, R.B., Zhang, Y.Z., Han, X.R., He, J.C., Ma, H. (2024). NC2C-TransCycleGAN: Non-contrast to contrast-enhanced CT image synthesis using transformer CycleGAN. Healthcraft Frontiers, 2(1): 34-45. https://doi.org/10.56578/hf020104
[8] Stout, S.D., Brunsden, B.S., Hildebolt, C.F., Commean, P.K., Smith, K.E., Tappen, N.C. (1999). Computer-assisted 3D reconstruction of serial sections of cortical bone to determine the 3D structure of osteons. Calcified Tissue International, 65: 280-284. https://doi.org/10.1007/s002239900699
[9] Sarmah, M., Neelima, A., Singh, H.R. (2023). Survey of methods and principles in three-dimensional reconstruction from two-dimensional medical images. Visual Computing for Industry, Biomedicine, And Art, 6(1): 15. https://doi.org/10.1186/s42492-023-00142-7
[10] Wang, W.J., Ge, Z.H., Jiang, M., Li, C.L. (2009). The 3D reconstruction technology for the bone SCT image. Materials Science Forum, 626: 547-552. https://doi.org/10.4028/www.scientific.net/MSF.626-627.547
[11] An, H., Khan, J., Kim, S., Choi, J., Jung, Y. (2024). The Adaption of recent new concepts in neural radiance fields and their role for high-fidelity volume reconstruction in medical images. Sensors, 24(18): 5923. https://doi.org/10.3390/s24185923
[12] Joseph, S.S., Dennisan, A. (2020). Three dimensional reconstruction models for medical modalities: A comprehensive investigation and analysis. Current Medical Imaging, 16(6): 653-668. https://doi.org/10.2174/1573405615666190124165855
[13] Bodapati, J.D., Ahmed, S.F., Chowdary, Y.Y., Sekhar, K.R. (2023). A deep convolutional neural network framework for enhancing brain tumor diagnosis on MRI scans. Information Dynamics and Applications, 2(1): 42-50. https://doi.org/10.56578/ida020105
[14] Liu, C., Zhang, Z., Lin, H., Hu, Y., Ng, E., Chen, D., Xie, N. (2019). Pyramidal optical flow method-based lightweight monocular 3D vascular point cloud reconstruction. IEEE Access, 7: 167420-167428. https://doi.org/10.1109/ACCESS.2019.2953818
[15] Rehman, A., Butt, M.A., Zaman, M. (2022). Liver lesion segmentation using deep learning models. Acadlore Transactions on AI and Machine Learning, 1(1): 61-67. https://doi.org/10.56578/ataiml010108
[16] D’Acunto, M., Benassi, A., Moroni, D., Salvetti, O. (2016). 3D image reconstruction using Radon transform. Signal, Image and Video Processing, 10: 1-8. https://doi.org/10.1007/s11760-014-0693-9
[17] Ahmad, B., Floor, P.A., Farup, I., Andersen, C.F. (2024). Single-image-based 3D reconstruction of endoscopic images. Journal of Imaging, 10(4): 82. https://doi.org/10.3390/jimaging10040082
[18] Abaspur Kazerouni, I., Dooly, G., Toal, D. (2020). Underwater image enhancement and mosaicking system based on A-KAZE feature matching. Journal of Marine Science and Engineering, 8(6): 449. https://doi.org/10.3390/jmse8060449
[19] Van der Velden, B.H., Kuijf, H.J., Gilhuijs, K.G., Viergever, M.A. (2022). Explainable artificial intelligence (XAI) in deep learning-based medical image analysis. Medical Image Analysis, 79: 102470. https://doi.org/10.1016/j.media.2022.102470
[20] Yaqub, M., Jinchao, F., Arshid, K., Ahmed, S., Zhang, W., Nawaz, M.Z., Mahmood, T. (2022). Deep learning-based image reconstruction for different medical imaging modalities. Computational and Mathematical Methods in Medicine, 2022(1): 8750648. https://doi.org/10.1155/2022/8750648
[21] Ekmekci, C., Cetin, M. (2022). Uncertainty quantification for deep unrolling-based computational imaging. IEEE Transactions on Computational Imaging, 8: 1195-1209. https://doi.org/10.1109/TCI.2022.3233185
[22] Miranda, D., Thenkanidiyoor, V., Dinesh, D.A. (2023). Detecting the modality of a medical image using visual and textual features. Biomedical Signal Processing and Control, 79: 104035. https://doi.org/10.1016/j.bspc.2022.104035
[23] Mohammadi, S.M., Helfroush, M.S., Kazemi, K. (2012). Novel shape-texture feature extraction for medical X-ray image classification. International Journal of Innovative Computing, Information and Control, 8(1B): 659-676.
[24] Rajaei, A., Dallalzadeh, E., Rangarajan, L. (2015). Symbolic representation and classification of medical X-ray images. Signal, Image and Video Processing, 9: 715-725. https://doi.org/10.1007/s11760-013-0486-6