Zeeshan Ali Haq![]() | Zainul Abdin Jaffery*
| Zainul Abdin Jaffery*![]() | Shabana Mehfuz
| Shabana Mehfuz![]()
© 2024 The authors. This article is published by IIETA and is licensed under the CC BY 4.0 license (http://creativecommons.org/licenses/by/4.0/).
OPEN ACCESS
Computer Vision based automatic system for grading of fruits constitutes an important topic among researchers. This, stems from the fact that current process, which is mostly manual in nature is not providing the aspired outcome. For reasons not limited to uncertainty handling and hybrid modeling approaches, an apple grading model is developed in this paper, combining the strength of Fuzzy Logic System (FLS) and Neural Network. In this paper, Adaptive Neuro-Fuzzy Inference System (ANFIS) based automated system using computer vision is developed for quality grading of apples. Thermal imaging is used for dataset development. The dataset consists of 1130 thermal image of apples. Five categorical features including color, shape, gradient, texture and statistical based features are extracted. On the basis of degree of defectiveness, ANFIS based classifier grade apples into different classes. The robustness of the proposed model is evaluated using confusion matrix along with False Positive Rate (FPR), class sensitivity and precision, specificity, and overall accuracy of the model. For determining the effectiveness of the model, a comparative analysis with another model is presented in this paper. After the analysis, it is observed that the ANFIS based classifier using thermal imaging techniques recommended for grading of fruit in an automated system.
thermal image, image procession, fuzzy neural network, ANFIS, neural network, machine learning
Agriculture industry is one of the largest industries in India in terms of Production, growth, and consumption of fruits and vegetables. The product quality assessment is an important factor for consistent and profitable marketing. Fruits experience varying degrees of stress as they are transported from the farm to the market, depending on the conditions in which they are handled, stored, transported, and harvested. These stress on fruits induces defects which are not only extrinsic in nature but propagates throughout the fruit body over a period of time. Therefore, detection of defect and segregation of fruits based on those defects is an important aspect in development of quality assessment model. Also, the physical quality of the fruit plays an important role in increasing its demand. It is estimated that loss occurred to the agro-products based industries is in billions of dollars, therefore, quality assessment and segregation of products is an important aspect in optimizing the agro-products based industries [1].
The process of quality assessment and segregation of defective fruits from healthy or good quality fruits is in practice since a very long time. However, these processes have been manual in nature and suffers from different levels of drawbacks. These drawbacks include being subjective to human interpretation and perception, labor intensive process leading to increased cost for large scale fruit processing and errors, time consuming and inefficient, contamination in fruits condition due to improper hygiene maintenance, etc. Therefore, it is imperative to grade and assess fruit quality through an automated computer vision system. This results in reduction in the cost of production and provides agro-products with better quality products.
Apples are a valuable part of human diet throughout the world. They are rich source of minerals and vitamins and are advised by medical practitioners to be included in daily requirement [2]. In this paper, a computer vision-based model is developed for grading of apples into different classes labeled according to their varied degree of defectiveness. The Adaptive Neuro-Fuzzy Inference System (ANFIS) model is used for grading of apples and segregating them into different classes. ANFIS combines the human-like logical reasoning based on Fuzzy Logic System (FSL) and neural network based computational capabilities for grading the quality of the apples.
Apple has been a widely studied fruit for detection and classification of defects and bruises. Visible and near infrared spectroscopy imaging techniques are used in the following studies [3-7]. In these studies, different analytical strategies are used including Partial Least Square Discriminant Analysis (PLSDA), Successive Projection Algorithms (SPA), Selective ensemble learning based on feature selection (SELFS) Partial Least Square Regression (PLSR), internal PLSDA (iPLSDA), and Linear Discriminant Analysis (LDA). These techniques were used for analyzing images of apples for bruises, moldy core, sunburn or internal browning. Using the Hyperspectral imaging system [8-11], bruise detection and classification has been performed. The classification model and analytical tools employed by these researchers included Soft independent modeling of class analogy (SIMCA), LDA, Support Vector Machine (SVM), Principal component Analysis (PCA), Improved watershed segmentation algorithm (IWSM), Stochastic Gradient Descent (SGD), Decision Tree (DT), Random Forest (RF), Gradient Tree Boosting (GTB). A smell based system, E-Nose is also used by some researchers for impact injury detection in apples [12].
Other than apples a wide range of study has been performed over different varieties of fruits using different imaging techniques, classification models, and analytical methods [13-20]. Some of the researchers and their work include detection and classification of bruise, microbial infection, scar tissue and frost damage, rot and rust disease, mechanical damage etc. The fruit of interest in these studies include Kiwi Fruit, Tomato, Orange, Olive, Pear, Peach, and Blueberry. Researchers have used Infrared Imaging system for bruise detection in different types of fruits including Orange, apple, pears etc. these researches provided an insight that these imaging techniques have potential for accurate defect detection [21]. It is observed that fruits belonging to different species and/or cultivars shows difference in temperature variation of bruised and non-bruised regions [22]. Therefore, it is possible to detect early bruising in fruits and the depth to which the bruise has propagated [23, 24].
In this study, the imaging system employed is based on thermal spectrum instead of visible spectrum. It is a useful, non-invasive, technique which Transform an object's thermal radiation into the distribution of its surface temperatures [25]. There is a temperature difference between the apple's healthy and unhealthy tissues. This is the primary reason for employing a thermal imaging system. This imaging system performs comparatively better for poorly illuminated fruits and fruits having darker color combination as the imaging system is not based on the ambient temperature but on the temperature radiation from the tissue of the fruit [26].
In the study of Zeng et al. [21], a thermal imaging system was designed for detection and classification of defect of pears. For the analysis of the thermal images, gray level co-occurrence matrix was used and growth of defect over a period of 10 days was studied. Analysis to develop postharvest precision steam disinfection technologies for carrots using thermal imaging system was developed [27]. With the help of imaging technique, surface quality of waxed apples was determined in the study of Veraverbeke et al. [28]. Some studied have employed the imaging technique to detect the injury sustained on the surface of apples and tomatoes before visible to naked eye [29, 30]. Another study was performed on the cold stored guava to determine the mechanical injury introduced intentionally. In this study, instead of supplying a hot stream of air, after injury, guava was introduced to the process of refrigeration [31]. Thermal imaging achieved the detection of bruised tissue, even the depth of tissues, through fast Fourier analysis acquired of the data acquired from apple surface [8]. Thermography of pears shows that greater phase difference shows greater damage to pears which can be used to estimate the depth of the bruise [32]. Combining the logistic regression classifier along with waveform feature set, bruise detection of blueberry was performed [33] using thermal imaging technique.
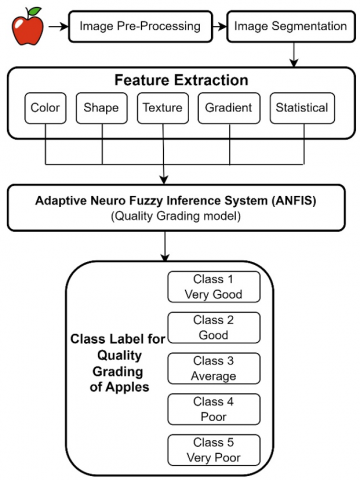
In this paper, Image acquisition of apples in thermal spectrum, to generate a dataset of apples, a thermal camera TiS45 by Fluke Corporation, USA is employed. Acquired images are used for pre-processing where resizing of images is performed along with de-noising of images. From these pre-processed images, five categories of features are extracted including color, shape, texture, and gradient based, along with statistical features. These features are used as an input the ANFIS model. The apple is categorized into five classes by this Fuzzy Logic System (FLS) based model according to the different levels of defect present. The robustness of the proposed model is evaluated using the confusion matrix and determining the classification report from it. The flow chart of the proposed model is shown in Figure 1. The usefulness of this model is determined by comparing the results of the proposed model against results obtained in the study of Kaur et al. [34]. The model proposed, APRE [34] is simulated for the dataset of images developed in thermal spectrum.
The flow of this paper based on five following sections. Section I includes the introduction to the quality assessment and defect detection of fruits. This section also presents some of the work performed by the researchers in the related field. Section II discusses the details methodology including the process of dataset generation and development of the grading classifier model. Section III discuss about the simulation result of the model discussed. This section also presents the comparative analysis with another standard model. The paper is concluded in Section IV.
Figure 1. Flow diagram of the proposed mode
Different stages of proposed methodology are briefly explained in this section. Flow diagram of the proposed model for defect detection and quality grading of apples is shown in Figure 1.
2.1 Hardware and software
A thermal imaging system shown in Figure 2 consist of thermal imager, device for stream of hot air, processing system, and a platform to mount the apple. This system employs a thermal imager, TiS45 by Fluke Corporation, USA, which captures the thermal radiation emitted by apples. These thermal radiations are transformed into an equivalent thermal image and displayed on the system. The camera used in this study has the operating temperature range of -10℃ to +50℃, focal area of 160×120 pixel size, and a spectral range between 7.5µm to 14µm. the surrounding temperature of apple at the time of image capture is maintained at 30℃-35℃ and standard emissivity value of 0.95. The fruit of interest, apple is placed on a platform for imaging purpose. Further, pulsed phase thermography is employed where a hot stream of hot air is supplied to the object and image is captured after switching off the air supply. This measures the rate of decay of temperature and thus highlighting the tissue with different quality as a function of temperature differential. The distance between the apple and the camera lens is maintained at 20cm. Once the image has been captured, it is stored in a processing system in a form of a dataset.
For development of defect detection and classification model, python programming tool is used on Google Colab Jupyter notebook with 32GB of main memory, Nvidia A100 GPU with 16GB RAM and Intel Xeon CPU (Subjective to availability). Figure 2 shows the thermal imaging system.
Figure 2. Thermal imaging system
2.2 Dataset development
For dataset generation, different qualities of apples were obtained from the market. The apples were stored in a in a cool place at a temperature maintained at 14℃ for seven days. The thermal image of apples was captured over a period of seven days. Each day, before obtaining the thermal images, the apples were removed from the storage unit so as to bring their temperature in range of 25℃ - 30℃. On attainment of this condition, thermal imaging of apple was performed. Each apple was placed on a raised platform, and the distance between the lens of the camera and the apple was maintained at 18 inches. Also, before capturing of thermal image, a stream of hot air was made incident onto the apple for 30s and the decay in the temperature radiated from the specimen was recorded in a form of thermograph. Once the thermographs were obtained and stored in the processing unit. The complete imaging process was performed in a laboratory having controlled ambient temperature of 30℃ - 35℃. The detailed composition of the images of apples based on their quality are graded as presented in Table 1. The diagrammatical representation of the imaging system is shown in Figure 2.
Table 1. Number of images considered for different classes of quality for grading
|
Quality Grade of Apple |
No. of Images for Training Dataset (80%) |
No. of Images for Testing Dataset (20%) |
Total No. of Images |
Class Type |
|
Very Good |
256 |
64 |
320 |
Class 1 |
|
Good |
168 |
42 |
210 |
Class 2 |
|
Average |
200 |
50 |
250 |
Class 3 |
|
Poor |
136 |
34 |
170 |
Class 4 |
|
Very Poor |
144 |
36 |
180 |
Class 5 |
In this study, total size of data set includes 1130 thermally generated images of different quality of apples. In this study, five different class of apples are considered as shown in Table 1. Total data set is split into two parts: training and testing datasets in 80 – 20% split ratio respectively. The very good quality of apples is labeled as class 1 comprising total of 320 thermally generated images. Similarly, of good quality of apples under class 2 label, there are 210 thermally generated images. For average quality of apples under class 3 label, there are 250 thermally generated apples. Under class 4 and class 5 label representing poor and very poor quality of apples total no of thermally generated images are 170 and 180 respectively. These images are used for the purpose of defect detection and classification.
2.3 Image pre-processing
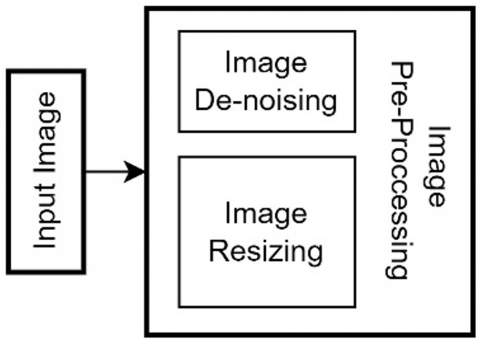
The images captured using the imaging system shown in Figure 2 are pre-processed using two techniques. De-noising technique is used to remove the unwanted disturbance induced while image acquisition. Another pre-processing technique employed is the image resizing which reduces the computation cost associated with higher sized images. The image pre-processing flow diagram is shown in Figure 3.
Figure 3. Steps for image pre-processing
2.4 Feature extraction
The pre-processed images are used for extraction of features. These pre-processed images are segmented for the purpose of removal of irrelevant objects in the background. This further impacts the classification accuracy of the model. Otsu’s threshold based image segmentation technique is used. In this technique, the histogram of the images is generated which shows the distribution of pixels. Peak values of the histogram are considered for determining a threshold value for segmentation. All the pixels having intensity value higher than the threshold value are set to white pixel intensity value else they are set to black pixel intensity value. This process generates an image which consists of only the object of interest (apple in this study), and rest everything in the image is considered as a background. This technique performs the automatic thresholding.
As shown in Figure 1, five categorical features are extracted from the segmented images. A discussion of these features is presented here. As presented in Table 2, each category of feature is quantified using several of the parameters.
Table 2. List of features used for quality assessment of apples
|
Feature Type |
Feature Name |
Feature Representation |
|
Color Based Feature |
Skewness |
$\alpha_{C 1}$ |
|
Means |
$\alpha_{C 2}$ |
|
|
Variance |
$\alpha_{C 3}$ |
|
|
Statistical Feature |
Kurtosis |
$\varepsilon_{s 1}$ |
|
Energy |
$\varepsilon_{s 2}$ |
|
|
Entropy |
$\varepsilon_{s 3}$ |
|
|
Shape Based Feature |
Area |
$\boldsymbol{\delta}_{S 1}$ |
|
Perimeter |
$\boldsymbol{\delta}_{S 2}$ |
|
|
Aspect Ratio |
$\boldsymbol{\delta}_{S 3}$ |
|
|
Eccentricity |
$\boldsymbol{\delta}_{S 4}$ |
|
|
Solidity |
$\boldsymbol{\delta}_{S 5}$ |
|
|
Circularity |
$\boldsymbol{\delta}_{S 6}$ |
|
|
Centroid |
$\boldsymbol{\delta}_{S 7}$ |
|
|
Texture Based Feature |
Gray Level Co-Occurrence Matrix (GLCM) |
$\boldsymbol{\beta}_{\boldsymbol{T} 1}$ |
|
Gradient Based Feature |
Histogram of Oriented Gradient (HOG) |
$\rho_{G 1}$ |
Color based features of the object are determined using the skewness, Means, and Variance of the image. These parameters are obtained from the histogram of the image. Similarly, features such as Kurtosis, Energy, and Entropy are used to compute the statistical based feature of the image. The parameters used to determine the shape of the object are features such as Area, Perimeter, Aspect Ratio, and others. For texture based and gradient based features, only one parameter was determined i.e., GLCM and HOG respectively. These features are extracted from the input image using SciPy library of the Python programming language. For any histogram of an image, skewness is determined using Eq. (1).
$S=\frac{\sum_{i=1}^N\left(x_i-\bar{x}\right)^3}{N \cdot \sigma^3}$ (1)
where, N is the number of pixels in the image, $x_i$ is the pixel with intensity value i, $\bar{x}$ is the average of pixel intensity values, $\sigma$ is the standard deviation of the pixel intensities. Another feature is kurtosis which is a statistical based feature of an image. It also analyses the distribution of pixel intensities in an image. It measures the tailedness of the probability distribution compared to the Gaussian distribution or bell curve. Again, for any histogram of an image, Kurtosis feature can be determined using Eq. (2).
$K=\frac{\sum_{i=1}^N\left(x_i-\bar{x}\right)^4}{N \cdot \sigma^4}-3$ (2)
2.4.1 Shape based features
These are used to describe the image. These features capture the information about the image based on the geometric properties of object within the image. These features are most suited for object analysis, detection, and classification. Some of the shape features used in this paper are area, perimeter, aspect ratio, eccentricity, solidity, circularity and centroid.
2.4.2 Texture based feature
Another feature used in this study which determines the texture of the image based on its properties such as contrast, homogeneity, and correlation. This feature is the function of spatial components of the image using the pixel intensity values. For this feature, Gray Level Co-Occurrence Matrix (GLCM) is determined for apple defect detection and classification.
2.4.3 Gradient based feature
This feature determined from the image pixel value. It presents the gradient of pixel value. In this study, histogram of Oriented Grading (HOG) features is obtained from the thermally generated image of apples. These features are useful in determining the edges, contours, and other structural information contained in the image.
2.5 Adaptive neuro-fuzzy inference system based classifier
The defect in the apples cannot be measured as a crisp value and require a fuzzy based classification system. The color of the defect varies from light yellow to brown to dark brown to black in certain situations. Since in this study, thermal images are considered, these colors are represented by the temperature they radiate. The lighter the color of defect, the temperature differential between good tissue and defect tissue of apple is smaller. Thus, to grade the quality of apple as to how much defective the apple is, fuzzification is required. Therefore, this problem is addressed precisely using Adaptive Neuro-fuzzy Inference System (ANFIS).
The rules for determining the grading quality of the apple are using Fuzzy Logic system is developed using three features as an input to the ANFIS model. Color based features provide the different stages of quality of apples. Color based features are histogram based features which gives the range of color intensity for different channels. For this study three different color intensities are considered: red, yellow, and brown Shape based features provide two information about the apple: the shape of the apple and the size of the apple. The shape is determined by taking the ratio of the apple’s major and minor axis. Round shape is considered for ratio closer to unity otherwise it is considered as not round. The size of the apple is determined by considering the major axis as the diameter of the apple. For major axis to be 60mm (with 15% tolerance level) the apple is considered to be a small, 85mm (with 15% tolerance level) the apple is considered to be a medium size apple, and for 110mm (with 15% tolerance level) the apple is considered as a large apple. Texture based feature provides the texture information about the apple based on Gray Level Co-occurrence matrix (GLCM). The basis on which different quality grading of apple is considered is defined in Table 3.
The definition provided in Table 3, the fuzzy reasoning system has an output $f$, based on five inputs representing each feature. In the case of first order ANFIS model (model type is Sugeno), there are multiple rules and a sample of these rules is given in Eq. (3). Let the input be represented by l, m, n, o, and p, then the $i^{t h}$ sample rule is given by Eq. (3). In this equation a, b, c, d, and e are representing the color shape, size, texture, and Gradient features respectively.
$i^{\text {th }}$ Rule:
if $l$ is $a_i \cap m$ is $b_i \cap n$ is $c_i \cap$ o is $d_i \cap p$ is $e_i$ then
$f=v a_i+w b_i+x c_i+y d_i+z e_i+r_i$ (3)
The ANFIS classifier model used in this paper is based on five layer architecture. The four features namely color, shape, size, and texture are used as an input to the model. These features have crisp values which are fuzzified using the membership function. The dataset is split in the ratio of 80-20 with 80% of images (904 thermal images) used for training of the model and remaining 20% of images (226 thermal images) used for the testing of the classification model. This split was a hard split with 904 thermal images selected randomly for training the remaining 226 images were not part of the training process. These 226 images were used only for the testing of the model. Figure 4 shows a block diagram of ANFIS based classifier.
Table 3. Definition for different classes for quality grading of apple
|
Classes |
Features |
Quality Percentage |
Quality Grading |
||||
|
Color |
Shape |
Size |
Texture |
HOG |
|||
|
Class 1 |
Red (90-100%) |
Round |
large |
Smooth |
Low |
100-80% |
Very Good |
|
Class 2 |
Red (70-90%) Yellow (10-30%) |
Round |
large |
Smooth |
Low |
60-79% |
Good |
|
Class 3 |
Red (50-70%) Yellow (20-40%) Brown (5-10%) |
Round |
Medium |
Mild |
Average |
40-59% |
Average |
|
Class 4 |
Red (30-50%) Yellow (40-60%) Brown (15-30%) |
Not-round |
Medium |
Mild |
High |
20-39% |
Poor |
|
Class 5 |
Red (10-30%) Yellow (60-80%) Brown (30-50%) |
Not-round |
Small |
Harsh |
High |
0-19% |
Very Poor |
Figure 4. Architecture for ANFIS based classifier
Layer 1: This layer takes the Crisp input from the dataset and translates them into a fuzzy dataset using membership function. In this paper Gaussian membership function is used. The relationship transforming the crisp value to the fuzzy value is given by Eq. (4).
$\Gamma_{1, i}=\mu_{l, i}(x)$ (4)
where, Γ is the output of layer 1, $\mu$ is the membership function operator, and $x$ is the crisp input.
Layer 2: Each node in this layer is a fixed node and acts as a simple multiplier. This layer makes the ‘IF’ part of the ‘IF-THAN’ rule making system. The output of this layer is also called as the firing strength of the rule. Eq. (5) relates the output of the first layer as an input to the second layer and generates the respective output.
$\Gamma_{2, i}=\mu_{l, i}(x) \cdot \mu_{m, i}(y)$ (5)
Layer 3: Each node in this layer is adaptive in nature. Each node calculates the ratio of firing strength of that node to the sum of firing strength of all the nodes. This layer fuzzifiers the rule-based construction. This layer takes the input from the second layer and provides the respective output based on Eq. (6).
$\Gamma_{3, i}=\frac{\Gamma_{2, i}}{\sum_{i=1}^n \Gamma_{2, i}}$ (6)
Layer 4: Each node in this layer is also of adaptive nature. This layer makes the decision of the ANFIS structure.
$\Gamma_{4, i}=\Gamma_{3,1}\left(P_i \cdot x+q_i . y+r_i\right)$ (7)
where, $P_i, q_i$, and $r_i$ are called as the consequent parameters.
Layer 5: It is a single fixed node. In this layer, all the incoming inputs are added. This layer de-fuzzifiers the output.
$\Gamma_{5, i}=\sum_{i=1}^n \Gamma_{3, i} f_i$ (8)
2.6 Parameters for performance evaluation of classifier
The evaluation of the model developed for defect detection and quality grading of apples is performed using the confusion matrix which consist of TP, FP, TN, and FN. Along with confusion matrix, other parameters include Precision, Sensitivity, F-1 Score, Specificity, and overall accuracy. These parameters are discussed in this section.
2.6.1 Confusion matrix
It is an error matrix used as a mean of evaluating the multiclass classification problem. It helps in determining how well the system is able to classify objects into their respective classes. The confusion matrix is a very important tool in understanding the correct and erroneous predictions. For development of confusion matrix, four parameters are required: True Positive (TP), True Negative (TN), False Positive (FP), and False Negative (FN). For a binary classification, it is easier to determine these parameters. However, for a multiclass classification, as the case in this paper, it is slightly more complex. A sample of confusion matrix is shown in the Table 4.
Table 4. Confusion matrix for multiclass classification
|
|
Predicted Class |
|||||
|
Actual Class |
|
Label 1 |
Label 2 |
Label 3 |
Label 4 |
Label 5 |
|
Label 1 |
Cell 1 |
Cell 2 |
Cell 3 |
Cell 4 |
Cell 5 |
|
|
Label 2 |
Cell 6 |
Cell 7 |
Cell 8 |
Cell 9 |
Cell 10 |
|
|
Label 3 |
Cell 11 |
Cell 12 |
Cell |
Cell |
Cell 15 |
|
|
Label 4 |
Cell 16 |
Cell 17 |
Cell |
Cell |
Cell 20 |
|
|
Label 5 |
Cell 21 |
Cell 22 |
Cell |
Cell |
Cell 25 |
|
For multiclass classification problem, the parameters are defined for class label 1 as following:
True Positive (TP). The predicted value is same as the actual value which is cell 1 for class label 1 in Table 4.
True Negative (TN). This value is the sum of all the cells except those cells which belong to the class label which is being considered. For class label 1 in Table 4, true negative is the sum of cell 7 to 10, cell 12 to 15, cell 17 to 20, and cell 22 to 25.
False Positive (FP). It is the sum of those cell which belong to the wrongly classified cells for that particular class label. For class label 1 in Table 4, this is determined by the sum of cell 2 to 5.
False Negative (FN): It is the sum of those predicted values which belong to different actual class labels. For class label 1 in Table 4, this value is the sum of cell 6, cell 11, cell 16, and cell 21.
Analyzing the data obtained from confusion matrix, the classification report is compiled which presents different set of performance evaluation parameters of the classification model. These parameters as discussed below:
2.6.2 False Positive Rate (FPR)
It is ratio of images classified into a particular class when they actually belong to a different class. Mathematically FP rate is determined by using Eq. (9).
$F P \ Rate =\frac{F P}{F P+T N}$ (9)
2.6.3 Sensitivity
It is the model’s ability to classify an object to a particular class accurately as defined by Eq. (10). It is also called as the true positive rate or recall.
$Sensitivity =\frac{T P}{T P+F N}$ (10)
2.6.4 Precision
It is the model’s ability to predict an object to a particular class among all the objects which are classified to that particular class as defined by Eq. (11).
$Precision =\frac{T P}{T P+F P}$ (11)
2.6.5 Specificity
It is defined as the actual negative classes which are accurately identified and is determined using Eq. (12).
$Specificity =\frac{T N}{T N+F P}$ (12)
2.6.6 Accuracy
The overall accuracy of the model is determined using Eq. (13). It is defined as the total number of true predictions to the total number of predictions.
$Accuracy =\frac{T P+T N}{T P+T N+F P+F N}$ (13)
3.1 Confusion matrix
In this paper, the robustness of the model is determined based on the correct mapping of prediction of objects to actual class label. With the help of predicted values, a comparison is obtained between the actual class and the predicted class label. This comparison is presented in the form of a confusion matrix. The confusion matrix constitutes of four different parameters including TP, FP, TN, and FN. The class wise mapping of actual class and predicted class constituting the confusion matrix is shown in Table 5.
As mentioned, in Table 1, for class label 1 which represents very good quality of apples. Total 256 thermal images constitute the training data set. Off these 256 thermographs, 238 images are classified correctly whereas remaining 18 images are classified incorrectly. Similarly, Table 5 represents the correct and incorrect classification of images from the training dataset for different class labels. Based on the classification, as mentioned in the confusion matrix, Table 6 presents a breakdown of these data values into its conceptual parameters of TP, FP, TN, and FN respectively. Again, considering the classification of very good quality of apples, i.e., the class 1 label, there are total of 256 thermal images constituting the training dataset. The objects which belong to class label 1 and are also predicted correctly, represents the TP parameter. The proposed model is able to correctly classify 238 images of very good quality of apples. All those images belong to category other than class label 1, which are correctly classified constitutes the TN parameter of the confusion matrix. In this study, for class label 1, the value of TN is 635. Thermal images of apples belonging to class 1 label, but are incorrectly classified into different class labels are termed as FN.
Table 5. Confusion matrix of the proposed ANFIS model for quality grading of apple
|
Actual Class of Apple |
Predicted Class of Apple |
||||
|
Class 1 |
Class 2 |
Class 3 |
Class 4 |
Class 5 |
|
|
Class 1 |
238 |
12 |
5 |
1 |
0 |
|
Class 2 |
8 |
155 |
4 |
1 |
0 |
|
Class 3 |
5 |
9 |
184 |
2 |
0 |
|
Class 4 |
0 |
0 |
6 |
128 |
2 |
|
Class 5 |
0 |
0 |
2 |
6 |
136 |
In this study, for class label 1, there are 256 thermal images for training dataset of which 18 thermal images were incorrectly classified into different class labels. Thermal images of apples belonging to other class labels but are incorrectly classified into class label 1 represents the FP parameter of the model. In this study, 13 thermal images of apples were wrongly classified into class label 1. Similarly, data value for other class labels are mentioned in Table 6.
Table 6. Breakdown of confusion matrix into its conceptual parameters of TP, TN, FP, and FN
|
|
Total Images |
True Positive |
True Negative |
False Positive |
False Negative |
|
Class 1 |
256 |
238 |
635 |
13 |
18 |
|
Class 2 |
168 |
155 |
715 |
21 |
13 |
|
Class 3 |
200 |
184 |
687 |
17 |
16 |
|
Class 4 |
136 |
128 |
758 |
10 |
8 |
|
Class 5 |
144 |
136 |
758 |
2 |
8 |
3.2 Performance matrix of ANFIS based classifier
With the data values evaluated in Table 5 and Table 6, the performance matrix is computed and shown in Table 7. The parameters constituting the performance matrix includes False Positive Rate (FPR), Sensitivity, Specificity, Precision, and Accuracy. In the multi-class classification, FPR is an important parameter to determine the classification strength of the model. Lower score of FPR correlates to higher classification capability of the model. In this study, performance matrix or the classification report is evaluated in firstly for each class label separately, and secondly for the entire model. Table 7 presents the class wise classification report of the ANFIS based classification model. As discussed, FPR for class wise classification is very low, in the range of 0.00 to 0.03 which correlates to the higher accuracy achieved which is in the range of 96.24% to 98.89%. Another parameter constituting the classification report includes sensitivity of the model. It is also called as the true positive rate or Recall. Higher the value of sensitivity of the model, the model will have the higher ability to map a particular object to its actual class more accurately. This parameter also correlates with the false negative of the confusion matrix in terms that, higher the sensitivity of the model, lower will be the FN in the confusion matrix. In this study, the achieved value of sensitivity is very high in the range of 92% to 92.44%.
Table 7. Class wise classification report of the proposed model
|
Apple Quality Grading: Class Label |
Class Wise Performance Evaluation Parameter |
|||||
|
FPR |
Se (%) |
Sp (%) |
P (%) |
A (%) |
||
|
Class 1: |
Very Good |
0.02 |
92.97 |
94.82 |
97.99 |
96.57 |
|
Class 2: |
Good |
0.03 |
92.26 |
88.07 |
97.15 |
96.24 |
|
Class 3: |
Average |
0.02 |
92.00 |
91.54 |
97.59 |
96.35 |
|
Class 4: |
Poor |
0.01 |
94.12 |
92.75 |
98.70 |
98.01 |
|
Class 5: |
Very Poor |
0.00 |
94.44 |
98.55 |
99.74 |
98.89 |
[FPR: False Positive Rate; Se: Sensitivity; Sp: Specificity, P: Precision; A: Accuracy]
Specificity and Precision are another parameter which are evaluated for determining the usefulness of the classification model. These values are calculated using the data available in Table 5 and Table 6 and using the Eq. (11) and Eq (12). Eq. (11), which computes the proposed model's class-wise specificity, correctly predicts all samples that do not belong to the designated class. It will predict the presence in apple from any class other than class 1 accurately in other classes and not in class 1 label. From Table 7, the specificity of the proposed model label class wise is shown. The achieved specificity is in the range of 88-98% with class 5 (very poor grade apple) having the highest specificity of 98.55%. Precision measures the accuracy of all the positive predictions. Using Eq. (12), the highest achieved class wise precision for the proposed model is for label class 5 at 99.74%.
The overall classification parameters constituting the classification report are shown in a graphical diagram in Figure 5. The overall FPR of the ANFIS based classification model is very low at 0.02 corresponding the very high accuracy of 97.21%. The sensitivity of the model is also very high at 93.03%. Precision is evaluated at 93.03%, and Specificity at 98.26%.
Figure 5. Graphical representation of overall classification report of the proposed model
3.3 Comparative analysis
The results obtained for the ANFIS based proposed model for quality grading of apples are compared with the ANFIS based Pre-harvest Ripeness Estimation (APRE) model presented in the study of Kaur et al. [34]. Dataset used for development of APRE consists of images of apples in Visible and Near Infrared (VNIR) spectrum. In this study, the results obtained by APRE model as presented in the study of Kaur et al. [34], simulation of APRE model on the thermal dataset presented in this study, and the results obtained by the ANFIS based proposed model for quality grading are compared to determine the strength of the proposed model.
The confusion matrix for APRE based model is presented in Table 8. For class label 1, there are 256 thermal images of good quality of apples from the training dataset. Of these 256 thermographs, 208 were correctly classified as class label 1 and the remaining 48 images were incorrectly classified. Similarly, for other class labels values were obtained as presented in Table 8.
Table 8. Confusion matrix for APRE model on dataset containing thermal images of apple
|
Actual Class of Apple |
Predicted Class of Apple |
||||
|
Class 1 |
Class 2 |
Class 3 |
Class 4 |
Class 5 |
|
|
Class 1 |
208 |
27 |
13 |
7 |
1 |
|
Class 2 |
10 |
143 |
11 |
3 |
1 |
|
Class 3 |
1 |
12 |
171 |
14 |
2 |
|
Class 4 |
0 |
0 |
6 |
128 |
2 |
|
Class 5 |
0 |
2 |
6 |
14 |
122 |
Based on the data values obtained in Table 8, conceptual parameters including TP, TN, FP, and FN were evaluated and presented in Table 9. For class label 1 indicating the very good quality of apples, the value of TP representing the correct classifications, were 208. Again, for the same class label, all the incorrect classification were evaluated to be 637 representing the conceptual parameter of TN. Similarly, FP and FN were evaluated to be 11 and 48 respectively. Likewise, the data values for other class labels were also evaluated from Table 8 and presented in Table 9.
Table 9. Breakdown of confusion matrix into conceptual parameters
|
|
Total Images |
True Positive |
True Negative |
False Positive |
False Negative |
|
Class 1 |
256 |
208 |
637 |
11 |
48 |
|
Class 2 |
168 |
143 |
695 |
41 |
25 |
|
Class 3 |
200 |
171 |
668 |
36 |
29 |
|
Class 4 |
136 |
128 |
730 |
38 |
8 |
|
Class 5 |
144 |
122 |
754 |
6 |
22 |
Considering the equations (Eq. (9) to Eq. (13)), the performance matrix representing the classification report of the model was evaluated, and presented in Table 10. This table present in class wise classification report of the model. As mentioned, for model to be considered good for classification purpose, the FPR of the model should be as low as possible. After simulation of APRE model on the thermally generated dataset, the FPR for class wise classification report ranges between 0.008 and 0.056. This corresponds the accuracy of the model which ranges between 92.69% and 96.90%. As presented in Table 7, and discussed earlier, these values for the proposed ANFIS based quality grading model are better as compared to APRE model.
Table 10. Class wise classification report for APRE model simulated over thermal image dataset
|
Apple Quality Grading: Class Label |
APRE Model Performance Evaluation Metrics for Specific Class |
||||
|
FPR |
Se (%) |
Sp (%) |
P (%) |
A (%) |
|
|
Class 1: Very Good |
0.017 |
81.25 |
94.98 |
98.30 |
93.473 |
|
Class 2: Good |
0.056 |
85.12 |
77.72 |
94.43 |
92.699 |
|
Class 3: Average |
0.051 |
85.50 |
82.61 |
94.89 |
92.81 |
|
Class 4: Poor |
0.049 |
94.12 |
77.11 |
95.05 |
94.912 |
|
Class 5: Very Poor |
0.008 |
84.72 |
95.31 |
99.21 |
96.903 |
[FPR: False Positive Rate; Se: Sensitivity; Sp: Specificity, P: Precision; A: Accuracy]
The sensitivity which is also the true positive rate of the model, representing the recall of the classification algorithm, should be high for the model to be considered acceptable to be implemented. The results of sensitivity obtained for APRE based model on the thermally generated dataset for each class ranges between 81.25% and 94.12%. As discussed earlier, this parameter for the proposed model presented in this paper has better value ranging between 92% and 94.44%.
The performance parameter of specificity and precision are also evaluated for APRE based model on the thermally generated dataset. These values range between 77.11% to 95.31% for specificity and 94.43% to 99.21% for Precision. The range of specificity for this model is very high which makes the model very unstable towards classification process. On observing Table 7, the range of specificity ranges from 88.07% to 98.55% which is preferable range for the classification model.
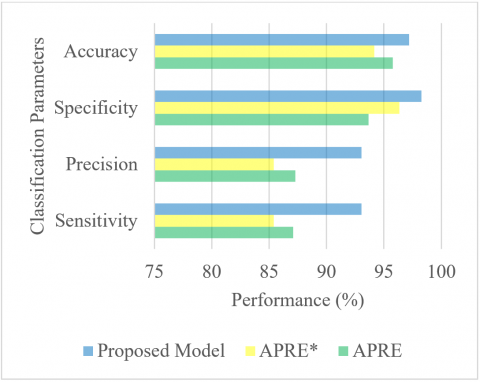
The overall classification parameter is also evaluated for APRE based model and presented in Table 11. This table also presents the comparative analysis of overall classification performance of both the models. These models are also presented in a graphical diagram in Figure 6.
Table 11. Comparative analysis of classification report for different classifiers
|
Overall Classification Parameter |
APRE |
APRE* |
Proposed Model |
|
False Positive Rate |
0.02 |
0.037 |
0.017 |
|
Sensitivity |
87.09 |
85.40 |
93.03 |
|
Precision |
87.27 |
85.40 |
93.03 |
|
Specificity |
93.66 |
96.35 |
98.26 |
|
Accuracy |
95.78 |
94.15 |
97.21 |
[APRE: ANFIS based Pre-harvest Ripeness Estimation [34]; APR*: APRE model simulated over thermal dataset of apples used in this paper]
From Table 11, it is observed that FPR of the proposed model in this paper is lower than that of APRE based model applied over the thermally generated dataset presented in this paper. This result is correlated with the higher accuracy of the proposed model against the APRE based model. Similarly, other performance evaluation matrix parameters including sensitivity, specificity, and precision. The values of these parameters are also better for the ANFIS based proposed model against the APRE based model.
Figure 6. Graphical representation of performance evaluation classifier
In this paper, an Adaptive Neuro-Fuzzy Inference System (ANFIS) based model is presented. This model is developed for an automated quality assessment of Apples into five different categories. For image acquisition, thermal imaging system is setup using a thermal camera by Fluke Corporation. From the acquired images, using resizing and image segmentation techniques, image pre-processing is performed for data set generation. Once the dataset is developed, consisting of 1130 thermally pre-processed images, five categorical features are extracted including color, shape, texture, and gradient based features along with statistical features. Using these features as an input to the Fuzzy Logic System (FLS), grading of apple is performed into five different classes: very good, good, average, poor, and very poor apples. The performance of the proposed model is evaluated using different performance evaluation parameters. The model proposed in the study of Kaur et al. [34], the APRE model is applied on dataset generated using imaging system in visible spectrum. Also, only when category of feature i.e., color feature is extracted for ripeness grading. As compared to this model, the proposed model in this paper employs thermal imaging system. Also, five categories of features are used for quality grading of apple. The overall accuracy of the proposed model is 97.21% however, when the APRE model is applied to the thermally generated dataset for quality assessment of apples, the performance degrades giving an accuracy of 94.15%. This model itself is presenting the model accuracy of 95.78% when applied to the dataset in visible spectrum. Considering the data presented in Figure 6, it is observed that the model proposed in this paper performs better than the APRE model. Form our previous section it is also observed that thermal imaging system performs better than the imaging system in the visible spectrum for development of computer vision based automated system for quality assessment of fruits and vegetables.
[1] Baritelle, A.L., Hyde, G.M. (2001). Commodity conditioning to reduce impact bruising. Postharvest Biology and Technology, 21: 331-339. https://doi.org/10.1016/S0925-5214(00)00154-X
[2] Veraverbeke, E.A., Verboven, P., Lammertyn, J., Cronje, P., De Baerdemaeker, J., Nicolaï, B.M. (2006). Thermographic surface quality evaluation of apple. Journal of Food Engineering, 7: 162-168. https://doi.org/10.1016/j.jfoodeng.2005.06.059
[3] Luo, X., Takahashi, T., Kyo, K., Zhang, S. (2012). Wavelength selection in vis/NIR spectra for detection of bruises on apples by ROC analysis. Journal of Food Engineering, 109(3): 457-466. https://doi.org/10.1016/j.jfoodeng.2011.10.035
[4] Yao, J., Guan, J.Y., Zhu, Q.B. (2017). Predicting bruise susceptibility in apples using Vis/SWNIR technique combined with ensemble learning. International Journal of Agricultural and Biological Engineering, 10(5): 144-153. https://doi.org/10.25165/j.ijabe.20171005.2888
[5] Shenderey, C., Shmulevich, I., Alchanatis, V., Egozi, H., Hoffman, A., Ostrovsky, V., Lurie, S., Ben-Arie, R., Schmilovitch, Z.E. (2010). NIRS detection of moldy core in apples. Food and Bioprocess Technology, 3(1): 79-86. https://doi.org/10.1007/s11947-009-0256-1
[6] Grandon, S., Sanchez-Contreras, J., Torres, C.A. (2019). Prediction models for sunscald on apples (Malus domestica Borkh). cv. Granny Smith using Vis-Nir reflectance. Postharvest Biology and Technology, 151: 36-44. https://doi.org/10.1016/j.postharvbio.2019.01.012
[7] Vanoli, M., Rizzolo, A., Grassi, M., Spinelli, L., Verlinden, B.E., Torricelli, A. (2014). Studies on classification models to discriminate ‘braeburn’ apples affected by internal browning using the optical properties measured by time-resolved reflectance spectroscopy. Postharvest Biology and Technology, 91: 112-121. https://doi.org/10.1016/j.postharvbio.2014.01.002
[8] Baranowski, P., Mazurek, W., Wozniak, J., Majewska, U. (2012). Detection of early bruises in apples using hyperspectral data and thermal imaging. Journal of Food Engineering, 110(3): 345-355. https://doi.org/10.1016/j.jfoodeng.2011.12.038
[9] Luo, W., Zhang, H.L., Liu, X.M. (2019). Hyperspectral/multispectral reflectance imaging combining with watershed segmentation algorithm for detection of early bruises on apples with different peel colors. Food Analytical Methods, 12(5): 1218-1228. https://doi.org/10.1007/s12161-019-01456-0
[10] Shi, Y., Yan L., Liu, J.X., Pang, L., Xiao, J. (2019). Detection of minor apple damage based on hyperspectral imaging. Inmateh Agricultural Engineering, 58(2): 203. https://doi.org/10.35633/inmateh-58-22
[11] Pan, X.Y., Sun, L.J., Li, Y.S., Che, W.K., Ji, Y.M., Li, J.L., Li, J., Xie, X., Xu, Y.T. (2019). Non-destructive classification of apple bruising time based on visible and near-infrared hyperspectral imaging. Journal of the Science of Food and Agriculture, 99(4): 1709-1718. https://doi.org/10.1002/jsfa.9360
[12] Ren, Y., Ramaswamy, H.S., Li, Y., Yuan, C., Ren, X. (2018). Classification of impact injury of apples using electronic nose coupled with multivariate statistical analyses. Journal of Food Process Engineering, 41(5): e12698. https://doi.org/10.1111/jfpe.12698
[13] Wang, Z., Kunnemeyer, R., McGlone, A., Burdon, J. (2020). Potential of Vis-Nir spectroscopy for detection of chilling injury in kiwifruit. Postharvest Biology and Technology, 164: 111160. https://doi.org/10.1016/j.postharvbio.2020.111160
[14] Wu, G.F., Wang, C.G. (2014). Investigating the effects of simulated transport vibration on tomato tissue damage based on vis/NIR spectroscopy. Postharvest Biology and Technology, 98: 41-47. https://doi.org/10.1016/j.postharvbio.2014.06.016
[15] Li, J.B., Zhang, R.Y., Li, J.B., Wang, Z.L., Zhang, H.L., Zhan, B.S., Jiang, Y.L. (2019). Detection of early decayed oranges based on multispectral principal component image combining both bi-dimensional empirical mode decomposition and watershed segmentation method. Postharvest Biology and Technology, 158: 110986. https://doi.org/10.1016/j.postharvbio.2019.110986
[16] Guzman, E., Baeten, V., Pierna, J.A.F., Garcia-Mesa, J.A. (2013). Infrared machine vision system for the automatic detection of olive fruit quality. Talanta, 116: 894-898. https://doi.org/10.1016/j.talanta.2013.07.081
[17] Yu, D., Xu, T., Song, K. (2018). Nondestructive testing of external defects on nanguo pear. Spectroscopy Letters, 51(4): 191-197. https://doi.org/10.1080/00387010.2018.1447968
[18] Sun, Y., Wang, Y., Xiao, H., Gu, X., Pan, L., Tu, K. (2017). Hyperspectral imaging detection of decayed honey peaches based on their chlorophyll content. Food Chemistry, 235: 194-202. https://doi.org/10.1016/j.foodchem.2017.05.064
[19] Jiang, Y., Li, C.Y., Takeda, F. (2016). Nondestructive detection and quantification of blueberry bruising using near-infrared (NIR) hyperspectral reflectance imaging. Scientific Reports, 6(1): 35679 https://doi.org/10.1038/srep35679
[20] Hu, M.H., Dong, Q.L., Liu, B.L. (2016). Classification and characterization of blueberry mechanical damage with time evolution using reflectance, transmittance and interactance imaging spectroscopy. Computers and Electronics in Agriculture, 122: 19-28. https://doi.org/10.1016/j. compag.2016.01.015
[21] Zeng, X.Y., Miao, Y., Ubaid, S.M., Gao, X.M., Zhang, S.L. (2020). Detection and classification of bruises of pears based on thermal images. Postharvest Biology and Technology, 161: 111090. https://doi.org/10.1016/j.postharvbio.2019.111090
[22] Vadivambal, R., Jayas, D.S. (2011). Applications of thermal imaging in agriculture and food Industry-A review. Food and Bioprocess Technology, 4: 186-199. https://doi.org/10.1007/s11947-010-0333-5
[23] Maldague, X.P. (2001). Theory and Practice of Infrared Technology for Nondestructive Testing. John Wiley & Sons, Wiley-Interscience, New York.
[24] Fito, P.J., Ortolá, M.D., De los Reyes, R., Fito, P., De los Reyes, E. (2004). Control of citrus surface drying by image analysis of infrared thermography. Journal of Food Engineering, 61: 287-290. https://doi.org/10.1016/S0260-8774(03)00120-1
[25] Gowen, A.A., Tiwari, B.K., Cullen, P.J., McDonnell, K., O’Donnell, C.P. (2010). Applications of thermal imaging in food quality and safety assessment. Trends in Food Science & Technology, 21(4): 190-200. https://doi.org/10.1016/j.tifs.2009.12.002
[26] Baranowski, P., Mazurek, W., Witkowska-Walczak, B., Sławiński, C. (2009). Detection of early apple bruises using pulsed-phase thermography. Postharvest Biology and Technology, 53(3): 91-100. https://doi.org/10.1016/j.postharvbio.2009.04.006
[27] Gan-Mor S, Regev, R., Levi, A., Eshel, D. (2011). Adapted thermal imaging for the development of postharvest precision steam-disinfection technology for carrots. Postharvest Biology and Technology, 59: 265-271. https://doi.org/10.1016/j.postharvbio.2010.10.003
[28] Veraverbeke, E.A., Verboven, P., Lammertyn, J., Cronje, P., De Baerdemaeker, J., Nicolaï, B.M. (2006). Thermographic surface quality evaluation of apple. Journal of Food Engineering, 77: 162-168. https://doi.org/10.1016/j.jfoodeng.2005.06.059
[29] Baranowski, P., Mazurek, W. (2009). Detection of physiological disorders and mechanical defects in apples using thermography. International Agrophysics, 23(1): 9-17.
[30] Varith, J., Hyde, G.M., Baritelle, A.L., Fellman, J.K., Sattabongkot, T. (2003). Noncontact bruise detection in apple by thermal imaging. Innovative Food Science and Emerging Technologies, 4: 211-218. https://doi.org/10.1016/S1466-8564(03)00021-3
[31] Gonçalves, B.J., Giarola, T.M.O., Pereira, D.F., Vilas Boas, E.V.B., de Resende, J.V. (2016). Using infrared thermography to evaluate the injuries of cold-stored guava. Journal of Food Science and Technology, 53: 1063-1070. https://doi.org/10.1007/s13197-015-2141-4
[32] Kim, G., Kim, G.H., Park, J., Kim, D.Y., Cho, B.K. (2014). Application of infrared lock-in thermography for the quantitative evaluation of bruises on pears. Infrared Physics & Technology, 63: 133-139. https://doi.org/10.1016/j.infrared.2013.12.015
[33] Kuzy, J., Yu, J., Li, C.Y. (2018). Blueberry bruise detection by pulsed thermographic imaging. Postharvest Biology and Technology, 136: 166-177. https://doi.org/10.1016/j.postharvbio.2017.10.011
[34] Kaur, S., Randhawa, S., Malhi, A. (2021). An efficient ANFIS based pre-harvest ripeness estimation technique for fruits. Multimedia Tools and Applications, 80: 19459-19489. https://doi.org/10.1007/s11042-021-10741-2