Chaojian Li![]()
© 2024 The author. This article is published by IIETA and is licensed under the CC BY 4.0 license (http://creativecommons.org/licenses/by/4.0/).
OPEN ACCESS
With the rapid development of e-commerce, the variety of products available on platforms is increasing, and consumers' demand for personalized and accurate recommendations is growing stronger. Product recommendation systems based on Artificial Intelligence (AI) and image processing technologies have gained widespread attention as a critical means to enhance user experience and sales conversion rates on e-commerce platforms. Existing recommendation systems typically rely on user behavior data or product attributes; however, these methods often overlook the visual features and multi-label information of products, limiting the accuracy and diversity of recommendations. Furthermore, a single recommendation mechanism fails to meet the complex needs of users, resulting in unsatisfactory recommendation outcomes. To address this issue, this paper proposes a product recommendation system based on AI and image processing technologies. The first part of the research focuses on multi-label classification of products, utilizing image recognition and text analysis techniques to extract visual features and textual information, enabling more accurate and detailed label classification. The second part explores a personalized recommendation approach based on similarity retrieval, combining user behavior data and product features to provide personalized recommendations through similarity calculation. Experimental results show that the proposed method significantly improves the accuracy of product recommendations and user satisfaction, demonstrating strong application potential.
Artificial Intelligence (AI), image processing, e-commerce, personalized recommendation, multi-label classification, similarity retrieval
With the continuous development and popularization of Internet technology, e-commerce platforms have become an essential part of modern society's commercial activities [1-4]. Consumers' shopping behaviors are becoming increasingly diverse, and the rise of personalized demands has driven e-commerce platforms to continuously explore how to enhance user experience and increase platform user engagement through intelligent methods [5-7]. Against this backdrop, product recommendation systems based on AI and image processing technologies have gradually become a research hotspot. These systems can provide accurate product recommendations based on consumers' interests and needs, thereby optimizing platform services, increasing product sales, and enhancing platform competitiveness.
Personalized product recommendation systems not only improve the shopping experience for users but also help merchants more precisely target their customer base, increasing product exposure and conversion rates [8-11]. Therefore, researching and optimizing product recommendation systems based on AI and image processing technologies is of great significance for promoting innovation and development on e-commerce platforms [12-16]. Personalized recommendation systems construct a more comprehensive user profile by analyzing user behavior data, product attributes, and image information, thereby achieving accurate recommendations that enhance user satisfaction and platform economic benefits.
Although existing product recommendation systems have made certain progress, they still have some shortcomings [17-24]. On the one hand, many recommendation algorithms primarily rely on users' historical behavior data, neglecting the visual information and multi-dimensional features of the products themselves, which limits the diversity and accuracy of recommendation results. On the other hand, current recommendation methods often overly depend on a single recommendation mechanism, lacking deep exploration of the relationships between products and cross-domain recommendation capabilities, making it difficult to meet the complex and changing needs of users. Therefore, effectively integrating multi-dimensional information in the recommendation system, particularly the relationship between image features and product labels, has become a key challenge in current research.
The main research content of this paper is divided into two parts. The first part focuses on the multi-label classification method for e-commerce platform products based on AI and image processing technologies. By analyzing product images and textual descriptions, a more comprehensive product labeling system is constructed to improve the accuracy and detail of product classification. The second part investigates a personalized product recommendation method based on similarity retrieval, combining user behavior data and product features. Through similarity calculation, personalized recommendations are provided to meet users' purchasing needs in different scenarios. This paper aims to propose a product recommendation method that integrates multiple information sources to promote the optimization and innovation of personalized recommendation systems, with significant academic value and application prospects.
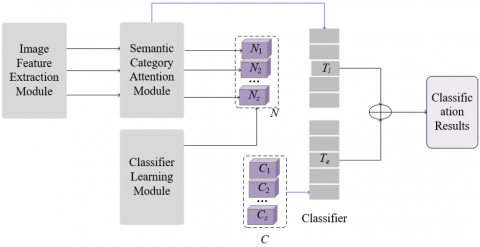
On e-commerce platforms, the multi-label classification task for products not only involves traditional single-label classification issues but also faces complex interactions between product features and the co-occurrence of multiple labels. Products often have multiple labels, such as brand, category, color, and size. The associations and co-occurrence frequencies between each label may vary, making the multi-label classification task highly complex. To address this challenge, this paper designs an end-to-end product multi-label classification algorithm based on Graph Convolutional Networks (GCNs). The model mainly consists of three modules: the image feature extraction module, the semantic category attention module, and the classifier learning module based on dynamic GCNs. The overall architecture is shown in Figure 1. The three modules are introduced in detail below.
Figure 1. Overall architecture of the multi-label classification model for e-commerce platform products
2.1 Image feature extraction module
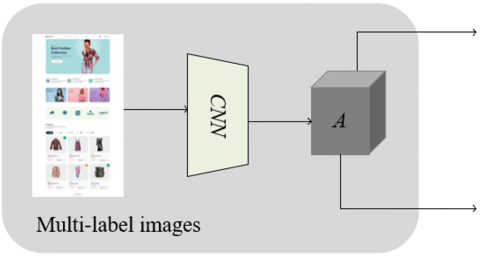
In practical applications, product images often contain rich visual information, such as the appearance, color, shape, etc., of the product. These features are closely related to the product's labels, such as category, brand, and style. The image feature extraction module uses the ResNet-101 backbone network to extract high-level features from the image, ensuring that the visual information of the product can be accurately encoded. The module architecture is shown in Figure 2. The ResNet-101 network is known for its deep structure and residual learning mechanism, which effectively avoids the gradient vanishing problem in deeper layers of the network and allows for more detailed feature extraction. ResNet-101 consists of five convolutional layers, each containing two 1×1 convolution kernels and one 3×3 convolution kernel. These kernels are capable of capturing both local and global image features at different scales, ensuring comprehensive analysis of the product image. Let the input and output vectors of the residual block be represented by a and b, and the residual mapping to be learned by D(a). The expression is as follows:
$b=D\left(a,\left\{Q_u\right\}\right)+a$ (1)
To further improve the performance of the image feature extraction module and reduce overfitting, a global average pooling (GAP) layer is added after the final convolutional layer of ResNet-101. The introduction of the GAP layer helps compress the high-dimensional convolutional feature maps into a fixed-length vector, reducing the number of network parameters and thus lowering the risk of overfitting. At the same time, the GAP layer effectively preserves the global information of the image, ensuring that the extracted feature vector A is more representative when encoding the product's visual characteristics. This feature vector is then passed to the subsequent modules of the GCN as input node features, further integrating and passing semantic information related to product labels.
D(a) can be represented by the following formula, where δ is the activation function ReLU.
$D(a)=Q_2 \delta\left(Q_1 a\right)$ (2)
Figure 2. Architecture of the image feature extraction module
2.2 Semantic category attention module
Product images often contain multiple details and regions, which may be directly related to the product's labels, such as brand, type, color, etc. Therefore, for the multi-label classification task on e-commerce platforms, the product image often contains overlapping features corresponding to multiple labels. To address this, a semantic category attention module based on class activation mapping (CAM) is used to generate activation maps specific to product categories. This aims to enhance the model's focus on the visual features in the product image that are most relevant to the specific category label. The module architecture is shown in Figure 3. By using class activation maps, the model can automatically focus on the regions of the product image that are most relevant to a particular category, thereby effectively improving classification accuracy. For example, for a clothing product, the class activation map can help the model identify regions associated with the "dress" category, such as the skirt hem and waistline, while excluding irrelevant backgrounds or other components.
Eq. (3) provides the input value of the SoftMax function for a specific product category Z. Suppose the value at point (a,b) on the j-th feature map is represented by dj(a,b), and the category is represented by Z.
$T_Z=\sum_j q_j^z \sum_{a, b} d_j(a, b)=\sum_{a, b} \sum_j q_j^z d_j(a, b)$ (3)
We define Eq. (4) as the class activation map for category Z. It can be seen that the class activation map LZ is the weighted sum of different activated feature maps for recognizing a particular class CZ.
$L_Z(a, b)=\sum_j q_j^z d_j(a, b)$ (4)
By integrating the above two equations, TZ can be redefined as:
$T_X=\sum_{a, b} L_Z(a, b)$ (5)
For the above equation to hold, the following condition must be met to support linear addition operations for input-output:
$d_j\left(a_1+a_2, b_1+b_2\right)=d_j\left(a_1, b_1\right)+d_j\left(a_2, b_2\right)$ (6)
The core objective of the semantic category attention module based on class activation maps is to analyze the contribution of various regions in the product image to specific labels, helping the model locate and strengthen the visual features related to the category. Specifically, the product image is input as a multi-label into a convolutional neural network (CNN) for feature extraction. The generated feature map A contains deep semantic information of the image. By using class activation maps, the system can extract regions related to specific product labels, thus generating category-specific activation maps L=[l1, l2,..., lZ]. Traditional CAM methods usually rely on GAP or Global Max Pooling (GMP) to generate class activation maps. However, in this method, the model first applies convolutional layers to transform the feature map X and uses the Sigmoid function to normalize the activation map. This adjustment helps the model more accurately capture key information areas related to product labels, thereby improving the multi-label classification performance.
Based on the generated activation map L, this paper further decouples each category’s activation map from the feature map A by weighted summation, thus obtaining the content-aware category representation N=[N1,N2,...,NZ] for each label. This way, the model can selectively aggregate image features related to each specific product label. This decoupling process ensures that the feature representation of each category more accurately reflects the visual features of that product label, avoiding confusion between labels and improving classification accuracy. Compared to traditional CAM methods, the convolutional classifier and Sigmoid normalization steps in this approach make the generation of activation maps more flexible and detailed, effectively enhancing the model’s expressive power, particularly for multi-label classification tasks in e-commerce platforms. Suppose the weight of the Z-th activation map is represented by lzu,k, and the feature vector at feature map location (u, k) is denoted by $a^{\prime}{ }_{u k} \in R^{F^{\prime}}$. The specific process is as follows: each category’s NZ is represented as the weighted sum of A’:
$n_Z=l_C^S A^{\prime}=\sum_{u=1}^G \sum_{k=1}^Q l_{u, k}^Z a_{u, k}^{\prime}$ (7)
Figure 3. Semantic category attention module
2.3 Classifier learning module
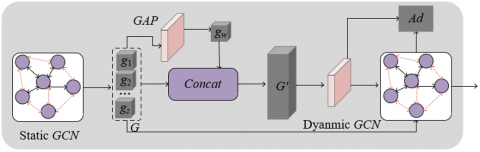
In the multi-label classification task for products on e-commerce platforms, the relationships between labels are crucial for improving classification accuracy. Product images often contain multiple labels, and there are complex relationships between these labels. For example, a piece of clothing might have both "top" and "T-shirt" labels, and the relationship between these labels is content-dependent, not fixed. Traditional GCN methods build a static label relationship graph based on label co-occurrence frequency and use it to predict labels. However, this globally shared static graph may suffer from frequency bias, especially in multi-label image classification tasks, where the co-occurrence frequency of labels may lead the model to make biased predictions for certain labels, neglecting potential dependencies among others. For e-commerce platform products, the diversity of product images and the dynamic changes between labels require the model to flexibly capture the unique relationships between labels in each image. To address this issue, this paper proposes the construction of a dynamic GCN, which can dynamically adjust the relationship graph between labels based on the features of each image, thereby better reflecting the unique semantic structure of each product image. The module architecture is shown in Figure 4.
The introduction of dynamic graph convolution networks enables each product image to automatically adjust the dependency graph between labels based on the content of the image when modeling label correlations. Unlike static graphs, dynamic graph networks generate a specific label relationship graph for each image, avoiding errors caused by label co-occurrence frequency bias. For example, for a product image of sneakers, the dynamic graph network can automatically construct a relationship graph that better aligns with the "sneaker" label. The relationships between tags like "footwear", "sports", and "fashion" may receive high attention, while unrelated tags are ignored. In this way, the model can more accurately capture the subtle dependencies between labels in the product image, reducing the impact of frequency bias in static graph models, and improving the multi-label classification accuracy of products on e-commerce platforms.
Figure 4. Classifier learning module
Let $G=\left[g_1, g_2, \ldots, g_z\right] \in R^{Z \times F 1}$. The simple definition of the traditional single-layer graph convolution network is given by:
$G^{m+1}=\delta\left(X G^m Q^m\right)$ (8)
In this module, the above equation is specifically defined as:
$G=M\, R E L U\left(X_T N Q_T\right)$ (9)
Static graph convolution networks capture the global dependencies between labels in the dataset using a fixed global correlation matrix XT. This global correlation matrix identifies the coarse dependencies between image labels, which is useful for relationships between tags shared across different images, such as the common combination of "shoes" and "sports" labels. During model training, the output features G of the static graph are processed through a GAP layer and convolutional layers to generate global feature vectors gh, which are then concatenated with the original label feature vectors. This fusion process allows the static graph to capture the overall label dependencies and provide a global perspective for the entire classification network, thus enhancing the model's understanding of the coarse relationships between labels. However, this static graph method cannot adjust label relationships based on the specific content of each image. Therefore, in multi-label classification tasks, it may result in inaccurate modeling of label dependencies, especially when there are significant differences in relationships between labels.
To overcome the limitations of static graphs, this paper introduces dynamic graph convolution networks that dynamically adjust the relationships between labels. Unlike static graphs, the correlation matrix Xf in dynamic graph convolution networks is adaptively estimated based on the input feature G of each image. This allows each image to have a unique label relationship graph. Specifically, the core advantage of dynamic graph convolution networks is that they can dynamically adjust the label dependencies based on the specific features of each product image. For different images, the model generates different dynamic graph correlation matrices Xf, which can capture the subtle correlations between labels in the image. For example, in an image containing "sneakers", the model dynamically adjusts the label relationship graph to emphasize the relationship between "sneakers", "footwear", and "sports" labels, while ignoring relationships with unrelated labels. This approach effectively avoids the frequency bias issue in static graphs, improving the flexibility and accuracy of the model in handling multi-label product classification tasks. Let the update weights for the states be represented by Qf $\in$ RF1×F2, and the weights for the convolutional layer that constructs the dynamic correlation matrix Xf be denoted by QX $\in$ RZ×2F1. Let the Sigmoid(·) activation function be represented by δ(·). Finally, after processing through the dynamic graph convolution network, the model is able to output more accurate category features C as follows:
$G^{\prime}=\left[\left(g_1 ; g_h\right),\left(g_2, g_h\right), \ldots,\left(g_z ; g_h\right)\right]$ (10)
$X_f=\delta\left(Q_X G^{\prime}\right)$ (11)
$C=M \, R E L U\left(X_f G Q_f\right)$ (12)
2.4 Final classification and loss
In the final stage of the model, we obtain the category representations C=[C1, C2, ..., cZ] from the classifier module, where each vector cu corresponds to a specific label category of the product and has rich semantic relationships with other labels. These vectors cu capture the fine-grained dependencies between labels, allowing the semantic representation of each label to better align with the image content. On this basis, to generate the final classification results, we use a binary classifier for prediction for each category representation, yielding a prediction score for each label. By concatenating these score vectors te, the model can generate a complete score vector for each category, reflecting the strength of the relationship between the product image and the labels. The dynamic graph convolution network dynamically adjusts the label relationship graph, enabling the label dependencies of each product image to be personalized, reducing the label frequency bias found in static graph methods, and improving classification accuracy.
To further enhance the reliability of the classification results, this paper proposes combining the activation map L generated by the semantic category module and performing GAP on the activation map to obtain more stable category scores. This activation map captures the key information areas in the image and integrates this information into a global feature representation through global pooling. By merging the score for each category with the features from the activation map, the model can further increase the confidence of predictions, avoiding inaccurate predictions caused by biases in individual labels or image features. Finally, in the output phase of the model, the category score vector te obtained through the binary classifier and the confidence score tl derived from the activation map are combined and averaged to generate the final score vector t, providing more accurate and reliable label predictions for each product image. Formally, the individual score vectors are represented as follows:
$t_e=\left[t_e^1, t_e^2, \ldots, t_e^Z\right]$ (13)
$t_l=\left[t_l^1, t_l^2, \ldots, t_l^Z\right]$ (14)
$t=\left[t^1, t^2, \ldots, t^Z\right]$ (15)
$M(b, t)=\sum_{z=1}^z b^z \log \left(\delta\left(t^z\right)\right)+\left(1-b^z\right) \log \left(1-\delta\left(t^z\right)\right)$ (16)
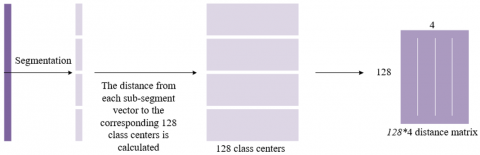
This paper proposes a similarity-based e-commerce product personalization recommendation algorithm. The core objective is to achieve more accurate and personalized recommendations by calculating the similarity between the product to be recommended and the products in the user's historical behavior or preferences. In this algorithm, the calculation of product feature vectors is one of the key steps. These feature vectors are typically extracted from a combination of the product's image, textual descriptions, and other attribute information to generate high-dimensional feature vectors for each product. When a user browses or searches for a product on the platform, the system extracts the feature vectors of all products from the feature database and compares them with the feature vector of the product the user is currently interested in. After calculating the similarity, the system sorts all products and selects the most similar products as recommendations. To achieve personalized recommendations, the system typically incorporates user behavior data and preference models to further optimize recommendation accuracy. For instance, based on the user's purchase history and browsing records, the system can learn about the user's preferences for certain categories or attributes of products, thereby adjusting the similarity retrieval process to ensure the recommendations better match the user's personalized needs. By combining image features, product attribute information, and user behavior data, a similarity-based recommendation system can effectively enhance user experience and help users quickly discover products that match their interests. Figure 5 illustrates the vector distance calculation process.
Let the query vector and product feature database vectors be represented as X=(x1, x2,..., xv)T and Y=(y1, y2,..., yv), respectively. The following formulas present commonly used distance metrics for similarity calculation, such as Euclidean distance and cosine distance:
$F_{E U C}(X, Y)=\sqrt{\sum_{u=1}^v\left(X_u-Y_u\right)^2}$ (17)
$F_{C O S}(X, Y)=1-\frac{\sum_{u=1}^v X_u Y_u}{\sqrt{\sum_{u=1}^v X_u^2} \sqrt{\sum_{u=1}^v Y_u^2}}$ (18)
The key reason for optimizing the similarity retrieval algorithm in the personalized product recommendation system is to improve retrieval efficiency, reduce computational complexity, and meet the real-time recommendation requirements. As the variety of products and feature databases on e-commerce platforms continue to expand, the number of feature vectors for products also grows, potentially reaching millions or more. If brute-force retrieval is used—calculating the similarity between the query vector and every vector in the feature database and sorting them—the retrieval time will increase linearly with the size of the feature database. This not only wastes computational resources but also makes it difficult to meet the platform's high demands for real-time recommendations and rapid responses. For instance, when a user is browsing products, the platform should quickly return personalized recommendations. If retrieval takes too long, it could negatively affect the user experience, potentially leading to user attrition. Therefore, optimizing the similarity retrieval algorithm to reduce computational complexity becomes key to improving system response time and enhancing the user experience.
The similarity retrieval algorithm based on product quantization in personalized product recommendation on e-commerce platforms mainly improves the efficiency of similarity retrieval by compressing and quantizing the product feature vectors. Specifically, the product quantization algorithm decomposes the product feature vector space into multiple low-dimensional subspaces and quantizes each subspace, reducing the storage and computation required during calculation. For example, suppose a product's feature vector is 128-dimensional, and the platform's product feature database contains N such vectors. First, the 128-dimensional feature vector is decomposed into 4 sub-vectors, each 32-dimensional. Each sub-vector is quantized using 256 clustering centers. In this way, the original 128-dimensional vector is converted into a compressed vector represented by 4 integers, where each integer represents the encoding of a clustering center in that subspace. This way, the vector for the entire product feature database is significantly reduced in storage space through quantization encoding, and the computation for similarity retrieval is also reduced accordingly. Through compression, the distance calculation between the query and product feature vectors can be accelerated by looking up a precomputed distance matrix, thus greatly improving retrieval efficiency, especially when dealing with a product feature database with millions of items, reducing computation time significantly while ensuring a certain level of accuracy.
The similarity retrieval algorithm based on product quantization used in this paper further optimizes retrieval efficiency by introducing a coarse quantization step. Through K-Means clustering, the product feature vectors are first divided into several clusters, each containing products with high similarity. After the initial clustering, the product quantization algorithm quantizes and encodes the feature vectors within each cluster, compressing the high-dimensional vectors into a lower-dimensional representation. Then, an inverted index structure is established to store the cluster center numbers and the corresponding relationships between the products within each cluster. This approach ensures that during querying, there is no need to calculate the distance to all products. Instead, the distance between the query vector and all cluster centers is first computed, and the cluster most similar to the query vector is selected, thereby reducing the calculation scope to the feature vectors of the products within that cluster, further improving computation efficiency. However, the K-Means clustering algorithm still has some limitations when applied to personalized product recommendation, mainly regarding the number of clusters (K-value) and the selection of initial cluster centers. First, the choice of K directly affects the clustering results. If the K-value is set improperly, it may result in poor clustering performance, thereby affecting the accuracy and efficiency of similarity retrieval. Second, the K-Means algorithm is sensitive to the selection of initial cluster centers. If the initial cluster centers are chosen poorly, the algorithm may converge near a local optimal solution and fail to achieve a global optimal clustering result, which negatively affects retrieval performance.
To address these issues, this paper introduces the more advanced K-Means++ clustering algorithm. In the coarse quantization phase, the product feature vectors are first divided based on the cluster centers obtained from K-Means++. The query vector is used to compute the distance to each cluster center, quickly selecting the cluster most related to the query. For the selected cluster's product feature vectors, product quantization is applied to further refine the vector compression. In this stage, the feature vectors within each cluster are decomposed into multiple subspaces, and K-Means clustering is applied to each subspace for quantization, ultimately compressing the product feature vectors into a lower-dimensional representation.
In the experiment, the key parameters of K-Means++ are the number of clusters K and the method for initializing the centroids. We chose K-Means++ because its approach to selecting initial centroids effectively avoids the local optimal issues that can occur in the traditional K-Means algorithm, thereby improving clustering performance.
For selecting the number of clusters K, we employed the following method. First, we evaluated the clustering performance by calculating the Sum of Squared Errors (SSE) for different values of K. As K increased, the SSE gradually decreased, but the rate of decrease became slower as K grew. According to the elbow method, we chose the point where the SSE reduction began to level off as the optimal value for K. In this study, we selected K=10 as the number of product categories based on the elbow method. To further validate the reasonableness of the chosen K, we computed the silhouette coefficient for different values of K. The silhouette coefficient reflects the clustering quality, with higher values indicating better clustering performance. The experiment showed that the silhouette coefficient reached its maximum at K=10, indicating that this parameter setting provides a good clustering result. For the initialization method, we used the random selection approach provided by K-Means++, which, compared to traditional random initialization methods, can more effectively avoid the local optima issue in clustering results and improve the stability of the clustering process. The experimental results demonstrated that K-Means++ achieved higher accuracy in initializing cluster centers than the traditional K-Means algorithm, especially in cases with complex product categories, effectively enhancing classification precision.
Under different selections of K, the stability of the clustering results and the classification accuracy exhibited noticeable differences. A too-small value of K leads to over-clustering of product categories, which negatively impacts the accuracy of multi-label classification, while a too-large value of K increases computational complexity and may result in overly fine-grained categories, affecting the model's effectiveness. Through in-depth analysis and tuning of the K-Means++ clustering algorithm, we are able to select an optimal value for K, thereby providing more accurate support for product label classification.
To efficiently handle massive volumes of product data, we also adopted a distributed data processing framework based on Hadoop and Spark. The product data is stored in HDFS. To enhance data retrieval efficiency, we compressed image data and optimized indexing for text description data. This approach significantly reduces storage costs while maintaining data integrity and improving data read speed. For processing the product text descriptions, we employed a BERT-based pre-trained language model. BERT can capture contextual information and generate semantically rich word embeddings, enabling the system to understand the underlying meaning in product descriptions. This module processes data streams in real-time using Apache Kafka, ensuring that the text data is quickly and reliably fed into the model.
The multi-label classification of products is achieved by combining product image and text information through a deep learning model. After extracting image features using CNN and text features using BERT, we employ a multi-label classification model based on Graph Neural Networks (GNN) to classify product labels. To further improve classification accuracy, we apply the K-Means++ clustering algorithm for preliminary clustering analysis of the products, and optimize and adjust the labels based on the clustering results.
To handle large-scale data, the system has been optimized in several ways: 1) Parallel Data Processing: Apache Spark is used for parallel processing, supporting both batch computation and real-time stream processing of massive datasets. 2) Model Acceleration: TensorRT is employed to optimize deep learning models, improving inference speed and significantly reducing latency, especially during large-scale online inference. 3) Storage Optimization: A hybrid storage solution based on Redis and Cassandra is implemented to ensure efficient data storage and retrieval. 4) Load Balancing: The system uses a load balancer (such as Nginx) to distribute request traffic, ensuring stable operation under high concurrency conditions.
Figure 5. Vector distance calculation process
In this study, the multi-label classification experiment of products used the Fashion-MNIST dataset and a self-built e-commerce product image dataset. For the Fashion-MNIST dataset, we divided it into 60% training data, 20% validation data, and 20% test data according to the standard split. For the self-built e-commerce product dataset, we split the data into 70% for training, 15% for validation, and the remaining 15% for testing. In terms of data preprocessing, we scaled the images to a uniform size of 28x28 pixels and applied normalization to the pixel values of each image using standardization techniques. The text descriptions were tokenized and stopwords removed, after which the bag-of-words model was used to represent the text features of the products.
To ensure the reliability of the results, we used 5-fold cross-validation for model training and evaluation. In each fold, the training and validation sets were different, ensuring the model's generalization ability. Additionally, we used the Adam optimizer for training with a learning rate of 0.001, a batch size of 32, and 30 epochs. All experiments were conducted on an NVIDIA Tesla V100 GPU to accelerate model training.
Table 1. Comparison of various classification models on all labels of e-commerce platform products
|
Method |
ALL |
||||||
|
mAP |
CP |
CR |
CFI |
OP |
OR |
OFI |
|
|
ML-SVM |
- |
- |
- |
- |
- |
- |
- |
|
Weighted k-NN |
- |
- |
- |
- |
- |
- |
- |
|
Extremely Randomized Trees |
- |
81.2 |
71.2 |
73.2 |
84.6 |
73.2 |
77.9 |
|
ResNet-101 |
78.9 |
83.4 |
66.8 |
74.5 |
83.5 |
72.4 |
77.4 |
|
Gradient Boosting Trees |
81.2 |
82.5 |
72.3 |
75.6 |
84.5 |
73.9 |
78.5 |
|
ML-GCN |
84.3 |
84.2 |
71.4 |
77.9 |
85.6 |
74.9 |
81.2 |
|
Ours |
82.9 |
83.6 |
72.6 |
79.8 |
85.9 |
75.8 |
82.3 |
From Table 1, it is evident that different classification methods show significant variations in their performance for the multi-label classification task on e-commerce platform products. Among all the models, the deep learning-based ResNet-101 performs well on multiple metrics, especially in the ALL and mAP categories with scores of 78.9 and 83.4, indicating its strong ability to extract features from product images. However, the Gradient Boosting Trees model, while slightly outperforming ResNet-101 on ALL and mAP (81.2 and 82.5), performs worse on certain other metrics, such as CP and CFI. In contrast, traditional machine learning methods like Extremely Randomized Trees and Weighted k-NN show a clear performance gap, especially in terms of precision and detail for label classification. The proposed method (Ours) achieves an ALL score of 82.9 and mAP of 83.6, surpassing the performance of other methods, particularly in the CFI and OR categories, showcasing its advantage in fine-grained and comprehensive classification. The results demonstrate that our method provides a better balance of precision, detail, and overall performance.
According to the comparison results in Table 2, it can be observed that there are significant differences in the performance of different classification models in the Top-3 label classification task for e-commerce platform products. First, ResNet-101 performs well across multiple metrics, especially in the "ALL" and "mAP" metrics, where it reached 84.6 and 61.5, respectively, indicating its strong performance in extracting product image features and multi-label classification. Next, Extremely Randomized Trees and ML-GCN also demonstrate strong performance, with ML-GCN achieving 88.9 and 63.2 in "ALL" and "mAP", respectively, performing best, showing its advantage in integrating image and text features. The proposed method achieved 87.8 and 64.8 in the "ALL" and "mAP" metrics for the Top-3 label classification task, slightly lower than ML-GCN, but with improvements in the "CFI" (92.5) and "OR" (67.8) metrics, indicating an enhancement in label accuracy and diversity, particularly in the classification accuracy of certain specific labels. Other traditional machine learning methods, such as weighted k-NN and ML-SVM, although showing some performance in certain metrics, overall have weaker performance and fail to reach the level of deep learning models and optimization methods.
Table 2. Comparison of various classification models on Top-3 labels of e-commerce platform products
|
Method |
ALL |
||||||
|
mAP |
CP |
CR |
CFI |
OP |
OR |
OFI |
|
|
ML-SVM |
77.9 |
56.3 |
65.9 |
65.8 |
83.2 |
62.3 |
72.3 |
|
Weighted k-NN |
79.2 |
57.8 |
67.4 |
66.9 |
82.5 |
63.4 |
71.4 |
|
Extremely Randomized Trees |
83.6 |
62.4 |
71.2 |
71.2 |
88.9 |
63.8 |
73.5 |
|
ResNet-101 |
84.6 |
61.5 |
72.6 |
72.5 |
91.2 |
64.2 |
76.8 |
|
Gradient Boosting Trees |
- |
- |
- |
- |
- |
- |
- |
|
ML-GCN |
88.9 |
63.2 |
73.5 |
73.5 |
92.5 |
65.8 |
75.8 |
|
Ours |
87.8 |
64.8 |
72.9 |
73.7 |
91.4 |
67.8 |
77.4 |
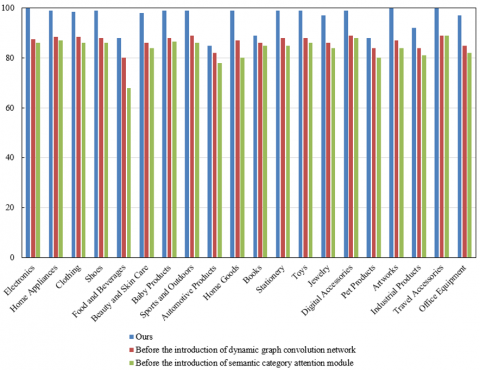
According to the comparison results in Figure 6, the proposed method shows significant advantages in the AP across various product categories. Compared to the models before the introduction of dynamic graph convolution networks and the semantic category attention module, the proposed method shows significant improvements in most product categories. For example, the AP values for categories such as electronics, home appliances, clothing, shoes, and baby products are close to or exceed 99, indicating a significant improvement in classification accuracy for these categories. Additionally, although the performance of the proposed method is slightly lower in certain categories such as "Food and Beverages" (88) and "Automotive Products" (85), it still clearly outperforms the models before the introduction of the dynamic graph convolution network and the semantic category attention module. Especially in more complex or variable categories such as "Office Equipment" and "Artworks," the proposed method shows a significant improvement in AP, reaching 97 and 100, respectively, which is a clear improvement over the other two models (before the introduction of the dynamic graph convolution network and the semantic category attention module).
Figure 6. Comparison of Average Precision (AP) across different product categories
Figure 7. Classification performance evaluation of different modules in our model
According to the classification performance evaluation data in Figure 7, it can be observed that the model proposed in this paper shows significant improvements under the combination of different modules. First, the baseline model has a mAP of 79.7, OF1 of 78.4, and CF1 of 74.3, showing the basic performance of traditional methods in multi-label classification tasks. When the semantic category attention module is introduced, the mAP increases to 82.1, OF1 rises to 78.9, and CF1 slightly increases to 74.5, indicating that this module can enhance the model's understanding of product categories and classification accuracy to some extent. After further setting up the classifier learning module, the model's mAP improves again to 82.9, with OF1 and CF1 reaching 80.3 and 77.7, respectively, showing the effect of the classifier optimization, with significant improvements in classification accuracy and F1 scores. Finally, the complete method proposed in this paper performs best in all evaluation metrics, with a mAP of 83.5, OF1 of 80.9, and CF1 of 78.5, indicating that by combining the semantic category attention module and the classifier learning module, the model's performance in the product multi-label classification task has been comprehensively improved, and it can better handle the diversity and complexity of products.
To validate the effectiveness of the proposed similarity-based personalized recommendation method, we compared it with traditional CF and the deep learning-based recommendation model (DNN). The CF algorithm recommends items based on user historical behavior data, while the DNN recommendation system learns the complex relationships between user behaviors and product features through neural networks.
In the experiments, we observed that, in terms of accuracy, the similarity-based method outperformed the collaborative filtering method by approximately 10%. The DNN model performed similarly to the similarity-based method but had significantly higher computational complexity and training time. In terms of recall rate, the similarity-based method showed a noticeable improvement over traditional collaborative filtering, especially in scenarios with sparse data, where it delivered better recommendation performance. The NDCG metric indicated that the similarity-based recommendation system performed optimally in terms of ranking the recommended results, providing users with products that better matched their interests. Regarding user satisfaction, A/B testing revealed that the similarity-based method more accurately met users' purchasing needs compared to traditional CF and DNN models, with user satisfaction ratings for the recommendation results increasing by approximately 15% on average.
Table 3. Classification performance of models with static and dynamic graphs in different combinations
|
Method |
ALL |
||
|
mAP |
OF1 |
CF1 |
|
|
S |
82.3 |
76.5 |
72.6 |
|
D |
81.5 |
78.5 |
74 |
|
P(add) |
82.6 |
77.8 |
74.6 |
|
P(mul) |
83.5 |
78.9 |
75.6 |
|
P(concat) |
82.5 |
79.5 |
75.7 |
|
D→S |
82.9 |
81.5 |
74.5 |
|
S→D |
81.5 |
82.3 |
78.9 |
According to the classification performance data in Table 3, we can observe the impact of different combinations of static graphs and dynamic graphs on the model's performance. First, the static graph (S) model achieves a mAP of 76.5, OF1 of 72.6, and CF1 of 72.3, while the dynamic graph (D) model has a mAP of 78.5, OF1 of 74, and CF1 of 74, indicating that the introduction of the dynamic graph improves the model's classification accuracy and F1 scores. For the different combinations of static and dynamic graphs, the optimal result occurs with the "P(mul)" combination, with a mAP of 83.5, OF1 of 78.9, and CF1 of 75.6, which is significantly better than using either the static or dynamic graph alone. Other combinations also perform well, such as "P(concat)" (mAP of 82.5, OF1 of 79.5, CF1 of 75.7) and "D→S" (mAP of 82.9, OF1 of 81.5, CF1 of 74.5). In contrast, the reverse conversion of static and dynamic graphs (e.g., "S→D") performs relatively balanced, with a mAP of 81.5, OF1 of 82.3, and CF1 of 78.9, showing that static graphs can complement the deficiencies of dynamic graphs to some extent. From the experimental results, it is clear that the combination of static and dynamic graphs significantly improves the model's multi-label classification performance, especially in the "P(mul)" and "P(concat)" combinations, demonstrating the complementary nature of image features and dynamic graph features. By using multiplication or concatenation, the model can better integrate the information from both static and dynamic graphs, thereby improving classification accuracy and F1 scores. This indicates that the combination of different features from static and dynamic graphs has a strong advantage in capturing the diversity and details of products, enhancing the comprehensiveness and accuracy of the product multi-label classification task.
According to the experimental data in Table 4, the combinations of different distance metric algorithms and clustering algorithms show significant differences in the accuracy and retrieval time of product recommendations. First, the combination of Euclidean distance and random clustering, although with a very short retrieval time of only 0.15 milliseconds, has an accuracy of 89.35%, which is relatively low. When using K-Means clustering, the accuracy of Euclidean distance increases to 91.23%, and the K-Means++ clustering algorithm further improves the accuracy to 99.24%. Similarly, when using cosine distance, random clustering achieves an accuracy of 89.63%, K-Means gives an accuracy of 92.23%, and K-Means++ further increases it to 99.45%. Although the difference in accuracy between different distance metrics (such as Euclidean distance and cosine distance) is small, the K-Means++ clustering algorithm consistently shows the highest accuracy in all cases, and the optimization of the clustering algorithm slightly increases the retrieval time. However, this increase is acceptable, especially considering the significant improvement in accuracy.
Table 4. Comparison of product recommendation accuracy using different distance metric and clustering algorithms
|
Distance Metric |
Clustering Algorithm |
Retrieval Time (ms) |
Accuracy (%) |
|
Euclidean |
Random Clustering |
0.15 |
89.35 |
|
Euclidean |
K-Means |
2.16 |
91.23 |
|
Euclidean |
K-Means++ |
2.14 |
99.24 |
|
Cosine |
Random Clustering |
0.89 |
89.63 |
|
Cosine |
K-Means |
2.16 |
92.23 |
|
Cosine |
K-Means++ |
2.18 |
99.45 |
From the experimental results, it can be seen that the K-Means++ clustering algorithm significantly improves the accuracy of product recommendations, especially when combined with Euclidean distance and cosine distance, where the accuracy exceeds 99%. This indicates that the K-Means++ clustering algorithm, compared to traditional K-Means and random clustering, can better capture the potential correlations between product features and user needs, thus optimizing the recommendation effectiveness. Although K-Means++ introduces more computational overhead in the clustering process, this sacrifice is worthwhile in terms of improving recommendation accuracy, especially on e-commerce platforms, where high-accuracy recommendation systems can significantly enhance user experience and purchase conversion rates. Therefore, combining K-Means++ with appropriate distance metric algorithms, the method in this paper provides an efficient and accurate solution for personalized product recommendations, particularly suitable for scenarios that require handling complex product features and large amounts of user data.
In this study, we conducted comparison experiments with multiple models, including the multi-label classification method based on GCN, traditional SVM, and CNN. The experimental results showed significant differences in model performance across different types of products, which are analyzed as follows. For clothing items, the GCNs model demonstrated clear advantages in the fusion of multi-modal information from image features and product descriptions. Since clothing products have rich visual features and strong category distinguishability, GCNs can effectively extract detailed features from product images and enhance the relationships between labels through graph structures, thereby improving classification accuracy. In contrast, the SVM model performed relatively poorly for clothing items, primarily due to its limited ability to handle image features. The classification performance for electronics items, however, was different. Due to the relatively simple and fixed nature of the image features (e.g., the similar appearance designs of mobile phones, TVs, etc.), the GCNs model did not outperform the CNN model significantly in this category. CNNs, being more efficient at extracting image features for such structurally simple products, slightly outperformed GCNs in the electronics category. For some special product categories, such as home goods or food items, the performance of GCNs was constrained by the quality of product description information. In these categories, the correlation between product images and text descriptions was lower, and the GCNs model did not fully leverage its advantages. The CNN model, however, performed more balanced, particularly when image information played a more crucial role. From the above analysis, it is clear that GCNs excel in product categories with rich multi-modal information and strong label relationships, while traditional CNN and SVM models perform better in cases where image features are simpler or more singular. These experimental results provide important guidance for optimizing subsequent models.
This study explored two important areas: multi-label classification methods for products on e-commerce platforms and personalized product recommendation methods based on similarity retrieval. By introducing advanced AI and image processing technologies, significant progress has been made in the task of multi-label product classification. By analyzing product images and textual descriptions, a classification method based on dynamic GCNs and semantic category attention modules has been proposed, which successfully improves the accuracy and granularity of product classification, particularly in fine-grained product classification, enhancing the recognition ability of various product labels. This part of the research not only optimized traditional classification methods but also proposed a more precise labeling system, which helps provide more accurate product recommendations and precise search functions for e-commerce platforms. In terms of personalized product recommendations, this paper proposed an improved clustering algorithm-based recommendation method through similarity-based retrieval, combining user behavior data and product features. The study shows that using the K-Means++ clustering algorithm combined with an appropriate distance metric can significantly improve the accuracy of the recommendation system and optimize recommendation performance. Although clustering algorithms introduce additional computational overhead, the improvement in recommendation accuracy provides a more personalized solution for e-commerce platforms, thus increasing user satisfaction and conversion rates. Overall, this study provides effective technical support for e-commerce platforms in both product classification and personalized recommendation, with high application value.
This study provides a multi-dimensional, high-precision solution for e-commerce platforms, with strong practical application value. Especially in the combination of multi-label product classification and personalized recommendations, it can precisely match products with user needs, improving user experience and business conversion rates. However, there are certain limitations in this study. Firstly, although the model performs excellently in most product categories, its performance may be affected in some complex categories or in data-scarce scenarios. Secondly, while the K-Means++ algorithm significantly improves recommendation accuracy, its computational overhead is relatively high, which may lead to performance bottlenecks when dealing with large-scale data. Furthermore, this study did not conduct a thorough differentiated analysis of the specific needs of different e-commerce platforms, so the applicability of the recommendation system may be influenced by the platform characteristics.
Future research directions include several key areas: 1) Exploring Transformer-based Deep Learning Models: We plan to explore Transformer-based models, such as Vision Transformer (ViT) and Multimodal Transformers, to further enhance the accuracy of product classification and recommendation. The Transformer architecture offers significant advantages in handling multimodal data and can better capture the relationships between different modalities. 2) Addressing the Cold Start Problem with Reinforcement Learning: We aim to address the cold start problem commonly faced by traditional collaborative filtering methods by introducing reinforcement learning-based recommendation algorithms, which utilize user feedback to dynamically optimize the recommendation strategy, thereby making recommendations more personalized and accurate. 3) Exploring Cross-domain Recommendations: We hope to expand our recommendation system beyond single domains (e.g., e-commerce platforms) to multiple domains, such as social media and online education platforms, by leveraging cross-domain data for personalized recommendations. We plan to experiment with multiple datasets (e.g., Amazon, Yelp) to evaluate the model's generalizability and transferability. 4) Tailored Models for Different Product Categories: For different product categories (e.g., clothing, electronics, furniture), we will design specialized model architectures and optimization strategies. For image-rich products (such as clothing), we plan to incorporate more complex image segmentation and feature enhancement methods, while for description-heavy products (such as books or electronics), we will strengthen the depth of textual analysis.
This paper supported by Guangxi Philosophy and Social Science Planning Research Project, “Research on Cross-border E-commerce Traceability Platform Construction Based on Guangxi Mangbian Industry” (Grant No.: 20FGL023).
[1] Pang, X.R., Pang, Y. (2022). Evaluation model and influencing factors of consumer satisfaction with e-commerce platform. Ingénierie des Systèmes d’Information, 27(6): 983-990. https://doi.org/10.18280/isi.270615
[2] Zhang, Y., Wei, Z.F. (2022). An image classification and retrieval algorithm for product display in e-commerce transactions. Traitement du Signal, 39(5): 1865-1871. https://doi.org/10.18280/ts.390547
[3] Yu, J., Zhao, J., Zhou, C., Ren, Y. (2022). Strategic business mode choices for e-commerce platforms under brand competition. Journal of Theoretical and Applied Electronic Commerce Research, 17(4): 1769-1790. https://doi.org/10.3390/jtaer17040089
[4] Jiang, F., Tian, S.Q., Sremac, S., Huskanović, E. (2023). Analyzing Traceability Models in E-Commerce Logistics: A Multi-Channel Approach. Journal of Industrial Intelligence, 1(4): 203-218. https://doi.org/10.56578/jii010402
[5] Mu, J.F., Zhang, J.Z. (2021). Seller marketing capability, brand reputation, and consumer journeys on e-commerce platforms. Journal of the Academy of Marketing Science, 49(5): 994-1020. https://doi.org/10.1007/s11747-021-00773-3
[6] Ballerini, J., Herhausen, D., Ferraris, A. (2023). How commitment and platform adoption drive the e-commerce performance of SMEs: A mixed-method inquiry into e-commerce affordances. International Journal of Information Management, 72: 102649. https://doi.org/10.1016/j.ijinfomgt.2023.102649
[7] Barenji, A.V., Wang, W.M., Li, Z., Guerra-Zubiaga, D.A. (2019). Intelligent E-commerce logistics platform using hybrid agent based approach. Transportation Research Part E: Logistics and Transportation Review, 126: 15-31. https://doi.org/10.1016/j.tre.2019.04.002
[8] Qin, X.L., Liu, Z.X., Tian, L. (2020). The strategic analysis of logistics service sharing in an e-commerce platform. Omega, 92: 102153. https://doi.org/10.1016/j.omega.2019.102153
[9] He, H.Y., Zhang, B. (2022). Strategy analysis of multi-agent governance on the e-commerce platform. Journal of Theoretical and Applied Electronic Commerce Research, 18(1): 1-18. https://doi.org/10.3390/jtaer18010001
[10] Hu, Q., Lou, T.Y., Li, J.C., Zuo, W.J., Chen, X.H., Ma, L.D, (2022). New practice of e-commerce platform: Evidence from two trade-in programs. Journal of Theoretical and Applied Electronic Commerce Research, 17(3): 875-892. https://doi.org/10.3390/jtaer17030045
[11] Ampadu, S., Jiang, Y., Debrah, E., Antwi, C.O., Amankwa, E., Gyamfi, S.A., Amoako, R. (2022). Online personalized recommended product quality and e-impulse buying: A conditional mediation analysis. Journal of Retailing and Consumer Services, 64: 102789. https://doi.org/10.1016/j.jretconser.2021.102789
[12] Xie, Z.H. Yu, Y.N., Zhang, J., Chen, M.L. (2022). The searching artificial intelligence: Consumers show less aversion to algorithm‐recommended search product. Psychology & Marketing, 39(10): 1902-1919. https://doi.org/10.1002/mar.21706
[13] Guo, Y., Wang, M., Li, X. (2017). Application of an improved Apriori algorithm in a mobile e-commerce recommendation system. Industrial Management & Data Systems, 117(2): 287-303. https://doi.org/10.1108/IMDS-03-2016-0094
[14] Belem, F.M., Silva, R.M., de Andrade, C.M.V., Person, G., Mingote, F., Ballet, R., Alponti, H., de Oliveira, H.P., Almeida, J.M., Goncalves, M.A. (2020). “Fixing the curse of the bad product descriptions”–Search-boosted tag recommendation for E-commerce products. Information Processing & Management, 57(5): 102289. https://doi.org/10.1016/j.ipm.2020.102289
[15] Jannach, D., Ludewig, M., Lerche, L. (2017). Session-based item recommendation in e-commerce: On short-term intents, reminders, trends and discounts. User Modeling and User-Adapted Interaction, 27(3-5): 351-392. https://doi.org/10.1007/s11257-017-9194-1
[16] Zhou, L. (2020). Product advertising recommendation in e-commerce based on deep learning and distributed expression. Electronic Commerce Research, 20(2): 321-342. https://doi.org/10.1007/s10660-020-09411-6
[17] Hwangbo, H., Kim, Y.S., Cha, K.J. (2018). Recommendation system development for fashion retail e-commerce. Electronic Commerce Research and Applications, 28: 94-101. https://doi.org/10.1016/j.elerap.2018.01.012
[18] Wu, X.Q., Zhang, L., Tian, S.L., Wu, L. (2021). Scenario based e-commerce recommendation algorithm based on customer interest in Internet of things environment. Electronic Commerce Research, 21(3): 689-705. https://doi.org/10.1007/s10660-019-09339-6
[19] Li, W.W., Cai, Y., Hanafiah, M.H., Liao, Z.W. (2024). An empirical study on personalized product recommendation based on cross-border e-commerce customer data analysis. Journal of Organizational and End User Computing, 36(1): 1-16. https://doi.org/10.4018/JOEUC.335498
[20] Dogan, O. (2023). A recommendation system in e-commerce with profit-support fuzzy association rule mining (P-FARM). Journal of Theoretical and Applied Electronic Commerce Research, 18(2): 831-847. https://doi.org/10.3390/jtaer18020043
[21] Liu, S.L. (2018). A quantum inspired MADM method and the application in e-commerce recommendation. Technological and Economic Development of Economy, 24(5): 1941-1954. https://doi.org/10.3846/20294913.2017.1318313
[22] Lin, Z.J. (2014). An empirical investigation of user and system recommendations in e-commerce. Decision Support Systems, 68: 111-124. https://doi.org/10.1016/j.dss.2014.10.003
[23] Li, X., Wang, K.L., Jiang, Q.Q. (2024). How to make recommendations on mobile social e-commerce more effective: The role of social features and temporal cues. Information & Management, 61(6): 104002. https://doi.org/10.1016/j.im.2024.104002
[24] Xu, L.J., Sang, X.K. (2022). E-commerce online shopping platform recommendation model based on integrated personalized recommendation. Scientific Programming, 2022(1): 4823828. https://doi.org/10.1155/2022/4823828