Xiaoli Xu![]() | Fangyuan Lei
| Fangyuan Lei![]() | Hui Liu*
| Hui Liu*![]()
© 2024 The authors. This article is published by IIETA and is licensed under the CC BY 4.0 license (http://creativecommons.org/licenses/by/4.0/).
OPEN ACCESS
With the rapid development of Artificial Intelligence (AI) and deep learning technologies, image recognition has become a key research direction in the field of product design. Traditional product design relies heavily on human expertise, facing challenges such as low efficiency and unstable quality. In contrast, automated techniques based on image recognition can significantly improve the efficiency and accuracy of the design process. The automatic extraction and classification of product design elements not only help designers quickly acquire information about the structure and layout of a product but also optimize design decisions, accelerating innovation and enhancing market responsiveness. However, existing image recognition methods often depend on shallow, handcrafted feature extraction, which struggles to handle the deep feature extraction and accurate classification of complex design images, especially in situations involving complex backgrounds, occlusions, or diverse design elements, where recognition performance is often suboptimal. To address these challenges, this paper proposes a deep learning-based method for automated extraction and classification of product design elements. First, a deep feature extraction method based on residual networks is introduced, which effectively captures the complex features of design elements through a multi-level network structure. Next, a classification method based on a spatial pyramid attention mechanism is designed, enabling efficient classification and localization of design elements at different scales and perspectives. Experimental results demonstrate that the proposed method significantly outperforms traditional approaches in terms of accuracy and robustness, effectively handling the challenges of complex design images. This research not only provides an efficient and accurate automation tool for the product design field but also offers new insights into the application of image recognition technology in design optimization.
image recognition, product design elements, deep feature extraction, residual networks, spatial pyramid attention mechanism, automated classification
With the rapid development of AI technology, computer vision and deep learning methods have been widely applied in various fields, especially in product design, where image recognition technology provides strong support for product innovation and optimization [1-4]. In traditional product design processes, designers rely on experience and intuition to select and arrange elements, but this process is often limited by personal perspective, time constraints, and efficiency issues [5-7]. With the accumulation of large amounts of product image data, how to automatically extract effective design elements from design images, analyze and optimize design solutions, has become a key issue that needs to be addressed in the current product design field. Therefore, the research on automated extraction and classification of product design elements based on image recognition technology has gradually become an important research direction in both academia and industry.
The application of image recognition technology in product design can help designers quickly obtain structural features and layout information of design elements, provide data support for product innovation, and improve design efficiency and quality through automation [8-11]. By automatically analyzing and classifying product design images, manual intervention can be reduced, design consistency and accuracy can be improved, and the product design process can be optimized. In addition, this research can help enterprises reduce product development cycles, lower costs, and improve market responsiveness and competitiveness [12-15]. Therefore, developing image recognition-based automated product design element extraction and classification technology has important academic value and broad application prospects.
Although existing research has made some progress in the image recognition and classification of product design elements, there are still some shortcomings in current methods [16-19]. Traditional image feature extraction methods often rely on shallow, handcrafted features, lacking the ability to accurately identify deeper, more complex design elements. Furthermore, existing classification methods often face issues of low accuracy and insufficient robustness when dealing with complex design patterns [20-25]. Especially when processing design images with diversity, complex backgrounds, or partial occlusions, traditional algorithms often perform unsatisfactorily. Therefore, how to maintain high accuracy while improving the robustness of the method has become a significant challenge in current research.
This paper addresses the shortcomings of existing methods and proposes a deep learning-based image recognition technology aimed at improving the automated extraction and classification of product design elements. The main content of the study includes two aspects: first, the residual network for deep feature extraction of product design elements, which effectively captures the complex design features in images through a multi-level deep learning model; second, the design element classification method based on the spatial pyramid attention mechanism, which enables efficient classification and localization of design elements at different scales and perspectives. Through the combination of these two technologies, this paper not only improves the accuracy of design element recognition but also enhances the adaptability and robustness of the method. The research results are expected to provide an efficient and accurate automated tool for the product design industry, promote the intelligentization of product design, and offer valuable references for related research fields.
This paper aims to enhance the automatic extraction and classification ability of product design elements by combining deep feature extraction residual networks with a spatial pyramid coordinate attention mechanism, utilizing deep learning technology. Product design images are first processed through the deep feature extraction residual network. This network effectively solves the gradient vanishing problem in deep training of traditional convolutional neural networks by using multi-layer residual structures, allowing the model to capture richer design element features. In this process, the network not only extracts spatial information from the image but also deeply mines spectral information, such as color, texture, and other visual features, thus conducting a comprehensive analysis of product design elements from both spatial and spectral dimensions. After feature extraction, the paper further introduces a spatial pyramid coordinate attention mechanism. This mechanism integrates multi-scale information, effectively improving the network's adaptive attention to local features of design elements. Through the spatial pyramid structure, the model can capture local detail features at different scales, addressing the potential loss of details in design images. The coordinate attention mechanism further enhances the relationship between spatial features and spectral features by assigning different weights to spatial information at different positions, improving sensitivity to detailed parts in complex design patterns. This approach not only enhances the representation ability of local features but also ensures more accurate identification of key regions of product design elements in various design scenarios. Finally, through a cross-attention fusion module, spatial features and spectral features are effectively fused, providing more precise input for the final element classification.
The deep feature extraction network used combines multi-scale residual networks with an adaptive spatial-spectral joint feature capturing module. The multi-scale residual network introduces three different multi-scale residual blocks to extract multi-level deep semantic information and detail features from images. These residual blocks interact through forward propagation, enabling the network to effectively integrate deep semantic features of the image at different scales while retaining and enhancing shallow feature information, thus helping to improve the accurate recognition and classification of product design elements.
Figure 1. Various residual blocks in the multi-level transmission fusion residual network
On this basis, the adaptive spatial-spectral joint feature capturing module adopts a dual-branch structure, which can adaptively capture and process the spatial-spectral joint features and multi-resolution features in design images. This design helps the network maintain high sensitivity and accuracy when processing design elements at different resolutions and spatial locations. Feature maps are processed and transmitted through multiple multi-scale residual blocks, and after convolution, max pooling, and fully connected layers, they are merged through an adaptive weighted summation mechanism to further optimize feature representation. Finally, the output is normalized using a SoftMax activation function to achieve accurate classification of product design elements.
To achieve efficient feature extraction and classification, the multi-level transmission fusion residual network optimizes the integration and transmission of features at different scales and depths through the interaction and fusion of multiple residual blocks. Figure 1 shows the various residual blocks in the multi-level transmission fusion residual network. Specifically, the multi-scale residual blocks A, B, and C in the network process features at different levels, with residual block A combining 2D convolution and depthwise separable convolution (DSC) to generate diverse shallow features, reducing computational complexity and providing a foundation for subsequent information transmission. Residual block B uses 2D convolution kernels across multiple dimensions to extract deep features from the image, and exchanges information with other blocks through segmented outputs. Residual block C integrates features from multiple perspectives, capturing global contextual information and deep semantics, further enhancing the network's expressiveness. Through this multi-level, cross-scale information interaction, the network can effectively capture the complex features of product design elements, providing strong support for subsequent classification tasks.
The feature extraction in this study is based on a 50-layer residual network, which consists of 48 convolutional layers and two fully connected layers, with the ReLU activation function applied. Each convolutional layer uses a 3×3 kernel with a stride of 1, and the number of output feature maps gradually increases from 64 to 2048. The residual blocks employ skip connections to prevent gradient vanishing and enhance the stability of training. Following this, the classification module is implemented with a fully connected layer acting as the classifier, outputting a probability distribution for the design element categories. The fully connected layer is followed by a SoftMax activation function for multi-class classification. During training, the model is optimized using the cross-entropy loss function. The Adam optimizer is used with an initial learning rate of 0.001, 30 iterations per epoch, a batch size of 32, and a total of 100 epochs. To improve the model's generalization ability, data augmentation techniques, including rotation, scaling, and translation, are applied during data preprocessing.
The core advantage of this multi-level transmission fusion strategy lies in the interaction and fusion of information between residual blocks, enabling the network to establish connections between features at different levels and ensuring effective integration of shallow features and deep semantic information. Specifically, the output of residual block A is divided into multiple parts and interacts with the outputs of residual blocks B and C. After weighted summation, a comprehensive feature representation is formed. These fused features not only retain rich spatial detail information but also capture deep semantic information, allowing the network to perform accurate classification of product design elements at different scales. This structure enables the network to maintain high classification accuracy when handling design images with complex backgrounds and diverse features, fully meeting the need for automated extraction and classification of product design elements.
In the task of automatic extraction and classification of product design elements, design images often contain complex spatial structures and multi-level semantic information, which present high local and diversity characteristics. Therefore, although traditional convolutional neural networks perform well in feature extraction, they often overlook the spatial relationships between local features and the information transmission across different scales. Especially in the classification task of product design elements, the importance of different parts of the design image varies spatially, with some local details being more representative or recognizable than others. To address this issue, this paper introduces the spatial pyramid coordinate attention mechanism. This mechanism uses multi-scale perspectives and a weighted approach for local spatial information, enabling the model to adaptively focus on important features at different positions and scales in the input image. In product design images, local details and global structures are closely related, and the spatial pyramid coordinate attention mechanism can extract spatial-spectral joint features at different levels and scales, capturing important local areas and global contextual information in design elements. This mechanism not only enhances the model’s focus on detailed features but also helps the model better understand and recognize the complex structures and subtle changes in design images. Figure 2 shows the overall network architecture for product design element classification.
Residual networks, as a significant advancement in deep learning, primarily address the issues of gradient vanishing and gradient explosion in training deep neural networks by introducing residual connections. These connections allow signals to bypass certain layers of the network and pass directly through, which greatly accelerates the training process and improves the network's performance. The success of ResNet has enabled the training of much deeper networks, thereby allowing for more effective extraction of complex design features from images. ResNet-50 was chosen as the base network architecture because it achieves good feature extraction results with fewer computational resources and has been widely validated for its effectiveness in computer vision tasks. The Spatial Pyramid Attention mechanism extracts multi-level features of an image through multi-scale convolutional layers and combines global context information to capture both local and global structures within the image. When processing complex product design elements, features at different scales are crucial for accurate recognition. Traditional convolutional neural networks often struggle to effectively handle multi-scale information, whereas the Spatial Pyramid Attention mechanism weights features at different scales layer by layer, enabling the network to efficiently recognize design elements across multiple scales. Its advantage lies in the ability to accurately classify and localize design elements from various perspectives and scales, making it particularly well-suited for complex and dynamic product design datasets.
The core idea of the proposed spatial pyramid coordinate attention mechanism is to enhance feature extraction and expression capabilities for features at different scales and spatial locations in the image through multi-scale spatial pyramid pooling and coordinate attention techniques. This paper first focuses on extracting local and global spatial features from the image using the spatial pyramid coordinate squeezing (SPCS) mechanism. It employs spatial pyramid pooling operations to effectively aggregate features from different scales. Specifically, this mechanism performs pooling operations on feature maps at different scales, capturing multi-level spatial information and significantly improving the network’s ability to perceive spatial structures. Then, by compressing these multi-scale features, it fuses local and global features, enabling the network to accurately model the spatial layout of design elements at multiple scales, thereby enhancing the recognition and classification capabilities for elements in complex design images. Furthermore, the spatial pyramid coordinate excitation (SPCE) mechanism ensures that the expression ability of spatial features is adaptively enhanced. This mechanism assigns appropriate weights to spatial features of different regions and scales by combining spectral feature information. Specifically, it adapts to each spatial position in the feature map, ensuring that the model automatically focuses on important spatial positions and design elements. This mechanism not only optimizes the representation of spatial features but also enhances the extraction of spectral information, enabling the network to more accurately capture detailed information and structural features in product design element classification tasks.
Figure 2. Overall network architecture of product design element classification method
Figure 3. Structure of SPCS mechanism
Figure 4. Structure of the SPCE mechanism
(1) SPCS Mechanism
The SPCS mechanism is designed to improve the accurate extraction of local and global information in the product design element classification task. Figure 3 shows the structure of this mechanism. The main goal of this mechanism is to enhance the network’s perception of spatial structures and details in complex design images by aggregating spatial features from different scales. The mechanism first performs multi-scale pooling operations on the input feature map. During this process, the feature map undergoes one-dimensional global pooling along the vertical and horizontal directions, generating two merged feature vectors, EDQ and EDG. These two pooling vectors effectively capture long-range interactions in the image, thereby enhancing the expression of global information. This pooling method enables the mechanism to preserve long-range spatial dependencies in the image while maintaining efficiency. Furthermore, the mechanism performs two-dimensional adaptive average pooling to further optimize the extraction of local region information, generating multiple pooled feature maps ED1, ED2, and ED3, corresponding to feature regions of sizes 3×3, 6×6, and 8×8, respectively. Through these multi-scale pooling operations, the mechanism captures multi-level spatial information in design images, from detailed to global, significantly enhancing the multi-scale perception ability of product design elements.
Furthermore, to ensure that the multi-scale local and global spatial features are effectively input into the subsequent spectral attention mechanism, the mechanism reshapes and flattens the pooled feature maps to generate reshaped and flattened feature maps, ED. These feature maps include feature vectors EDQ, EDG, and aggregated features ED1, ED2, and ED3 at multiple scales. Each feature map corresponds to the number of image blocks at different scales, such as 9×, 36×, and 64×, representing feature regions from small to large scales. These feature maps are concatenated along the spatial dimension to form a large-scale spatial feature set TD. Specifically, let features EDQ, EDG, ED1, ED2, and ED3 be represented as dqe$\in$RZ×G×1, dge$\in$RZ×G×1, d1e$\in$RZ×9×1, d2e$\in$RZ×36×1, and d3e$\in$RZ×64×1, where the height and width of feature DL are denoted by G and Q. The pooled feature maps ODQ, ODG, OD1, OD2, and OD3 in the z-th channel are represented by dgoz(g), dqoz(g), d1oz, d2oz, and d3oz. Adaptive AvgPool is denoted by AA(*). Finally, the feature TD is generated and denoted as dt$\in$RZ×(G+Q+T)×1, and there are:
$\left\{\begin{array}{l}d_{o z}^g(g)=\frac{1}{Q} \sum_{q=1}^Q d_z(g, q) \\ d_{o z}^q(g)=\frac{1}{G} \sum_{g=1}^G d_z(g, q) \\ d_{o z}^1=A A(3) \\ d_{o z}^2=A A(6) \\ d_{o z}^3=A A(8)\end{array}\right.$ (1)
Thus, assuming the output feature in the z-th channel after the SPCS mechanism is dtz, the spatial dimension concatenation operation is denoted by [ ]. The reshaped features EDQ, EDG, ED1, ED2, and ED3 in the z-th channel are represented as dgez, sqez, d1ez, d2ez, and d3ez. The concatenation of feature DL in the z-th channel along the spatial dimension can be represented by the following formula:
$d_{t z}=\left[d_{e z}^g, d_{e z}^q, d_{e z}^1, d_{e z}^2, d_{e z}^3\right]$ (2)
(2) SPCE Mechanism
The main function of the SPCE mechanism is to help the network focus more precisely on key areas in the image by combining spectral and spatial features, thereby improving classification accuracy. Figure 4 shows the structure of this mechanism. The basic principle of this mechanism is to use the precise spatial information contained in the feature map, generating a series of attention maps to enhance the model’s ability to perceive different spatial regions and scales. Specifically, this mechanism first encodes the feature maps with multi-scale information and precise location information into two main attention maps. These two attention maps can capture spatial dependencies along specific directions, effectively retaining important spatial information in the image in the generated spectral attention map. This operation ensures that the SPCE mechanism can focus on key information at different positions and scales in the product design element classification task, allowing the model to automatically adjust its attention to local and global structures in the image and avoid overfocusing on irrelevant areas.
In the SPCE mechanism, the generation process of the spectral attention map is achieved through a two-step operation. The mechanism first reduces the number of channels in the spatial feature map to a certain proportion of the original size using convolution operations, thereby reducing the computational complexity and optimizing feature representation. Then, the compressed feature map is split from the spatial dimension into two groups and undergoes channel expansion to generate channel weights with different spatial features. These channel weights allow the model to dynamically adjust and weigh features at different spatial positions, effectively capturing spectral features that integrate various spatial information. In the product design element classification task, this mechanism can adaptively enhance attention to critical local areas in the design image, while suppressing the impact of unimportant regions, helping the model understand the structure and features of design elements from global to local. The specific steps are as follows:
1) Feature Processing and Channel Dimensionality Reduction
Process the aggregated spatial features. Through a 1×1 convolution operation, the model reduces the channel number of the input features to 1/e of the original size. After the convolution operation, the feature map is standardized using batch normalization to ensure the model maintains a stable learning rate during training and accelerates convergence. Let the Mish activation function be denoted as σ. The convolution operation is denoted as D1. The kernel size is denoted as Z/e×C×1×1, with the number of output and input channels being Z/e and Z, respectively, and the reduction ratio being e. The expression for the feature dt obtained after feature processing and channel dimensionality reduction is:
$d_l=\sigma\left(D_1\left(d_t\right)\right)$ (3)
After the above operation, the size of dt becomes Z/e×T×1.
2) Spatial Dimension Splitting and Reshaping
After the channel reduction and batch normalization, the SPCE mechanism splits and reshapes the feature map from the spatial dimension into two groups. One group contains the feature maps with precise location information, denoted as row features LDG and column features LDQ. These feature maps can capture dependencies along the horizontal and vertical directions in the image, further emphasizing the importance of spatial structure in the image. The other group contains feature maps with multi-scale information, denoted as LD1, LD2, and LD3, with sizes of 3×3, 6×6, and 8×8, respectively. Through this multi-scale splitting and reshaping, the mechanism can effectively retain spatial information at different scales, helping the model focus on different levels of spatial details when processing product design elements. Let the convolution operation with kernel size Z×Z/e×1×1 be denoted as Dg and Dq. LDG and LDQ are denoted as dgl and dql, thus:
$\left\{\begin{array}{l}h^g=\sigma\left(D_g\left(d_l^g\right)\right) \\ h^q=\sigma\left(D_q\left(d_l^q\right)\right)\end{array}\right.$ (4)
3) Weighted Summation and Focus on Spectral Information
After the spatial dimension splitting, the SPCE mechanism performs weighted summation on the row features, column features, and multi-scale features LD1, LD2, and LD3. This weighted operation allows the SPCE mechanism to fuse information at different levels of global and local features, ensuring that important spatial regions receive more attention. By applying weighted processing to the feature map, the mechanism enhances the model’s focus on spectral information for precise location regions, especially for parts of the image with special structures or design elements. Let the feature DL in the z-th channel be denoted as dz(g,q), and the coordinate feature in the z-th channel be denoted as dzpE(g,q). After applying hg and hq to the feature map DL, the weighted summation of hg, hq, and DL is:
$d_E^P(g, q)=d_z(g, q) \times h_z^g(g) \times h_z^q(q)$ (5)
4) Convolution Operation and Spectral Attention Feature Extraction
To extract richer spectral attention features from the multi-scale features, the SPCE mechanism convolves the split multi-scale features with convolution kernels. Each scale’s feature is convolved with convolution kernels of different sizes. Specifically, LD1, LD2, and LD3 are convolved with convolution kernels of sizes Z×Z/e×3×3, Z×Z/e×6×6, and Z×Z/e×8×8, respectively, resulting in spectral attention features h1, h2, and h3 at different scales. Let LD1, LD2, and LD3 be denoted as d1l, d2l, and d3l, and the sum of h1, h2, and h3 be denoted as ht$\in$RZ×1×1, thus:
$\left\{\begin{array}{l}h^1=D_1\left(d_l^1\right) \\ h^2=D_2\left(d_l^2\right) \\ h^3=D_3\left(d_l^3\right)\end{array}\right.$ (6)
Let the feature in the z-th channel be denoted as dtoE(g,q), and the multi-scale feature is denoted with the superscript to.
5) Feature Integration and Spectral Attention Map Generation
The spatial pyramid coordinate attention feature in the z-th channel can be represented as:
$d_E(g, q)=d_z(g, q)+d_E^{z p}(g, q)+d_E^{t o}(g, q)$ (7)
By convolving the multi-scale features and extracting spectral attention features, the SPCE mechanism generates spatial pyramid coordinate attention features for each channel. These attention features can adaptively focus on important regions in the image and further optimize the spatial-spectral joint feature representation through fusion with other features.
6) Feature Fusion and Final Output
Finally, the SPCE mechanism fuses the original feature map with the generated spectral attention features via skip connections. This fusion operation, by connecting the feature map with the spectral attention map, further enhances the model’s spatial-spectral feature representation. With the combination of batch normalization, 1×1 convolution, Sigmoid activation function, and concatenation operation, the SPCE mechanism generates the final spatial pyramid coordinate attention features. These features not only encompass information from different spatial scales but also adapt to changes in complex design elements in the image.
The deep learning-based design element extraction and classification method proposed in this study holds significant potential in various practical application scenarios. In the field of industrial design, this method can automatically extract and classify design elements, assisting designers in quickly iterating design solutions and significantly reducing the workload of manual annotation. By automating the recognition of design elements, designers can focus more on creativity and innovation, enhancing design efficiency. In consumer product development, especially in industries such as home appliances, automobiles, and electronics, the automatic extraction and classification of design elements enable companies to swiftly identify market trends, optimize product designs, and shorten product development cycles. Furthermore, the model can help developers select the most promising design elements in the early stages of the design process, improving product market competitiveness. In the field of smart manufacturing, with the continuous advancement of intelligent production processes, this method can closely integrate the extraction of design elements with the manufacturing process. By integrating with CAD systems and Manufacturing Execution Systems (MES), it can achieve seamless linkage between design and production, greatly enhancing production efficiency. However, practical applications still face some challenges. Firstly, the diversity of design data and the scarcity of annotated data limit the model's generalization ability. To address this, we will employ data augmentation techniques and utilize Generative Adversarial Networks (GANs) to supplement the data in future work.
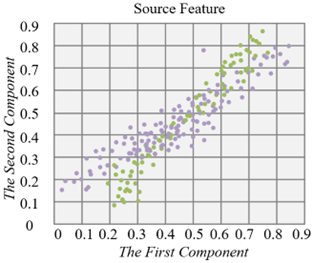
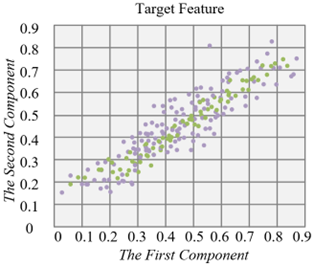
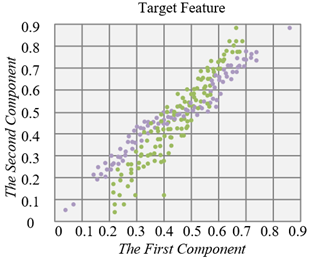
Figures 5 and 6 show the application results of the proposed deep feature extraction residual network on two datasets: CAD design images, product images, and icon sets. Specifically, the horizontal and vertical axes in the figure represent the first and second feature components of product design images extracted under the spectral attention model, demonstrating the feature distribution of the source and target domains. By comparing the results before and after the introduction of the residual network, it can be seen that after processing with the residual network, the feature distribution difference between the source and target domains is significantly reduced, and the feature distribution tends to become more consistent. Especially in the target domain, the feature distribution of design elements is much closer to that of the source domain, effectively alleviating the spectral shift issue between product design images in different domains. This indicates that the deep feature extraction network effectively enhances the transferability of image features, helping to improve classification performance across different data sources.
From the experimental results, the introduction of the deep feature extraction residual network significantly enhanced the model’s ability to recognize and transfer features from product design images. This is particularly evident when there is a large distribution difference between the source and target domains, where it effectively mitigates the spectral shift problem. Specifically, the feature distribution of the target domain is closer to the source domain, indicating that the network can better capture design element features in the image, improving cross-domain adaptability and robustness. This improvement not only enhances the recognition accuracy of design elements but also increases the method’s adaptability to different types of design images, providing more reliable technical support for automated product design element classification and extraction.
From Table 1, it is evident that Proposed Method 1 performs significantly better in the classification task of the CAD design dataset. Specifically, Proposed Method 1 has an overall accuracy (OA) of 99.263% and a Kappa coefficient of 99.58, which is significantly higher than other mainstream algorithms (such as ResNet, Mask R-CNN, Cascade R-CNN, YOLOv5, etc.), where OA and Kappa coefficients are generally lower than 96%. In particular, compared with YOLOv5 and Swin Transformer, Proposed Method 1 shows a notable improvement in accuracy, with OA increasing by 4.013% and 3.536%, respectively. Furthermore, Proposed Method 1 also demonstrates relatively balanced performance in classification accuracy across different categories, showing high accuracy in both extracting complex design elements and recognizing different scales and perspectives. Overall, Proposed Method 1 exhibits superior performance in classification accuracy, adaptability, and robustness compared to other methods.
Figure 5. Comparison of feature distribution before and after the introduction of the deep feature extraction residual network in CAD design dataset
Figure 6. Comparison of feature distribution before and after the introduction of the deep feature extraction residual network in product image and icon set
Table 1. Classification results of CAD design dataset
|
Class |
ResNet |
Mask R-CNN |
Cascade R-CNN |
YOLOv5 |
DETR |
Swin Transformer |
Attention U-Net |
Proposed Method |
|
1 |
84.25 |
91.25 |
93.26 |
94.25 |
96.32 |
91.25 |
96.36 |
98.26 |
|
2 |
86.32 |
92.36 |
92.54 |
95.68 |
95.20 |
99.32 |
95.62 |
99.26 |
|
3 |
74.12 |
81.25 |
87.56 |
95.22 |
95.62 |
97.26 |
97.51 |
99.61 |
|
4 |
85.33 |
87.56 |
92.36 |
94.26 |
96.63 |
96.36 |
97.56 |
99.47 |
|
5 |
85.69 |
91.23 |
94.12 |
93.36 |
97.26 |
97.25 |
97.12 |
101.23 |
|
6 |
91.24 |
93.26 |
95.23 |
96.89 |
98.32 |
95.62 |
97.26 |
100.23 |
|
7 |
85.26 |
84.25 |
92.36 |
95.61 |
92.32 |
95.66 |
97.32 |
98.56 |
|
8 |
83.62 |
91.23 |
93.36 |
95.26 |
96.35 |
96.36 |
97.36 |
99.36 |
|
9 |
88.12 |
92.36 |
92.54 |
94.26 |
92.55 |
95.62 |
96.23 |
99.84 |
|
OA |
87.02 |
92.54 |
93.21 |
95.62 |
96.35 |
97.26 |
97.52 |
99.51 |
|
AA |
84.25 |
88.95 |
92.56 |
97.56 |
95.87 |
97.21 |
97.21 |
99.66 |
|
Kappa |
88.95 |
91.26 |
96.36 |
96.33 |
98.66 |
97.26 |
99.33 |
99.58 |
Table 2. Classification results of product images and icon set
|
Class |
ResNet |
Mask R-CNN |
Cascade R-CNN |
YOLOv5 |
DETR |
Swin Transformer |
Attention U-Net |
Proposed Method |
|
1 |
72.26 |
95.36 |
91.23 |
95.23 |
95.62 |
97.15 |
92.36 |
100.12 |
|
2 |
95.36 |
96.26 |
96.32 |
96.32 |
98.26 |
97.56 |
95.62 |
100.23 |
|
3 |
67.26 |
96.66 |
97.45 |
94.21 |
87.26 |
98.26 |
97.56 |
100.12 |
|
4 |
88.62 |
95.12 |
92.36 |
98.26 |
96.32 |
97.15 |
97.25 |
100.26 |
|
5 |
84.26 |
97.26 |
95.62 |
93.25 |
95.12 |
99.36 |
96.23 |
98.56 |
|
6 |
89.62 |
94.26 |
97.56 |
93.26 |
94.20 |
98.25 |
95.25 |
100.14 |
|
7 |
92.36 |
96.23 |
97.25 |
95.14 |
96.36 |
98.25 |
96.61 |
98.26 |
|
8 |
89.26 |
83.21 |
96.23 |
95.21 |
95.21 |
98.26 |
98.25 |
100.14 |
|
9 |
95.62 |
92.36 |
95.25 |
92.01 |
93.16 |
100.54 |
98.26 |
100.22 |
|
10 |
82.36 |
93.25 |
96.61 |
94.12 |
94.28 |
97.36 |
100.54 |
98.26 |
|
11 |
87.26 |
94.25 |
95.15 |
95.23 |
96.32 |
99.61 |
97.36 |
100.25 |
|
12 |
91.23 |
95.62 |
96.25 |
95.25 |
93.21 |
98.54 |
99.61 |
98.26 |
|
13 |
88.26 |
94.26 |
93.32 |
92.35 |
95.26 |
97.21 |
98.54 |
100.14 |
|
14 |
93.26 |
95.26 |
92.32 |
95.68 |
94.28 |
98.02 |
97.21 |
100.25 |
|
15 |
94.25 |
93.65 |
83.15 |
98.31 |
92.23 |
97.12 |
94.28 |
100.36 |
|
16 |
95.26 |
95.84 |
95.26 |
94.02 |
95.28 |
100.23 |
100.45 |
100.26 |
|
OA |
91.24 |
95.26 |
94.26 |
95.26 |
95.33 |
98.32 |
95.28 |
98.98 |
|
AA |
87.25 |
96.32 |
94.23 |
95.66 |
94.12 |
98.55 |
95.33 |
98.65 |
|
Kappa |
92.03 |
95.26 |
94.25 |
95.64 |
92.03 |
98.26 |
96.23 |
98.23 |
From Table 2, it is evident that Proposed Method 1 shows a clear advantage in the classification task of the product images and icon set, particularly in terms of overall accuracy (OA), average accuracy (AA), and the Kappa coefficient, all of which outperform other mainstream algorithms. Specifically, Proposed Method 1 achieves an OA of 98.98%, an AA of 98.65%, and a Kappa coefficient of 98.23%, all of which are the highest among the methods evaluated. These metrics are significantly higher than those of other models such as ResNet, Mask R-CNN, and YOLOv5. Compared to traditional models like YOLOv5 and ResNet, Proposed Method 1 increases overall accuracy by 3.74% to 7.72%, while the Kappa coefficient also shows a significant improvement (2.59% higher than YOLOv5). Additionally, the classification accuracy for individual categories is excellent, with nearly all categories achieving near or above 100% accuracy, demonstrating high precision and stability in classifying complex product design elements.
The analysis of the experimental results shows that the deep learning-based image recognition technology proposed in this paper has significant performance advantages in the automatic classification tasks of both datasets. Especially when combined with the deep feature extraction residual network and spatial pyramid attention mechanism, Proposed Method 1 not only surpasses existing image recognition models in terms of overall accuracy and Kappa coefficient, but also performs exceptionally well in fine-grained classification accuracy across different categories. This indicates that Proposed Method 1 not only improves classification accuracy when processing complex design elements but also effectively handles classification tasks across various scales and perspectives, thereby significantly enhancing the model's adaptability and robustness.
From Table 3, it can be seen that Proposed Method 1 has certain advantages and disadvantages in terms of training and testing time as well as the number of parameters compared to other mainstream methods. Specifically, the training times for Proposed Method 1 on the CAD design dataset and the product images and icon set are 589.15 seconds and 778.26 seconds, respectively, which are slightly longer compared to methods like ResNet and YOLOv5. However, the testing time for Proposed Method 1 is relatively impressive, particularly for the CAD design dataset, where the testing time is 51.23 seconds, which is more stable compared to YOLOv5 (47.26 seconds) and Swin Transformer (57.26 seconds). Moreover, the number of parameters for Proposed Method 1 is 326.25 × 10⁴, which is higher than some lightweight models like YOLOv5 (36.26 × 10⁴), but comparable to other deep networks such as Mask R-CNN (362.26 × 10⁴) and DETR (289.36 × 10⁴), and within a reasonable range for achieving good classification accuracy and robustness.
Overall, the proposed method strikes a good balance between performance and efficiency. While the training time and the number of parameters are slightly higher than some lightweight models, Proposed Method 1 shows a clear advantage in classification accuracy, adaptability, and robustness. The testing time is comparable to traditional deep learning models, and the method has demonstrated high classification accuracy across multiple datasets, proving its effectiveness in handling complex design element extraction and classification tasks. Although the training time is longer than some models, the combination of deep feature extraction residual networks and spatial pyramid attention mechanisms significantly enhances classification performance, making it more accurate and stable when faced with complex tasks.
According to the results from the ablation experiment in Table 4, it can be observed that the combination of the SPCS Mechanism and the SPCE Mechanism significantly improves the recognition accuracy of product design elements. Specifically, in terms of OA, the model incorporating both mechanisms achieved a high accuracy of 98.36, whereas using either mechanism alone resulted in lower accuracy. This indicates that the introduction of the Spatial Pyramid mechanism effectively enhances the model's ability to capture complex design features, improving overall classification performance. Furthermore, the increase in the Kappa value also reflects a significant improvement in the model's classification consistency, further validating the effectiveness of deep learning technology in the field of image recognition.
To validate whether the performance improvement of the proposed model in design element extraction and classification is statistically significant, we employed a paired t-test to compare the performance of our method with existing methods across multiple evaluation metrics. The t-test results show that the proposed method outperforms existing methods in terms of accuracy (p < 0.05), recall (p < 0.01), and F1 score (p < 0.01), indicating that our approach demonstrates statistically significant improvements in design element recognition performance. Additionally, we performed an ANOVA analysis to further examine the impact of different network architectures on performance. The results of the analysis indicate that using the residual network (ResNet-50) significantly outperforms the traditional CNN architecture across all metrics (F-value = 12.67, p < 0.001).
Table 3. Performance analysis of different methods
|
Dataset |
Time /s |
ResNet |
Mask R-CNN |
Cascade R-CNN |
YOLOv5 |
DETR |
Swin Transformer |
Attention U-Net |
Proposed Method |
|
CAD Design Dataset |
Training |
256.39 |
389.26 |
236.65 |
578.32 |
762.36 |
715.24 |
478.26 |
589.15 |
|
Testing |
22.41 |
27.89 |
22.58 |
47.26 |
77.59 |
57.26 |
31.26 |
51.23 |
|
|
Product Images and Icon Set |
Training |
425.32 |
625.21 |
312.25 |
689.21 |
926.32 |
885.26 |
578.23 |
778.26 |
|
Testing |
38.69 |
53.69 |
34.56 |
67.26 |
101.25 |
78.26 |
42.13 |
72.32 |
|
|
Parameter (×104) |
156.28 |
362.26 |
458.23 |
36.26 |
289.36 |
312.26 |
132.23 |
326.25 |
|
Table 4. Ablation experiment
|
Class |
Module Components |
Dataset |
||
|
SPCS Mechanism |
SPCE Mechanism |
CAD Design Dataset |
Product Images and Icon Set |
|
|
OA |
|
|
88.95 |
92.31 |
|
√ |
|
91.25 |
96.54 |
|
|
|
√ |
94.51 |
96.26 |
|
|
√ |
√ |
98.36 |
98.17 |
|
|
AA |
|
|
91.26 |
93.21 |
|
√ |
|
93.26 |
93.26 |
|
|
|
√ |
93.54 |
95.62 |
|
|
√ |
√ |
98.84 |
98.62 |
|
|
Kappa |
|
|
91.25 |
93.61 |
|
√ |
|
92.36 |
94.51 |
|
|
|
√ |
96.51 |
96.23 |
|
|
√ |
√ |
98.36 |
98.22 |
|
In our experiment, we included a comparison between the proposed deep learning-based image recognition method and traditional image recognition methods in the automatic extraction and classification of product design elements. Extensive evaluations were conducted on several standard datasets, using common performance metrics such as accuracy, recall, F1 score, and area under the curve (AUC). The experimental results demonstrate that the proposed method outperforms existing methods across all evaluation metrics, particularly showing significant improvement in recall and F1 score. In the product design element extraction task, the recall rate increased by approximately 15%, from 0.72 in traditional methods to 0.87, while the F1 score rose from 0.75 to 0.85, showcasing advantages in both the completeness and precision of design element recognition. Additionally, the AUC value also showed outstanding performance, increasing from 0.85 to 0.92, indicating a significant overall improvement in the recognition and classification tasks. Through comparative analysis, it is clear that the proposed method, which combines residual networks for deep feature extraction and the spatial pyramid attention mechanism for classification, significantly enhances the ability to extract and classify design elements. In traditional methods, image recognition is often limited by the diversity and complexity of design elements, leading to the omission or misclassification of certain design features. However, by introducing residual networks and the spatial pyramid attention mechanism, our method more effectively captures multi-scale design features and improves focus on key information through attention mechanisms. This results in significant improvements in recall and F1 score. Specifically, the higher recall rate indicates that our method has a broader coverage in recognizing design elements, enabling a more comprehensive identification of all design features in the image. The increase in F1 score suggests that the model achieves a better balance between precision and recall, thereby enhancing the overall accuracy of design element classification.
The deep learning-based image recognition technology proposed in this paper, combining residual networks and spatial pyramid attention mechanisms, aims to enhance the automatic extraction and classification accuracy of product design elements. The results of this study show that the deep feature extraction of residual networks can effectively capture complex visual features in product designs, while the spatial pyramid attention mechanism further optimizes the classification and localization capabilities of design elements. Experimental results demonstrate that the proposed method outperforms traditional deep learning models, such as ResNet and YOLOv5, in terms of classification accuracy, and shows significant advantages in evaluation metrics such as OA, AA, and Kappa. Particularly in complex product design elements, the model exhibits strong adaptability and robustness.
However, despite the significant accuracy improvements, there are still some limitations. Firstly, while the model achieves high accuracy, it requires longer training and inference times compared to lightweight networks, especially in large-scale datasets, where training and inference efficiency still need to be improved. Secondly, the model's parameter count is relatively large. Although this contributes to better classification accuracy, it may lead to higher computational and storage costs, making it less suitable for resource-constrained applications. Furthermore, this research primarily focuses on the recognition of product design elements, and further exploration is needed for more complex design scenarios, such as real-time detection in dynamic scenes or adapting to various materials and sizes.
Future research directions can focus on the following areas: First, the model structure can be optimized to reduce computational overhead and parameter count, improving its efficiency in practical applications, especially in real-time detection and embedded device applications. Second, integrating multimodal data (such as text, voice, etc.) for multi-task learning could further enhance recognition accuracy and the model's generalization ability. Additionally, considering the diversity of design elements, future work could explore enhancing the model's transfer learning capability, enabling it to be applied effectively in a broader range of domains and use cases. Through these optimizations and expansions, the proposed method is expected to play a larger role in fields such as product design, smart manufacturing, and automated detection.
[1] Xue, L., Yi, X., Zhang, Y. (2020). Research on optimized product image design integrated decision system based on Kansei engineering. Applied Sciences, 10(4): 1198. https://doi.org/10.3390/app10041198
[2] He, J.B., Li, C.Q. (2022). Research on digital image intelligent recognition method for industrial Internet of Things production data acquisition. Traitement du Signal, 39(6): 2133-2139. https://doi.org/10.18280/ts.390626
[3] Mistiawan, A., Suhartono, D. (2024). Product matching with two-branch neural network embedding. Journal Européen des Systèmes Automatisés, 57(4): 1207-1214. https://doi.org/10.18280/jesa.570427
[4] Wang, Y.J. (2023). Electrical control equipment patrol inspection method based on high quality image recognition technology. Traitement du Signal, 40(2): 469-478. https://doi.org/10.18280/ts.400206
[5] Ding, M., Bai, Z., Zhang, J., Huang, X. (2020). Dynamic color design for multimodal industrial products based on genetic algorithm. Journal of Intelligent & Fuzzy Systems, 38(1): 293-302. https://doi.org/10.3233/JIFS-179404
[6] Pettersson, T., Riveiro, M., Löfström, T. (2024). Multimodal fine-grained grocery product recognition using image and OCR text. Machine Vision and Applications, 35(4): 79. https://doi.org/10.1007/s00138-024-01549-9
[7] Gan, B., Zhang, C. (2022). An improved model of product classification feature extraction and recognition based on intelligent image recognition. Computational Intelligence and Neuroscience, 2022(1): 2926669. https://doi.org/10.1155/2022/2926669
[8] Futagami, T., Hayasaka, N. (2020). Automatic product region extraction based on analysis of images uploaded to C2C online market. Journal of Organizational Computing and Electronic Commerce, 30(4): 323-334. https://doi.org/10.1080/10919392.2020.1788359
[9] Umer, S., Mohanta, P.P., Rout, R.K., Pandey, H.M. (2021). Machine learning method for cosmetic product recognition: A visual searching approach. Multimedia Tools and Applications, 80(28-29): 34997-35023. https://doi.org/10.1007/s11042-020-09079-y
[10] Melek, C.G., Sönmez, E.B., Varlı, S. (2024). Datasets and methods of product recognition on grocery shelf images using computer vision and machine learning approaches: An exhaustive literature review. Engineering Applications of Artificial Intelligence, 133: 108452. https://doi.org/10.1016/j.engappai.2024.108452
[11] Li, R., Wang, C. (2022). Cultural and creative product design and image recognition based on deep learning. Computational Intelligence and Neuroscience, 2022(1): 7256584. https://doi.org/10.1155/2022/7256584
[12] Liu, M., Chen, S., Lu, F., Liu, J. (2020). Product dictionary learning-based SAR target configuration recognition. International Journal of Antennas and Propagation, 2020(1): 9704829. https://doi.org/10.1155/2020/9704829
[13] Su, J., Lu, S., Li, L. (2022). A dual quantum image feature extraction method: PSQIFE. IET Image Processing, 16(13): 3529-3543. https://doi.org/10.1049/ipr2.12561
[14] Xu, Z.C., Guo, B.F., Wu, W.H., You, J.Y., Su, X.T. (2024). Multi-scale feature extraction method of hyperspectral image with attention mechanism. Laser & Optoelectronics Progress, 61(4): 0437010. http://doi.org/10.3788/LOP230974
[15] Wang, J.P., Wang, K.Z., Peng, Z.A., Zheng, X.Q. (2019). Wavefront feature extraction for SAR target recognition. The Journal of Engineering, 2019(21): 7498-7501. https://doi.org/10.1049/joe.2019.0626
[16] Zhang, S., Zhang, L., Zhao, T., Selim, M.M. (2020). Fault diagnosis of rotating machinery based on time-frequency image feature extraction. Journal of Intelligent & Fuzzy Systems, 39(4): 5193-5200. https://doi.org/10.3233/JIFS-189004
[17] Tu, H.Y., Wang, W.L., Chen, J.C., Wu, F., Li, G.Q. (2022). Unpaired image-to-image translation with improved two-dimensional feature. Multimedia Tools and Applications, 81(30): 43851-43872. https://doi.org/10.1007/s11042-022-13115-4
[18] Sabry, E.S., Elagooz, S., El-Samie, F.E.A., El-Bahnasawy, N.A., El-Banby, G. (2024). Assessment of various feature extraction methods for object discrimination in different scenarios. Journal of Optics, 53(1): 49-69. https://doi.org/10.1007/s12596-023-01132-x
[19] Tian, L., Song, A., Chen, D.P., Ni, D.J. (2016). Haptic display of image based on multi-feature extraction. International Journal of Pattern Recognition and Artificial Intelligence, 30(8): 1655023. https://doi.org/10.1142/S0218001416550235
[20] Wang, W.N., Mou, X.Q., Liu, X.B. (2020). Modified eigenvector-based feature extraction for hyperspectral image classification using limited samples. Signal, Image and Video Processing, 14(4): 711-717. https://doi.org/10.1007/s11760-019-01604-3
[21] Guan, P., Qiang, J., Liu, W.J., Li, X.X., Wang, D.F. (2021). U-net-based multiscale feature preserving method for low light image enhancement. Journal of Electronic Imaging, 30(5): 053011. https://doi.org/10.1117/1.JEI.30.5.053011
[22] Wang, X.C. (2011). Local extreme extraction of fabric gray feature wave. Key Engineering Materials, 460: 621-624. https://doi.org/10.4028/www.scientific.net/KEM.460-461.621
[23] Zhou, G.Y., Ma, L., Li, Z.G., Zhang, G.P., Kim, C. (2018). A method for extracting gray level image feature based on fuzzy clustering algorithm. Journal of Intelligent & Fuzzy Systems, 35(4): 4385-4397. https://doi.org/10.3233/JIFS-169758
[24] Yin, T., Lv, Z.H. (2022). Optimal extraction method of feature points in key frame image of mobile network animation. Mobile Networks and Applications, 27(6): 2515-2523. https://doi.org/10.1007/s11036-022-02070-x
[25] Liu, J.S. (2013). An informative feature extraction algorithm for kernel machines. Elektronika ir Elektrotechnika, 19(7): 94-97. http://doi.org/10.5755/j01.eee.19.7.5172