Shanshan Gu![]() | Xinlu Sun
| Xinlu Sun![]() | Bin Chen
| Bin Chen![]() | Weijing Tao*
| Weijing Tao*![]()
© 2024 The authors. This article is published by IIETA and is licensed under the CC BY 4.0 license (http://creativecommons.org/licenses/by/4.0/).
OPEN ACCESS
According to authoritative surveys, 24.6% of contemporary college students experience varying degrees of mental health issues, with an annual increase of 1-3%. Severe depression, in particular, can lead to campus crises. Research by experts has demonstrated that micro-expression recognition plays a significant predictive role in depression and holds considerable clinical value. This study first collects multimodal data from conversations between students and psychological counselors using professional equipment, including speech, video, and psychological scale data, to construct a multimodal psychological dataset for college students. The study utilizes a Kinect camera to convert speech into text for analysis and performs micro-expression analysis on video images. Addressing the limitations of traditional expression recognition methods in capturing subtle micro-expressions, this paper proposes a micro-expression recognition model based on a Convolutional Neural Network (CNN)+ Graph Convolutional Network (GCN) transfer learning network. Leveraging the unique advantage of GCNs in automatically updating node information, the model captures the dependencies between image data and corresponding emotional labels in micro-expression sequences. The network model is pre-trained on the CAS(ME)3 dataset to obtain initial parameters, followed by transfer learning to retrain the model for application to the college students' multimodal psychological dataset, ultimately producing representation vectors of micro-expressions. By correlating these representation vectors with various emotional categories, a multimodal knowledge graph based on video, speech, and psychological scale data is constructed. Experimental comparisons demonstrate that the proposed model effectively enhances micro-expression recognition performance and accurately identifies students' depressive states when combined with the multimodal knowledge graph.
multimodal psychological data, multimodal knowledge graph, Convolutional Neural Network (CNN), Graph Convolutional Network (GCN), transfer learning
According to the World Health Organization (WHO), approximately 350 million people worldwide suffer from depression [1], with a growth rate of about 18% over the past decade. Depression has become the second leading cause of death among humans. WHO predicts that by 2030, depression will be the leading cause of global disease burden [2]. Additionally, depression can lead to suicide, with an estimated 800,000 suicides occurring annually worldwide, up to 50% of which occur during depressive episodes. The likelihood of suicide among individuals with depression is nearly 20 times higher than that of the general population. According to authoritative surveys [3], 24% of Chinese college students suffer from depression, with the rate rising to 35% in prestigious universities. These surveys reflect a high prevalence of depressive states among college students, with 41% of those affected having taken a leave of absence due to the illness, and some having committed suicide as a result of depression, which warrants attention. Depression among Chinese individuals tends to manifest physically, with many patients seeking psychiatric help primarily for somatic symptoms rather than psychological discomfort. The somatization reporting rate among Chinese people is much higher than that of Western populations, with more than 70% of patients presenting with somatic symptoms as the primary complaint. This has resulted in a low clinical diagnosis rate for depression in China, meaning the actual number of depression patients in China far exceeds the reported figures.
Early detection of signs of depression is crucial for timely treatment and recovery. Traditional diagnostic methods for depression rely on patient self-reports and psychological assessment scales. However, some patients report somatic symptoms, some choose to hide their emotions (such as patients with smiling depression), and some deliberately skew their answers toward "positive" options when filling out psychological assessment scales, leading to many limitations in traditional diagnostic methods. With the development of emotion recognition technology, collecting multimodal indicators such as physiological and behavioral data, combined with statistical analysis, machine learning, and deep learning techniques, to identify features that differentiate depression patients from healthy individuals has become a research focus for many scholars. Common physiological signals include EEG [4], MRI [5], and neuroimaging [6]; common behavioral signals include eye movement [7], gait [8], speech [9], and facial expressions [10]. Compared to other physiological and behavioral signals, facial expressions have advantages such as being non-intrusive, easy to obtain, and low-cost in the collection process. Facial expressions can be categorized into macro-expressions and micro-expressions. Macro-expressions can be easily identified in daily life, while micro-expressions are fleeting facial expressions that reveal a person’s true feelings and emotions. Studies have shown that micro-expression recognition may have significant predictive value for depression and holds considerable clinical value. Micro-expressions are subtle and short-lived, making it difficult to identify their types with the naked eye, and studies have shown that manual recognition accuracy is only 47%. Currently, deep learning-based micro-expression recognition methods have become a research focus. For example, Islam MD. Islam et al. [1] utilized deep learning’s multi-channel feature fusion and ensemble classification techniques to recognize emotional information in facial micro-expressions, and Durga et al. [2] designed an adaptive Tiefes FCNN model based on deep learning for micro-expression recognition. These studies have demonstrated that deep learning techniques outperform traditional machine learning methods in micro-expression recognition. However, most micro-expression recognition studies are based on facial image features, with room for improvement in accuracy and precision. According to Mehrabian’s rule, emotional communication consists of 55% facial expressions, 38% tone of voice and body movements, and 7% language. Thus, in depression recognition research, combining facial expression and speech data analysis for modeling can provide more emotional information than facial expression analysis alone [11, 12].
This study first analyzes the association between micro-expression facial action units (AUs) and depression, collecting multimodal data from conversations between students and psychological counselors, including speech, video, and psychological scale data, to establish a multimodal psychological dataset for college students. A micro-expression recognition system is then developed based on deep learning techniques, using image frames from videos to identify and judge students' micro-expressions, revealing their psychological changes. Simultaneously, speech is converted into corresponding feature text, and combined with psychological scale data, a multimodal micro-expression knowledge graph is constructed to analyze each feature and generate the final target emotional text, assessing whether there is a risk of depression.
In micro-expression analysis, facial AUs can be seen as an intermediate variable between micro-expressions and the emotions they reflect. Psychological experts often identify the emotion reflected by a micro-expression by analyzing the facial AUs activated within it. The Facial Action Coding System (FACS) defines 44 facial AUs [13] to describe muscle movements in specific facial regions. Different AUs can be freely combined to correspond to various expressions. For example, in Table 1 below, AU14 (tightening the mouth corners) and AU4 (frowning) are the two most common AUs observed on the faces of individuals with depression.
Table 1. Examples of some facial AUs
|
AU |
Description |
Emotion |
Active Muscles |
AU |
Description |
Emotion |
Active Muscles |
|
1
|
Raise inner brow |
Sadness, surprise, fear, interest |
Medial frontalis |
15 |
Downward mouth corners |
Sadness, disgust, confusion |
Depressor anguli oris |
|
2 |
Raise outer brow |
Surprise, fear, interest |
Lateral frontalis |
17 |
Lower lip raise |
Sadness, surprise, fear |
Mentalis |
|
4 |
Frown |
Sadness, fear, anger, confusion |
Corrugator supercilii, depressor glabellae, procerus |
18 |
Pucker lips |
|
Incisivus labii superioris, depressor labii inferioris |
|
5 |
Upper eyelid raise |
Surprise, fear, anger, interest |
Levator palpebrae superioris, tarsal muscle |
20 |
Mouth stretch |
Fear |
Risorius, platysma |
|
6 |
Cheek raise |
Happiness |
Orbicularis oculi |
23
|
Lip tighten |
Anger, confusion, boredom |
Orbicularis oris |
|
7 |
Tighten eyelids |
Confusion, fear, anger |
Orbicularis oculi |
24 |
Lip press |
Boredom |
Orbicularis oris |
|
9 |
Nose wrinkle |
Disgust |
Levator labii superioris |
25 |
Lips part |
|
Depressor labii inferioris, mentalis, orbicularis oris |
|
10 |
Upper lip raise |
|
Levator labii superioris, infraorbital head |
26 |
Jaw drop |
Surprise, fear |
Masseter, temporalis, pterygoid |
|
12 |
Pull mouth corners |
Happiness, contempt |
Zygomaticus |
27 |
Mouth open |
|
Pterygoid, digastric |
|
14 |
Tighten mouth corners |
Contempt or boredom |
Buccinator |
43 |
Close eyes |
Boredom |
Levator palpebrae superioris |
Facial expressions are encoded by abstracting facial movement descriptions into basic facial deformation units. For instance, the "happiness" facial expression can be decomposed into descriptions like "outer tightening of orbicularis oculi; cheek raising...". Different emotions correspond to specific AU combinations in facial expressions. Taking "happiness" as an example, it is essentially a combination of AU6 and AU12. For micro-expressions, if the emotion is happiness, macro-expression happiness is AU6+AU12, while micro-expression happiness may be AU6 or AU12, or AU6+AU12. Micro-expression movements involve localized muscle movements rather than simultaneous movement of multiple muscle groups; for example, in happiness, either AU6 or AU12 is activated. However, if the intensity is high, AU6 and AU12 may occur simultaneously. Additionally, there are connections between macro-expressions and micro-expressions, as micro-expression AUs may be subsets of macro-expression AUs. The characteristics of micro-expressions include a very short duration (0.065-0.5 seconds), small amplitude of movement changes, and difficulty in concealing and suppressing them.
3.1 Pre-training database selection
For micro-expression research, the publicly available micro-expression databases include the CASME database, CASMEII database, SAMM database, CAS(ME)2 database, CAS(ME)3 database, and SMIC database. Among these, the CAS(ME)3 database [14] provides approximately 80 hours of video, including 1,030 manually annotated micro-expressions and 3,364 macro-expressions. Such a large sample size allows for effective validation of intelligent micro-expression analysis methods while avoiding database biases. Additionally, this database is the first to provide depth information as an additional modality and includes over 13,000 seconds of physiological and speech signals, which facilitates multimodal micro-expression analysis. Therefore, this study uses this database to train deep learning neural networks.
In the field of deep learning, transfer learning is an important technique that can help build high-performance neural networks on limited datasets. The core idea of transfer learning is to use a model already trained on the CAS(ME)3 database, apply weight transfer, and then apply it to the collected multimodal psychological dataset of college students, aiming to reduce the need for training data and improve the performance of deep learning models. Transfer learning can be divided into two main stages: pre-training and fine-tuning. In the pre-training stage, a neural network model was trained using the CAS(ME)3 dataset, which is commonly referred to as the pre-trained model. In the fine-tuning stage, the pre-trained model was applied to a new task—college students' depression recognition—and fine-tuned using the data from the new task. Through this method, we can build a high-performance neural network on the CAS(ME)3 dataset and then fine-tune the network parameters using transfer learning techniques for multimodal psychological recognition tests of the students in our school.
3.2 Multimodal psychological data collection of college students
We collected the weekly routine interview video records of 100 freshmen with abnormal results in the school psychological survey during their first semester at the school’s psychological counseling room. The interview environment had normal classroom lighting, with illumination provided by indoor fluorescent lights and natural light from windows. Recording equipment included a high-speed camera and a Microsoft Kinect V2 camera. The high-speed camera was used to capture the students' facial micro-expressions, while the Microsoft Kinect V2 camera collected the speech content and high-definition RGB camera images during the conversations. Each student’s conversation video lasted about 15-30 minutes. During the data collection process, participants sat in a well-lit room, with the camera fixed approximately 0.5 meters in front of them to ensure the entire facial region was captured. The high-speed camera was set to continuously capture facial images at 120 fps, ensuring sufficient lighting and no obstructions in front of the subject during video recording. Before data collection, the research team obtained informed consent from all students, explaining the purpose of the research. To protect participants' privacy, the collected data was anonymized and access was restricted, allowing only research team members involved in the study to handle and analyze the data. Key frames containing micro-expressions were selected from the high-frame-rate image sequences and stored to form a dataset rich in micro-expressions. Ultimately, we collected multimodal data from conversations between students and psychological counselors, including speech data, video data, and psychological scale data, and recorded the final diagnostic results from the psychological counselors for later comparison and validation against the computer recognition results.
In this study, speech is converted into three corresponding feature texts based on speech content, intonation, and speech rate through the following steps:
(1) Conversion of Speech Content
The microphone array of the Kinect camera is located below the Kinect device, consisting of four independent microphones horizontally arranged beneath it. The audio data stream captured by the microphone array is processed by the audio enhancement algorithm of the camera device to remove irrelevant background noise. The camera's online speech recognition function is then used to perform real-time speech recognition on the local device, and the recognized feature text describing the speech content is automatically converted into text by the Kinect.
(2) Conversion of Intonation into Feature Text
The feature text of intonation is obtained through prosody recognition. The main prosodic features used for depression recognition include zero-crossing rate, energy, energy entropy, and spectral centroid. Prosodic features can be calculated using the MATLAB toolbox introduced in the literature [15], and the calculation results are then mapped into corresponding feature texts through a table.
(3) Conversion of Speech Rate into Feature Text
The feature text of speech rate is obtained through spectral calculation; spectral features include spectral entropy and Mel-frequency cepstral coefficients (MFCC). These are converted into corresponding feature texts through a table, with the calculation formula for spectral entropy H as follows:
$H=-\sum\limits_{f=0}^{L-1}{{{n}_{f}}\cdot {{\log }_{2}}({{n}_{f}})}$ (1)
where, L represents the number of subbands in the short-term frame spectrum, and the f-th subband has energy Ef. The calculation formula for the normalized energy nf is as follows:
${{n}_{f}}=\frac{{{E}_{f}}}{\sum\nolimits_{f=0}^{L-1}{{{E}_{f}}}}$ (2)
MFCC is given by Cm, specifically as follows:
${{C}_{m}}=\sum\limits_{k=1}^{L}{(\log {{{\tilde{O}}}_{k}})\cos [m(k-\frac{1}{2})\frac{\pi }{L}]},m=1,...L;$ (3)
where, ${{\tilde{O}}_{k}}$ is the energy output by the k-th filter.
5.1 Image feature extraction using Gabor wavelet transform
We used a high-speed camera to capture real-time images of the face and complete the capture of facial micro-expressions. After filtering, denoising, and grayscale equalization processing of the images, Gabor wavelets were used for feature extraction [16]. Gabor wavelets are sensitive to image edges and provide good directional and scale selection characteristics. They are also insensitive to lighting changes, offering good adaptability to variations in illumination. The two-dimensional Gabor function is similar to enhancing low-level image features such as edges, peaks, valleys, and ridge contours, effectively enhancing information about facial key components such as the eyes, nose, and mouth, making it well-suited for micro-expression feature extraction. As described in Table 1, the identification of micro-expression AUs is mainly concentrated in the cheeks, eyes, eyebrows, nose, and lips regions. Therefore, in expression recognition, we also focus on extracting facial features from these five regions.
The Gabor function is a complex sinusoidal function modulated by a Gaussian function, capable of extracting local frequency domain features within a given region. A typical 2-D Gabor function h(x,y) and its Fourier transform h(u,v) have the following forms:
$\left\{\begin{array}{l}g(x, y)=\frac{1}{2 \pi \sigma_x \sigma_y} \exp \left(-\frac{1}{2}\left(\frac{x^2}{\sigma_x^2}+\frac{y^2}{\sigma_y^2}\right)\right) \\ h(x, y)=g(x, y) \cdot \exp (2 \pi j W x) \\ H(x, y)=\exp \left(-\frac{1}{2}\left(\frac{(u-W)^2}{\sigma_u^2}+\frac{v^2}{\sigma_v^2}\right)\right)\end{array}\right.$ (4)
where, g(x,y) is the Gaussian function used for modulation; σx and σy are the standard deviations on the two coordinate axes, determining the size of the filter's effective area; and W is the frequency of the complex sinusoidal function on the horizontal axis.
The Gabor feature map is obtained by convolving the cropped and preprocessed facial images with the sum function of Gabor wavelets, with the calculation method shown in formula (5).
${{P}_{u,v}}(z)=I(z)*{{G}_{u,v}}(z)$ (5)
In the formula, z=(x,y) represents the coordinates of the pixel points in the image, Pu,v(z) represents the feature image output after the convolution operation, I(z) represents the facial image to be processed, Gu,v(z) represents the two-dimensional Gabor wavelet kernel function, and * denotes the convolution operation.
The expression for the Gabor wavelet kernel function is given by formula (6):
${{G}_{u,v}}(z)=\frac{k_{u,v}^{2}}{{{\sigma }^{2}}}\exp (-\frac{k_{u,v}^{2}}{2{{\sigma }^{2}}})[\exp (i{{k}_{u,v}}z)-\exp (-\frac{{{\sigma }^{2}}}{2})]$ (6)
Its real and imaginary parts are given by formulas (7) and (8):
$\operatorname{Re}({{G}_{u,v}}(z))=\frac{k_{u,v}^{2}}{{{\sigma }^{2}}}\exp (-\frac{k_{u,v}^{2}}{2{{\sigma }^{2}}})[\cos ({{k}_{u,v}}z)-\exp (-\frac{{{\sigma }^{2}}}{2})]$ (7)
$\operatorname{Im}({{G}_{u,v}}(z))=\frac{k_{u,v}^{2}}{{{\sigma }^{2}}}\exp (-\frac{k_{u,v}^{2}}{2{{\sigma }^{2}}})[\sin ({{k}_{u,v}}z)]$ (8)
where, $k_{u, v}=\binom{\kappa_v \cos \varphi_u}{k_v \sin \varphi_u}$ is the center frequency of the filter; $k_v=2^{\frac{v+2}{2} \pi}, \varphi_u=u \frac{\pi}{k} ; u(u=0,1,2, \ldots, 7)$ is the orientation of the Gabor filter; $v(v=0,1,2,3,4)$ is the scale; $k$ is the total number of orientations; $i$ is the negative operator; and $\sigma=2 \pi$. Gabor feature extraction includes the following operations: modulus extraction, feature dimensionality reduction, feature normalization, and feature selection.
(1) Modulus Extraction: Based on the real and imaginary parts returned by formulas (7) and (8), the modulus is used as the image feature.
$\bmod =\sqrt{{{\operatorname{Re}}^{2}}+{{\operatorname{Im}}^{2}}}$ (9)
(2) Feature Dimensionality Reduction: The feature dimensions extracted by Gabor wavelet transform are generally high. As shown in formulas (7) and (8), we use Gabor filters with 8 orientations and 5 scales, resulting in 40 transformed images; this leads to a high feature dimension (concatenation of 40 image features). Therefore, it is necessary to perform feature dimensionality reduction on the modulus images. Here, downsampling is applied to each modulus image using the resize function in OpenCV: cv2.resize(img, (0,0), fx=1/4, fy=1/4).
(3) Feature Normalization:
The purpose of normalization is to constrain the preprocessed feature data within a certain range. In this study, the Z-score standardization method is used, and the normalization formula is as follows:
$x=\frac{x-\mu }{\sigma }$ (10)
where, μ represents the mean of all sample data, and σ represents the standard deviation of all sample data.
(4) Feature Selection:
After the above three steps, the features of each modulus image can be concatenated as the feature vector of the input image. However, the obtained feature vector still contains a large amount of redundancy. Therefore, Principal Component Analysis (PCA) is used for feature dimensionality reduction [17] to alleviate the dimensionality problem, build an effective data model, and reduce the time consumption for recognition, thereby extracting more representative image feature information.
5.2 Micro-expression recognition model based on deep learning
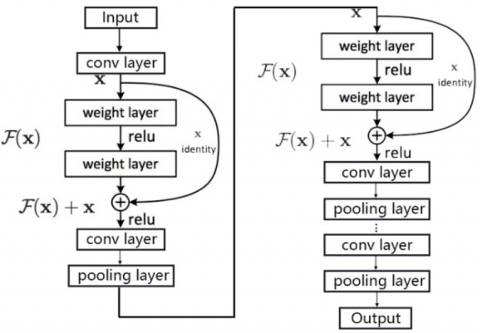
In recent years, CNNs have shown outstanding performance in facial expression recognition tasks. The main advantage of CNNs is that they reduce the number of parameters that need to be trained through parameter sharing and sparse connections, giving them an edge in handling large-scale data. Additionally, their transfer learning capabilities allow model parameters trained in other domains to be transferred to facial expression recognition tasks, thus accelerating the training process and improving model performance. However, since CNNs can only efficiently process regular Euclidean data such as grids and sequences, they cannot effectively handle graph-structured non-Euclidean data like social media networks, chemical structure data, biological protein data, and knowledge graph data. The structure of graphs is typically highly irregular. In micro-expression recognition tasks, CNNs only analyze the key facial AUs in micro-expression image sequences and cannot closely associate facial AU combinations with corresponding emotional labels. GCNs [18], which are the application of CNNs on graph-structured non-Euclidean data, address this limitation. Since the facial texture features extracted from AUs cannot directly reflect emotional categories, they need to be mapped as intermediate features into different category spaces. The AUs from different facial regions are independent yet interconnected; therefore, GCNs can be used to analyze the dynamic connections between different AUs, obtaining deep spatiotemporal features and exploring the dependencies between key facial regions, leading to more accurate micro-expression classification. We divide the Gabor wavelet transform-extracted feature dataset into training, testing, and validation sets and construct a shallow CNN model with convolutional layers, pooling layers, fully connected layers, and dropout layers as the core. Considering that it will later be combined with GCNs to build a deep network model, as the number of layers increases, the training of the network will become increasingly difficult. To address this issue, the shallow CNN is further improved by introducing the concept of residual networks. Suppose that in a single training module, the fused feature input of the original shallow network model is x. After multi-layer complex mapping calculations cascaded by hidden layers in the network, the output is the deep feature H(x) of the micro-expression. Since the complexity of the network model obtained by connecting multiple modules is high and difficult to train, the idea of residual structure is adopted, using shortcut connections to directly input the shallow feature xxx into the output of the training module as the initial residual. The deep feature H(x) in this training module can be expressed as:
$H(x)=F(x)+x$ (11)
If F(x) is close to 0, it constitutes an identity mapping $H(x) \approx x$, which can further simplify the complex model. The deep feature training network is decomposed into multiple shallow multi-scale training modules based on residual structures. The CNN model with added residual modules is shown in Figure 1.
Figure 1. CNN model with residual modules
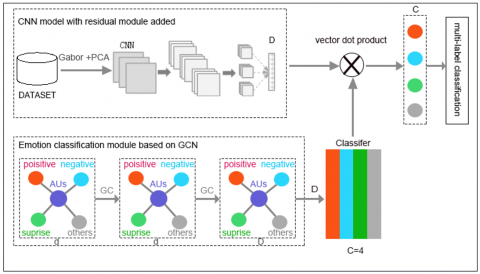
Figure 2. CNN+GCN-based micro-expression recognition network framework
Based on the CNN model, this paper improves and constructs a micro-expression recognition model based on a CNN+GCN transfer learning network. It utilizes the unique advantages of GCN to obtain node attributes and hidden association information between nodes in the emotional label vectors, helping to capture the dependency between image data and corresponding emotional labels in micro-expression sequences. The overall network framework can be divided into two parts: the CNN-based image feature training module and the GCN-based emotion classification module. The schematic diagram is shown in Figure 2. First, the dataset images undergo preprocessing, Gabor wavelet transform, and PCA dimensionality reduction. Then, the feature dimensions of the images are reduced to D through global max-pooling in CNN, and the output C represents the number of emotion categories in the dataset. In the GCN-based emotion classification module, different category label word embedding vectors are obtained according to the combinations of facial AUs in key regions. GC represents performing graph convolution operations on each label vector. The original label word embedding vectors have a dimension of d, which is transformed to dimension D through feature mapping, and this dimension is determined by the image feature representation dimension obtained from CNN.
To save training time, improve the performance of the neural network, and avoid overfitting due to small sample sizes, we will next implement transfer learning of the network model. First, in the structure of Figure 2, the DATASET uses a sufficient sample size from the CAS(ME)3 micro-expression dataset to identify emotion categories and pre-train the model. The image features learned by CNN are max-pooled to obtain new global features x:
$x=G[{{f}_{MP}}({{F}_{CNN}}({{I}_{c}},{{w}_{CNN}}))]$ (12)
where, Ic represents the feature representation of the input image; wCNN represents the weight parameters in the CNN network model; FCNN denotes the iterative operations of the hidden layers in the CNN model; fMP represents the max-pooling function; and G is the global computation function of the pooling features.
By associating different AUs with corresponding emotion categories, GCN is used to train the target classifier, obtaining hidden association information between different category labels. The feature of the preceding layer's nodes in the current network is repeatedly iterated as the input of this layer, updating the node features to realize the strategy modeling of the target classifier on label vectors, thus classifying micro-expression images.
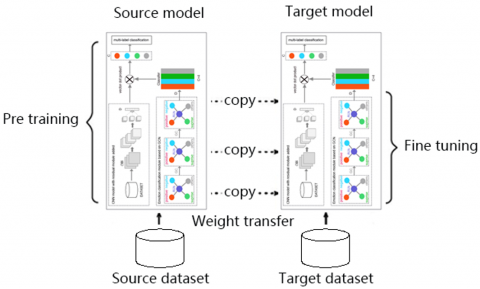
Figure 3. Transfer learning network recognition model
After the pre-training is completed, the "knowledge" (network weights) obtained during the training with the model in Figure 2 is transferred to the target model, and then parameter fine-tuning is performed in the recognition task of the target model. The transfer learning network recognition model is shown in Figure 3.
Emotion recognition based solely on facial expressions has the characteristics of single data source, easy access, and relatively simple feature extraction but also suffers from poor noise resistance and incomplete information. Therefore, effective emotion recognition cannot be achieved using only single-modal information. Multimodal emotion recognition technology, on the other hand, integrates information from multiple complementary and mutually corroborative modalities such as visual, auditory, and natural language text for emotion judgment. It evolves recognition models from single algorithms to combined models, incorporating feature-level, decision-level, or model-level fusion to integrate cross-modal information for comprehensive understanding and judgment of emotions. Thus, multimodal emotion recognition is more accurate, complex, and challenging than single-modal recognition. This study collects multimodal data, including speech data, video image data, and psychological scale data. The speech data includes speech features, the video image data contains micro-expression image features from video sequences, and the psychological scale data includes depression assessment scales such as the Hamilton Depression Scale and the Self-Rating Depression Scale. Using these multimodal data, the corresponding micro-expression multimodal knowledge graph is constructed, extracting entities and relationships between entities from cross-modal data. The graph includes not only textual knowledge but also integrates knowledge and attributes related to images, generating a more enriched graph structure [19]. The basic steps for depression micro-expression recognition in this paper are:
(1) Use a high-speed camera and Microsoft Kinect camera to simultaneously collect speech and video;
(2) Analyze the image frames and speech in the video and convert them into corresponding feature texts. For the collected speech, it is converted into three groups of feature descriptive texts based on content, intonation, and speech rate. For the collected image frames, after capturing facial expressions, feature extraction and dimensionality reduction are performed. The micro-expression recognition model based on the CNN+GCN transfer learning network classifies and converts the extracted features into corresponding expression text descriptions. The main features of micro-expression images include the extracted representation vectors of micro-expressions, which represent the semantic features of micro-expression images or video sequences. According to the correspondence between the representation vectors of micro-expressions and different emotional categories, a micro-expression knowledge graph is constructed. The entity alignment algorithm is adopted, and within the same feature space, semantic constraints are used to align the micro-expression knowledge graph with speech parameters and psychological scale results, constructing a micro-expression multimodal knowledge graph;
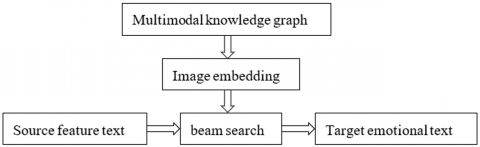
(3) Based on the multimodal knowledge graph, analyze the feature texts and generate the final target emotional text to assess the level of depression and whether it belongs to suicidal emotions. The process is shown in Figure 4.
Figure 4. Target emotion text generation process based on knowledge graphs
We first use the knowledge graph method to output background text for the four groups of feature texts. The knowledge graph is mainly used for storing rich background knowledge, using graph embedding methods to embed it into the knowledge vector space and generating node vectors for each graph node. The source target features are then encoded and converted into vectors, and beam search is used for decoding and generating the target emotion text. The specific method steps are as follows:
a) Select the open-source Chinese Open Knowledge Graph (OpenKG.CN) to construct the required knowledge graph.
b) Encode and convert the four groups of feature texts obtained in step (2) into feature vectors. The knowledge graph is mapped to the same vector space through the node2vec [20] method. For the conversion of speech content text, first collect vocabulary representing positive, negative, and neutral emotions, with 100-200 words for each category. The word vector representations are trained using the Word2Vec [21] model. The average value of the positive word set is taken to obtain the vector p of the positive emotion node. The average value of the negative word set is taken to obtain the vector n of the negative emotion node. The average value of the neutral word set is taken to obtain the vector m of the neutral emotion node. The vectors p, n, and m are each L2 normalized. Finally, the word vectors representing the three types of emotion nodes—positive, negative, and neutral—are obtained and denoted as p, n, and m.
c) Use beam search to decode the feature vectors and obtain the target text. Beam search [22] is a heuristic search technique that combines elements of breadth-first and best-first search, sorting adjacent nodes according to some heuristic algorithm and retaining only the n best values, where n is the size of the beam. In this study, beam search will be used to parallel search the final sequence as a solution to the text decoding problem.
7.1 Deep learning model experimental results
Here, we compare the micro-expression recognition results on the CAS(ME)3 dataset using the original CNN model proposed in Section 5.2, the CNN model based on residual modules (here abbreviated as Res+CNN), and the CNN+GCN network model. The network structure of the CNN+GCN model mainly consists of graph convolution units and a CNN based on residual modules. By cascading the graph convolution units with the residual modules, the CNN based on residual modules captures the intrinsic relationships of micro-expression features, forming new feature vectors. The graph convolution units are used to map the label graph data to the feature learning space of the CNN, capturing hidden associations between micro-expression facial features and corresponding emotional labels. Table 2 shows the main parameter configurations of the three comparison models. In the CNN model and the CNN model based on residual modules, the convolution units consist of 2 convolution layers with an initial number of 32 kernels and a kernel size of 3*3. In the CNN+GCN model, the number of convolution kernels is changed to 64, the initial value of m is set to 1, and for each convolution unit, the value of m is multiplied by 2, doubling the number of convolution kernels. During training, the Adam optimizer is used to automatically adjust the learning rates of various parameters, with the batch size set to 64; initial learning rate set to 0.001; learning decay rate set to le-5; momentum set to 0.9; and iterative cycle set to 100. Adaptive supervision is used to adjust the learning rate. Each convolution layer adds BN regularization, and the EarlyStopping callback function is used to interrupt training when the model performance no longer improves, alleviating overfitting and enhancing the model's generalization ability. Figure 5 shows the recognition accuracy comparisons of the three different models on the CAS(ME)3 dataset.
Table 2. Main parameter configurations of different network models
|
Model Structure |
Convolution Unit |
Pooling Layer |
Fully Connected Layer |
Activation Function |
Dropout Rate |
|
CNN |
[3*3*32m]*2 |
Max Pooling |
257 -1 424 |
ReLU |
0.5 |
|
Res+CNN |
[3*3*32m]*2 |
Max Pooling |
128 -256 -1 424 |
ReLU |
0.5 |
|
CNN+GCN |
[3*3*64m]*2 |
Average Pooling |
257 -1 424 |
ReLU |
0.5 |
(a) Original CNN model accuracy
(b) Res+CNN model accuracy
(c) CNN+GCN model accuracy
Figure 5. Recognition accuracy comparison of three different models on the CAS(ME)3 dataset
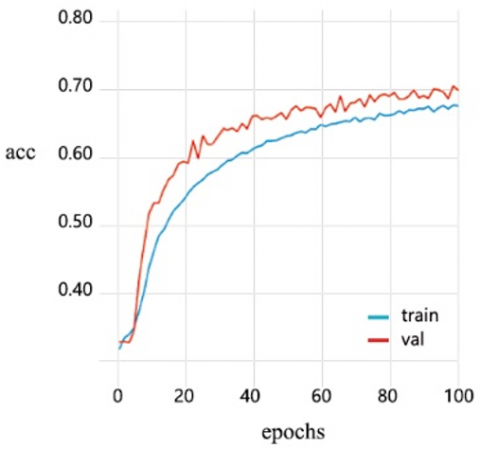
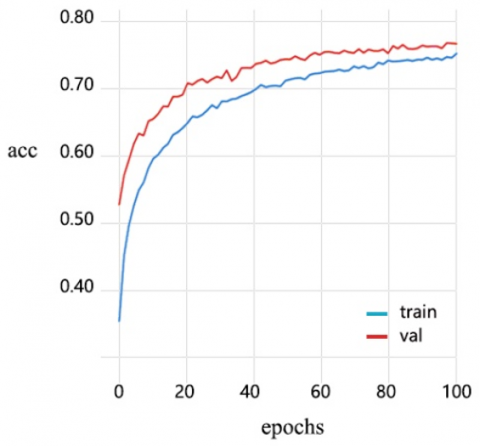
Figure 6. Accuracy curve of CNN+GCN transfer learning network micro-expression recognition model
To address the problem of potential model overfitting due to insufficient student micro-expression data samples collected in this study, we use the CAS(ME)3 dataset micro-expression recognition model based on the CNN+GCN network. The feature images obtained from the CAS(ME)3 dataset are used as the training and test sets, expanding the sets in a 4:1 ratio, and pre-training is conducted on the student micro-expression dataset collected in this study. The weight-based transfer learning network recognition model from Figure 3 is used to recognize micro-expressions, and the results are shown in Figure 6.
Figure 6 shows that the CNN+GCN model achieves a maximum recognition rate of 71.46% for micro-expression features on the CAS(ME)3 dataset. The weight-based transfer learning network recognition model alleviates the impact of the small number of student micro-expression sample sequences on network training. During the continuous training and optimization process of the network, the model achieves a maximum recognition rate of 77.14%.
7.2 Comparison of single-modality and multi-modality evaluation results
Here, we compare the recognition results of three single modalities: micro-expression recognition based on speech data, emotion recognition based on scale detection, and micro-expression recognition based on video images, with the recognition results of the multimodal fusion model based on "speech + psychological scale + video image" proposed in this paper for depression. The experimental evaluation indicators use the average accuracy of four emotions, and the results are shown in Table 3. As shown in Table 3, the proposed multimodal fusion model achieves higher accuracy than the three single-modal models, with an average accuracy of 80.13%.
Table 3. Performance comparison of multimodal fusion model and single-modal models
|
Model Type Emotion Type |
Speech |
Psychological Scale |
Video Image |
Multimodal Fusion |
|
Positive |
0.573 |
0.585 |
0.754 |
0.804 |
|
Negative |
0.561 |
0.624 |
0.753 |
0.795 |
|
Surprise |
0.542 |
0.546 |
0.718 |
0.788 |
|
Others |
0.675 |
0.687 |
0.783 |
0.818 |
This paper primarily focuses on facial video image expression recognition and multimodal emotion recognition. It emphasizes the research on the feature extraction algorithms and deep learning networks used in facial video image expression recognition. The proposed Gabor wavelet + PCA feature dimensionality reduction algorithm optimizes feature selection. In terms of network training, a micro-expression recognition model based on a CNN+GCN transfer learning network was constructed, utilizing the unique advantage of GCN in automatically updating node information to capture the dependencies between image data and corresponding emotion labels in micro-expression sequences. The built network model was pre-trained on the CAS(ME)3 dataset. The large sample size of CAS(ME)3 helps mitigate model overfitting and provides initial network parameters to aid in the micro-expression recognition of the multimodal psychological data collected from college students in this study. Through multiple experimental comparisons, it was found that the constructed model improves the accuracy of micro-expression recognition. In terms of multimodal information fusion, multimodal knowledge graph technology was introduced. The final experimental results show that, compared to single-modal emotion recognition, the multimodal emotion recognition method that integrates three types of information demonstrates superior recognition performance, and the recognition accuracy obtained by the proposed fusion method is higher.
Innovations of this paper include: using Kinect for speech data collection and speech content conversion, which is characterized by high performance and ease of operation. Aligning multimodal data with the text layer, that is, describing physical characteristics with text, allows for a comprehensive and objective expression of emotions. The use of knowledge graph-based methods for emotion recognition fully utilizes rich background knowledge information, improving recognition accuracy.
Although the research in this paper has achieved certain results, there is still a gap between the system algorithm and practical application. Future research work will proceed in the following directions:
(1) Integrating more modalities of information. Emotion itself is a highly complex psychological and physiological phenomenon, with emotional states manifested in speech, facial expressions, spoken content, body posture, and various bioelectrical signals. In different application scenarios, integrating this information can lead to more accurate multimodal emotion recognition research.
(2) Research on expression recognition in image sequences. The expression of emotions is, in many cases, a dynamic and continuous process, whereas most current emotion recognition studies based on facial expressions still focus on static images. To improve the accuracy of emotion recognition systems, it is necessary to introduce temporal information into facial expression emotion recognition. The recognition of expressions in image sequences is a very important research direction.
This work is supported by the second batch of teaching reform projects for vocational education in Zhejiang Province during the 14th Five Year Plan period "Research on Personalized Mental Health Education and Crisis Intervention Model for Vocational College Students Based on Generative AI" (Grant No.: jg20240135).
[1] Islam, M.S., Sang, Y.S., Mohammed, A.A., Yuan, L., Lv, J.C. (2023). Highly effective end-to-end single-to-multichannel feature fusion and ensemble classification to decode emotional secretes from small-scale spontaneous facial micro-expressions. Journal of King Saud University-Computer and Information Sciences, 35(8): 101653. https://doi.org/10.1016/j.jksuci.2023.101653
[2] Durga, B.K., Rajesh, V., Jagannadham, S., Kumar, P.S., Rashed, A.N.Z., Saikumar, K. (2023). Deep learning-based micro facial expression recognition using an adaptive tiefes FCNN model. Traitement du Signal, 40(3): 1035-1043. https://doi.org/10.18280/ts.400319
[3] Banerjee, R., De, S., Dey, S. (2022). WTAOF-ILPB based feature learning and LFSSOA-RBFNN based classification for facial micro-expression recognition. Wireless Personal Communications, 127(3): 2285-2304. https://doi.org/10.1007/S11277-021-08794-5
[4] Li, Y.L., Fang, Y.X., Ren, X.X., Gao, L.T. (2024). EEG-based depression recognition using feature selection method with fuzzy label. Journal of King Saud University-Computer and Information Sciences, 36(3): 102004. https://doi.org/10.1016/J.JKSUCI.2024.102004
[5] Delgado-García, G., Engbers, J.D., Wiebe, S., Mouches, P., Amador, K., Forkert, N.D., Calgary Comprehensive Epilepsy Program Collaborators. (2023). Machine learning using multimodal clinical, electroencephalographic, and magnetic resonance imaging data can predict incident depression in adults with epilepsy: A pilot study. Epilepsia, 64(10): 2781-2791. https://doi.org/10.1111/EPI.17710
[6] Lee, M. (2024). The protective role of positive body image on the associations between body objectification, disordered eating symptoms, and depression among Korean women. Eating Disorders, 1-19. https://doi.org/10.1080/10640266.2024.2353414
[7] Zheng, Z., Liang, L., Luo, X., Chen, J., Lin, M., Wang, G., Xue, C. (2024). Diagnosing and tracking depression based on eye movement in response to virtual reality. Frontiers in Psychiatry, 15: 1280935. https://doi.org/10.3389/FPSYT.2024.1280935
[8] Nazari, T., Moodi, M., Fakhrzadeh, H., Khodabakhshi, H., Khorashadizadeh, M., Arzaghi, S.M., Sharifi, F. (2024). The association of depressive symptoms with handgrip strength and gait speed in community-dwelling older adults: Data from the baseline phase of Birjand Longitudinal Aging Study. BMC Geriatrics, 24(1): 393. https://doi.org/10.1186/S12877-024-04944-Z
[9] Bryson, A., Charlwood, A., Forth, J. (2006). Worker voice, managerial response and labour productivity: An empirical investigation. Industrial Relations Journal, 37(5): 438-455. https://doi.org/10.1111/j.1468-2338.2006.00414.x
[10] Turcian, D., Stoicu-Tivadar, V. (2023). Real-time detection of emotions based on facial expression for mental health. In EFMI-STC, pp. 272-276. https://doi.org/10.3233/SHTI230795
[11] Lin, Y.T., Huang, J., Sun, D.C. (2023). A novel recurrent convolutional network based on grid correlation modeling for crowd flow prediction. Journal of King Saud University-Computer and Information Sciences, 35(8): 101699. https://doi.org/10.1016/j.jksuci.2023.101699
[12] Bowers, D., Miller, K., Bosch, W., Gokcay, D., Pedraza, O., Springer, U., Okun, M. (2006). Faces of emotion in parkinsons disease: Micro-expressivity and bradykinesia during voluntary facial expressions. Journal of the International Neuropsychological Society, 12(6): 765-773. https://doi.org/10.1017/S135561770606111X
[13] Chauhan, A., Jain, S. (2024). FMeAR: FACS driven ensemble model for micro-expression action unit recognition. SN Computer Science, 5(5): 598. https://doi.org/10.1007/S42979-024-02948-5
[14] Li, J.T., Dong, Z.Z., Lu, S.Y., Wang, S.J., Yan, W.J., Ma, Y.H., Liu, Y., Huang, C.B., Fu, X.L. (2022). CAS(ME)3: A third generation facial spontaneous micro-expression database with depth information and high ecological validity. IEEE Transactions on Pattern Analysis and Machine Intelligence, 45(3): 2782-2800. https://doi.org/10.1109/TPAMI.2022.3174895
[15] Giannakopoulos, T., Pikrakis, A. (2014). Introduction to Audio Analysis: A MATLAB® Approach. Academic Press.
[16] Ullah, R., Hayat, H., Siddiqui, A.A., Siddiqui, U.A., Khan, J., Ullah, F., Karami, G.M. (2022). A real-time framework for human face detection and recognition in CCTV images. Mathematical Problems in Engineering, 2022(1): 3276704. https://doi.org/10.1155/2022/3276704
[17] Fariz, T.N., Basha, S.S. (2024). Enhancing solar radiation predictions through COA optimized neural networks and PCA dimensionality reduction. Energy Reports, 12: 341-359. https://doi.org/10.1016/J.EGYR.2024.06.025
[18] Chun, S., Jang, S., Kim, J.Y., Ko, C., Lee, J., Hong, J., Park, Y.R. (2024). Comprehensive assessment and early prediction of gross motor performance in toddlers with graph convolutional networks-based deep learning: Development and validation study. JMIR Formative Research, 8: e51996. https://doi.org/10.2196/51996
[19] Chen, Y., Ge, X., Yang, S., Hu, L., Li, J., Zhang, J. (2023). A survey on multimodal knowledge graphs: Construction, completion and applications. Mathematics, 11(8): 1815. https://doi.org/10.3390/MATH11081815
[20] Kumar, A., Jain, D.K., Mallik, A., Kumar, S. (2024). Modified node2vec and attention based fusion framework for next POI recommendation. Information Fusion, 101: 101998. https://doi.org/10.1016/J.INFFUS.2023.101998
[21] Ning, H., Chen, Z.Y. (2023). Fusion of the word2vec word embedding model and cluster analysis for the communication of music intangible cultural heritage. Scientific Reports, 13(1): 22717. https://doi.org/10.1038/S41598-023-49619-8
[22] Shetty, A., Kale, Y., Patil, Y., Patil, R., Sharma, S. (2024). Optimal transformers based image captioning using beam search. Multimedia Tools and Applications, 83(16): 47963-47977. https://doi.org/10.1007/S11042-023-17359-6