Ruixue Zhang![]()
© 2024 The author. This article is published by IIETA and is licensed under the CC BY 4.0 license (http://creativecommons.org/licenses/by/4.0/).
OPEN ACCESS
With the rapid growth of e-commerce, online shopping has become an indispensable part of daily life. Product images serve as a crucial medium for consumers to understand the products, and their quality directly influences purchasing decisions. However, due to limitations in photography equipment, techniques, and image processing methods, a wide range of image quality exists across e-commerce platforms. High-quality product images not only accurately convey product information but also enhance consumer shopping experience and trust. Therefore, researching methods for assessing and optimizing e-commerce product image quality is of significant practical importance. Existing image quality assessment and optimization methods often suffer from subjectivity, inadequate detail enhancement, and inability to address multiple types of distortion simultaneously. This paper focuses on two main areas: (1) a quality assessment model for e-commerce product images based on content and distortion retrieval, and (2) an image enhancement network utilizing the Laplacian operator and wavelet transform. Through this research, the paper aims to develop an efficient and accurate system for assessing and optimizing product image quality, providing e-commerce platforms with effective image quality management solutions and offering new technical insights for the field of image processing.
e-commerce, product images, quality assessment, image optimization, deep learning, Laplacian operator, wavelet transform
With the rapid development of e-commerce, online shopping has become an indispensable part of daily life [1-4]. As an important way for consumers to understand products, the quality of product images directly influences users' purchasing decisions [5, 6]. However, due to the limitations of photography equipment, photography techniques, and image processing methods, a large number of product images with varying quality exist on e-commerce platforms [7-9]. How to effectively assess and optimize the quality of these images has become a key issue in improving the shopping experience of users and the sales performance of merchants.
High-quality product images can not only accurately convey product information but also enhance consumers' shopping experience and trust. Therefore, researching methods for assessing and optimizing the quality of e-commerce product images has significant practical importance [10]. It not only helps to improve consumer satisfaction but also reduces return rates and complaints, thus enhancing the overall service level of e-commerce platforms [11-14]. At the same time, for merchants, optimized high-quality product images can increase the attractiveness of products, thereby improving the conversion rate of sales.
Although existing research has made some progress in image quality assessment and optimization, there are still some deficiencies. Traditional image quality assessment methods often rely on manual scoring, which is time-consuming and highly subjective, making it difficult to meet the needs of large-scale e-commerce platforms [15, 16]. Existing image optimization methods mostly focus on global enhancement of images, neglecting the improvement of details and local features [17-22]. In addition, many methods perform poorly when dealing with different types of distorted images, and are unable to meet the optimization needs of images with multiple types of distortions.
This paper includes two parts: one is an e-commerce product image quality assessment model based on content and distortion retrieval, and the other is an e-commerce product image enhancement network based on the Laplacian operator and wavelet transform. Through the study of these two parts, this paper aims to construct an efficient and accurate product image quality assessment and optimization system. First, this paper proposes a product image quality assessment model based on content and distortion retrieval, which can automatically identify quality issues in images and classify and evaluate different types of distorted images. Second, this paper designs an image enhancement network based on the Laplacian operator and wavelet transform, which can effectively improve the overall quality of images while preserving image details. Through these two aspects of research, this paper not only provides an efficient image quality management solution for e-commerce platforms but also offers new technical ideas for the field of image processing, with significant theoretical and practical value.
Product images on e-commerce platforms play a key role in attracting consumers and conveying product information, so the quality of the images directly influences consumers' purchasing decisions. However, due to the wide variety of products on e-commerce platforms, the diversity of photography equipment and techniques, and the differences in the image processing skills of uploaders, the quality of product images on e-commerce platforms is uneven. Therefore, accurately assessing the quality of these product images to better enhance the shopping experience of consumers and the overall service level of the platform has become a research topic of significant importance.
Traditional image quality assessment methods typically rely on regression models, which are limited by the representativeness of the training set samples and frequency sensitivity. Since small-scale image quality assessment databases tend to produce biased training samples, which affect the model's ability to accurately model the true distribution of image quality, regression-based models often tend to assign higher weights to frequently occurring samples. This bias can lead to prediction errors when the model handles images of different types and quality, especially in the context of diversified e-commerce product images, where the regression model may lose accuracy for specific categories or qualities of images. To address these issues, this paper proposes an e-commerce product image quality assessment model based on content and distortion retrieval. The core idea of the proposed model is to assess image quality through similarity retrieval in the feature space, rather than solely relying on the parameters of a regression model. The advantage of this approach is that it can identify instances in the feature space that are similar to the image being evaluated, thereby more accurately reflecting the actual quality of the image.
The proposed model identifies image instances similar to the image being evaluated through two key classification modules: a semantic classification module and a distortion classification module, and assesses image quality based on these similar instances. Given a test image, the semantic classification module retrieves the original images with similar content from the image quality assessment database. The purpose of this step is to find samples that are similar in content to the image being evaluated but do not include its corresponding original image, in order to avoid bias in the assessment process. The distortion classification module queries instances with distortion characteristics similar to the input image from the distorted images corresponding to each retrieved original image. Through repeated retrieval by the above two modules, the model can obtain multiple image instances that are similar to the test image in terms of content and distortion characteristics. Finally, the model calculates the final predicted image quality score by integrating the subjective quality scores of these similar instances. Figure 1 shows the proposed e-commerce product image quality assessment process.
Figure 1. The proposed e-commerce product image quality assessment process
Specifically, the first step is to establish an image quality assessment database. This database is randomly divided into a training set and a test set based on an 80% to 20% ratio. The training set contains O original images, denoted as T={(Ao,Fo,Lo)|1≤o≤O}. Here, Ao represents the o-th original product image, which is a high-quality product display image collected from e-commerce platforms, representing the product's display effect under ideal conditions. Fo={auo|1≤m≤M} denotes the set of distorted product images corresponding to Ao, containing mmm distorted image samples, where each distorted image amo (1≤l≤m) represents a product image under different distortion conditions. These distorted images simulate the quality issues that may occur during actual shooting and uploading processes. Lo corresponds to the subjective quality scores MOS (Mean Opinion Score) of these distorted images. These scores are provided by human evaluators based on the visual quality of the distorted images, reflecting the subjective quality perception of each distorted image.
2.1 Semantic classification module
Since the number of original images in the image quality assessment database is limited, relying solely on finding images of the same category may not effectively measure the content similarity between images. To address this issue, this paper employs the VGG-16 network pre-trained on ImageNet as the semantic classification module. The network removes the final classification layer to extract the semantic vectors of images. In this way, the high-dimensional semantic feature vector of each image can be obtained, accurately capturing the content information of the image. Specifically, given a test image as and an original image Ao, their content similarity is measured as the semantic-aware distance Ψt(as,ao). This distance is defined as the cosine distance between their semantic feature vectors. Assuming that the semantic vectors of as and ao are represented by ns and no, respectively, and the transpose is represented by S, the calculation formula is as follows:
${{\Psi }_{t}}\left( {{a}_{s}},{{A}_{o}} \right)=COS\left( {{n}_{s}},{{n}_{o}} \right)=\frac{{{n}_{s}}\cdot n_{o}^{S}}{\left| {{n}_{s}} \right|\cdot \left| {{n}_{o}} \right|}$ (1)
Assuming the function argmaxj sorts the semantic-aware distance in descending order and selects the top J images, the most similar J original images to as can be retrieved based on the following formula:
$\left[ {{{\hat{J}}}_{o}} \right]_{o=1}^{J}=\underset{{{A}_{o}}\in T}{\mathop{\arg {{\max }_{j}}}}\,{{\Psi }_{t}}\left( {{a}_{s}},{{A}_{o}} \right)$ (2)
2.2 Distortion classification module
On e-commerce platforms, the quality assessment of product images needs to consider not only the content similarity of the images but also their distortion characteristics. In this paper, a distortion classification module is set up in the quality assessment model to evaluate and quantify the distortion characteristics of images. This module is implemented by training a distortion classification model on the image quality assessment data. Given a training set containing V samples, denoted as {(av,bv)|1≤v≤V}, where av and bv represent the v-th input image and the one-hot vector of the actual distortion category, respectively. The training objective is to minimize the cross-entropy loss function by optimizing the model parameters ϕ, thereby enabling the model to accurately classify different types of image distortions. Assuming the number of distortion categories is denoted by Z, the predicted probability of the v-th image belonging to category z is denoted by $\hat{b}_z^v$, and the value of parameter ϕ that minimizes the function is represented by argminϕ, the real probability of the v-th image belonging to category Z is denoted by bvz, then the calculation formula is:
$\hat{\varphi }=\underset{\varphi }{\mathop{\text{argmin}}}\,-\sum\limits_{v=1}^{V}{\sum\limits_{z=1}^{Z}{b_{z}^{v}\text{log}\hat{b}_{z}^{v}\left( {{a}^{v}};\varphi \right)}}$ (3)
In practical applications, given a test image as, we need to measure its distortion similarity with the candidate distorted image a1o. This is achieved by calculating the cosine distance between their distortion feature vectors, referred to as the distortion-aware distance Ψf(as, a1o). Assuming the distortion feature vectors of as and a1o are represented by qs and q1o, respectively, the specific formula is as follows:
${{\Psi }_{f}}\left( {{a}_{s}},a_{o}^{m} \right)=COS\left( {{q}_{s}},q_{o}^{m} \right)$ (4)
In the entire assessment process, the semantic classification module first retrieves the undistorted original images $\hat{A}_o$ that are content-similar to the image to be evaluated from the database. Next, from the distorted image set Fo associated with $\hat{A}_o$, the distortion classification module further retrieves the distorted image $\hat{a}^1{ }_o$ with the highest distortion similarity to the test image as. In this way, the model can find image instances most similar to the test image in terms of distortion characteristics.
$\hat{A}_{o}^{m}=\underset{a_{o}^{m}\in {{F}_{o}}}{\mathop{\text{argmax}}}\,{{\Psi }_{f}}\left( {{a}_{s}},a_{o}^{m} \right)$ (5)
To improve the accuracy of product image quality assessment, the model mitigates prediction bias by aggregating the subjective quality scores (MOS) of multiple retrieved instances, as a single instance may not adequately represent the test image in all cases. Specifically, this paper proposes two optional quality aggregation strategies to evaluate the image quality score: simple averaging and semantic-aware distance weighted averaging. Among them, the simple averaging strategy is the most basic aggregation method. Given the test image as and the J retrieved original image instances, suppose the MOS value of the image $\hat{a}^1{ }_0$ is denoted by $L_o\left[\hat{a}^l{ }_o\right]$. The predicted quality score of as can be expressed as:
${{w}_{SI}}=\frac{1}{j}\sum\limits_{o=1}^{j}{{{L}_{o}}\left[ \hat{a}_{o}^{m} \right]}$ (6)
The weighted averaging method considers the relative influence of each instance on the final quality prediction. Since images with higher semantic similarity often exhibit similar perceived quality under similar distortions, the semantic-aware distance Ψt(as,Ao) is used as a weighting factor, giving greater influence to instances with higher semantic similarity on the final prediction. Therefore, the semantic-aware distance Ωs(xt,Xp)Ψt(as,Ao) is used as a weighting factor. The predicted quality score of the test image can be expressed as:
${{w}_{WE}}=\sum\limits_{o=1}^{J}{\frac{{{\Psi }_{t}}\left( {{a}_{s}},{{A}_{o}} \right)}{\sum\limits_{o}{{{\Psi }_{t}}\left( {{a}_{s}},{{A}_{o}} \right)}}}{{L}_{o}}\left[ \hat{a}_{o}^{m} \right]$ (7)
High-quality product images play a crucial role in attracting consumers and increasing sales on e-commerce platforms. However, due to factors such as shooting equipment and ambient lighting, e-commerce product images often suffer from issues such as blurring, noise, and color cast, which urgently need to be optimized through image enhancement techniques. This paper proposes a new e-commerce product image enhancement network, aiming to combine the advantages of traditional image processing methods and modern neural networks to provide an efficient image enhancement solution.
The Laplacian operator and wavelet transform are two traditional image processing methods that enhance images by processing their frequency domain features. These two methods have unique advantages in the frequency domain: the Laplacian operator is mainly used for edge detection and detail enhancement, while the wavelet transform excels in multi-scale analysis and noise suppression. However, directly using these methods can easily lead to over-enhancement of images, resulting in degradation problems such as artifacts and distortion. Therefore, this paper embeds these two methods into the generator of the Generative Adversarial Network (GAN) and proposes a product image enhancement network based on the Laplacian operator and wavelet transform.
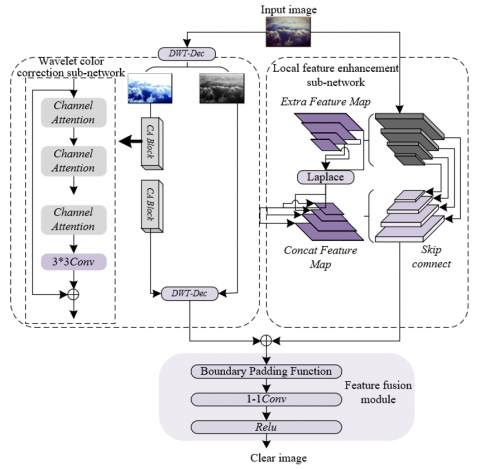
Figure 2. The overall framework of the e-commerce product image enhancement network
Figure 2 shows the overall framework of the e-commerce product image enhancement network. The proposed network model is a dual-branch network, including a local feature enhancement sub-network and a wavelet color correction sub-network. The local feature enhancement sub-network adopts an encoder-decoder structure, where both the encoder and decoder are composed of Res2Net modules. Res2Net has a strong capability to accurately extract multi-scale features, enabling better integration of features at various scales during the encoding stage with those in the decoding stage, while also speeding up network convergence. The main purpose of the wavelet color correction sub-network is to correct color cast issues in images by utilizing the low-frequency color information separated by the wavelet transform. Finally, the outputs of the local feature enhancement sub-network and the wavelet color correction sub-network are fused to combine the advantages of both, generating clear and realistic product images.
3.1 Local feature enhancement sub-network
The local feature enhancement sub-network in the model adopts an encoder-decoder structure, utilizing the Laplacian operator to retain and enhance the local detail features of the image. In the encoder stage, the feature maps du(a) after each convolutional layer undergo processing by the Laplacian operator, resulting in detail-enhanced image features. The Laplacian operator processes the features output by the i-th convolutional layer of the encoder through its differential operation, enhancing regions of abrupt changes in the image information and reducing the speed of these changes, generating sharpened feature maps $\hat{d}_u(a)$. This process effectively preserves the edges and texture details of the image, avoiding detail loss caused by convolution and deconvolution operations. Assuming that the e-commerce product image to be enhanced is represented by a, the value of the feature map after the u-th convolutional layer is represented by du(a), the sharpened feature is represented by $\hat{d}_u(a)$, and the center coefficient of the Laplacian filter is represented by z, the processing is as follows.
${{\hat{d}}_{u}}\left( a \right)={{d}_{u}}\left( a \right)+z\left[ {{\nabla }^{2}}{{d}_{u}}\left( a \right) \right]$ (8)
In the decoder stage, deconvolution operations may cause abrupt changes in image features and edge blurring. To solve this problem, the local feature enhancement sub-network introduces channel attention and spatial attention mechanisms. These attention mechanisms help the network focus better on the regions with higher weights in the sharpened feature map $\hat{d}_u(a)$ during the training process. Finally, the attention features are concatenated with the sharpened feature maps. This operation not only preserves the background information of the image features but also highlights the smaller detail features in the image, making the product image display effect clearer and more realistic.
3.2 Wavelet color correction sub-network
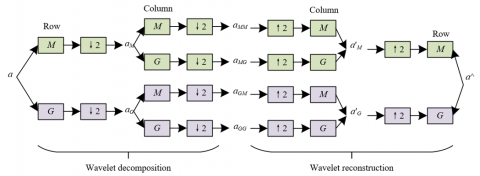
On e-commerce platforms, the color accuracy and visual effect of product images are crucial for attracting consumers. However, due to the limitations of the shooting environment and equipment, product images often exhibit color cast issues, affecting the product display effect. The wavelet color correction sub-network in the model corrects the color cast issue in product images by processing low-frequency information. First, the product image x is subjected to wavelet decomposition to obtain low-frequency information aM and high-frequency information aG. Among them, low-frequency information aM is related to the overall color of the image, while high-frequency information aG is related to the details and edge features of the image. Wavelet decomposition separates aM and aG by performing horizontal filtering and downsampling on each row of the image using a one-dimensional filter, and then uses vertical filtering and downsampling to further calculate four sub-images: aMM, aMG, aGM, and aGG. Among them, aMM represents the low-frequency image, while aMG, aGM, and aGG correspond to the high-frequency images of the original image’s horizontal, vertical, and diagonal edges, respectively. Figure 3 shows the working principle of the wavelet color correction sub-network.
Figure 3. The working principle of the wavelet color correction sub-network
To correct the color cast issue in product images, the low-frequency information xL is input into the residual attention group for enhancement. The residual attention group consists of multiple channel attention modules, which enhance significant color features in the low-frequency information by reducing the impact of gradient vanishing through residual and skip connections. Specifically, the residual attention group extracts and strengthens color-related features through the channel attention mechanism, allowing the model to better fit and adapt to the current data, thereby enhancing the color features in the low-frequency information aM and generating enhanced low-frequency information a′M. Next, the enhanced low-frequency information a′M is reconstructed with the high-frequency information aG to restore the details and edge information of the product image. Wavelet reconstruction uses the same filters as wavelet decomposition, performing upsampling on each column of the four sub-images aMM, aMG, aGM, and aGG to obtain the new a′M and a′G. Finally, the enhanced product image $\hat{a}$ is generated by combining and reconstructing a′M and a′G through filtering and upsampling operations.
3.3 Feature fusion module
The feature fusion module in the model aims to fuse and restore the edge detail features and color features obtained from the previous two modules. The design goal of this module is to improve the overall quality of the image, avoid the over-enhancement problems that traditional methods may bring, and enhance the generalization ability of the neural network. This module consists of a 1×1 convolutional layer and a boundary padding function. The 1×1 convolutional layer plays a key role in feature fusion, with the purpose of fusing and compressing the features from the local feature enhancement sub-network and the wavelet color correction sub-network, reducing the number of channels in the feature map, while retaining important edge details and color information. To prevent the loss of clear image features after restoration, the module introduces a boundary padding function to ensure the integrity of the image. The fused feature map obtained through the feature fusion module contains edge details from the local feature enhancement sub-network and color information from the wavelet color correction sub-network. After being processed by the ReLU activation function, the fused feature map generates the final “restored” product image. This image not only has clear edge details but also possesses true and rich colors, significantly enhancing the visual quality of the product image.
The constructed network model uses multiple loss functions during the training process to ensure that the generated product images meet high-quality standards. These loss functions include the L1 loss function, multi-scale structure loss function, perceptual loss function, and adversarial loss function. The total loss function is the weighted sum of the aforementioned four loss functions:
$\begin{align} & LOS{{S}_{ALL}}=x*LOS{{S}_{{{m}_{1}}}}+y*LOS{{S}_{M-S}} \\ & \text{ }+z*LOS{{S}_{GZ}}+f*LOS{{S}_{AD}} \\\end{align}$ (9)
The L1 loss function is used to measure the difference between the real product image and the restored product image. This loss function ensures that the restored image is as close as possible to the real image by calculating the absolute error between the two. The L1 loss function is capable of recovering the details of the product image well and has low computational complexity, making it suitable for large-scale product image enhancement tasks. Suppose the grayscale values at pixel u of the sharp image and the restored product image are represented by bu and dϕ(au), respectively. The parallel dual-branch network with parameter ϕ is denoted by dϕ(·), the underwater blurry image is denoted by a, and the total number of pixels is denoted by V. The calculation formula is as follows:
$LOS{{S}_{{{L}_{1}}}}=\sum\nolimits_{u=1}^{V}{\left( {{b}_{u}}-{{d}_{\varphi }}\left( {{a}_{u}} \right) \right)}$ (10)
The multi-scale structure loss function is used to improve the clarity of the product image. This loss function considers the structural similarity at different scales to ensure that the generated product image remains consistent with the real image at all scales. By evaluating the structural similarity between the blurry image and the sharp image at different scales, this loss function ensures consistency in both global and local structures of the image. Suppose the default parameters are represented by β and αk, the total number of scales is represented by L, the two variables of the stable weak denominator method are represented by Z1 and Z2, and the pixel is represented by u. The calculation formula is as follows:
$LOS{{S}_{M-S}}\left( u \right)=1-\frac{2{{\omega }_{P}}{{\omega }_{H}}+{{Z}_{1}}}{\omega _{P}^{2}+\omega _{H}^{2}+{{Z}_{1}}}\frac{2{{\delta }_{PH}}+{{Z}_{2}}}{\delta _{P}^{2}+\delta _{H}^{2}+{{Z}_{2}}}$ (11)
To improve the robustness of the model, this paper introduces the perceptual loss function. The perceptual loss function can capture high-level semantic features, thereby improving the visual quality of the generated image and making it more in line with human visual perception. Suppose the grayscale values at pixel u of the restored underwater image and the sharp image are represented by dϕ(au) and bu, the k-th activated convolutional layer is represented by ψk, and the number of channels, height, and width of the feature map are represented by Zk, Gk, and Qk, respectively. The number of features used in the perceptual loss function is denoted by O. The calculation formula is as follows:
$LOS{{S}_{GZ}}=\frac{1}{O}\sum\limits_{k}{\frac{1}{{{Z}_{k}}{{G}_{k}}{{Q}_{k}}}\left\| {{\psi }_{k}}\left( {{d}_{\varphi }}\left( {{a}_{u}} \right) \right)-{{\psi }_{k}}\left( {{b}_{u}} \right) \right\|}$ (12)
To make the output sample distribution of the generator as close as possible to the real sample distribution, this paper adopts the adversarial loss function. This loss function improves the visual realism of the generated product image through adversarial training between the generator and the discriminator. The generator tries to generate product images that are indistinguishable from real images, while the discriminator strives to differentiate between generated images and real images, thereby continuously improving the quality of the generated images. Suppose the discriminator is represented by F(·), and the probability that dϕ(au) is a sharp image is represented by F(dϕ(au)). The calculation formula is as follows:
${{M}_{AD}}=\sum\limits_{v=1}^{V}{-\log F\left( {{d}_{\varphi }}\left( a \right) \right)}$ (13)
The total loss function in this paper is the weighted sum of the above four loss functions. By adjusting the weights of each loss function, the contribution of different loss functions to the model training can be balanced, ultimately generating high-quality product images.
On four different types of image databases, the proposed model demonstrates excellent performance in image quality assessment, surpassing existing quality assessment models comprehensively (Table 1). Specifically, in the clothing type image database, the SROCC and PLCC of the proposed model reached 0.956 and 0.963, respectively, showing significant improvement compared to the second-best model, Reduced Reference IQA, which achieved 0.928 and 0.942. In the furniture type image database, the SROCC and PLCC of the proposed model were 0.905 and 0.912, also exceeding the Reduced Reference IQA's 0.842 and 0.889. In the electronics type image database, the SROCC and PLCC of the proposed model were both 0.945, significantly higher than other models, especially compared to CONIQUE's 0.854 and 0.856. In the beauty and skincare type image database, the SROCC and PLCC of the proposed model were 0.935 and 0.945, respectively, also surpassing other models, further proving its exceptional performance. The experimental results indicate that the proposed image quality assessment model performs excellently across different types of image databases, demonstrating strong adaptability and stability in handling diverse image types. This result suggests that the content-based and distortion retrieval-based evaluation method can more accurately identify and classify different types of image distortion issues, providing a more accurate quality assessment. Compared to traditional methods such as BRISQUE and Full Reference IQA, the proposed model not only achieves significant numerical breakthroughs but also demonstrates practical and efficient use in the e-commerce environment.
Table 1. Performance comparison with existing quality assessment models on four different types of image databases
|
Method |
Clothing Type |
Furniture Type |
Electronics Type |
Beauty and Skincare Type |
||||
|
SROCC |
PLCC |
SROCC |
PLCC |
SROCC |
PLCC |
SROCC |
PLCC |
|
|
BRISQUE |
0.785 |
0.812 |
0.569 |
0.658 |
0.452 |
0.487 |
0.885 |
0.915 |
|
Full Reference IQA |
0.826 |
0.865 |
0.526 |
0.634 |
0.532 |
0.589 |
0.902 |
0.915 |
|
DeepIQ RankIQA |
0.824 |
0.823 |
0.725 |
0.758 |
0.624 |
0.645 |
0.921 |
0.926 |
|
HyperIQA |
.856 |
0.865 |
0.809 |
0824 |
0.608 |
0.698 |
0.923 |
0.941 |
|
CONIQUE |
0.942 |
0.954 |
0.836 |
0.869 |
0.854 |
0.856 |
0.923 |
0.932 |
|
PQRNet |
0.923 |
0.948 |
0.825 |
0.854 |
0.856 |
0.845 |
0.924 |
0.926 |
|
Reduced Reference IQA |
0.928 |
0.942 |
0.842 |
0.889 |
0.859 |
0.856 |
0.956 |
0.934 |
|
The Proposed Model |
0.956 |
0.963 |
0.905 |
0.912 |
0.945 |
0.945 |
0.935 |
0.945 |
Figure 4. Ablation study of different numbers of retrieval instances in e-commerce product image quality assessment models
Table 2. Ablation study of different distance metrics in e-commerce product image quality assessment models
|
Distance |
Clothing Type |
Furniture Type |
||
|
SROCC |
PLCC |
SROCC |
PLCC |
|
|
Euclidean Distance |
0.954 |
0.958 |
0.894 |
0.912 |
|
Manhattan Distance |
0.952 |
0.956 |
0.902 |
0.912 |
|
The Proposed Method |
0.958 |
0.961 |
0.908 |
0.914 |
In the ablation study of different distance metrics in e-commerce product image quality assessment models, the proposed method performs the best in both clothing type and furniture type image databases. In the clothing type image database, the SROCC and PLCC using Euclidean distance are 0.954 and 0.958, respectively, while using Manhattan distance yields SROCC and PLCC of 0.952 and 0.956, respectively. The proposed method achieves SROCC and PLCC of 0.958 and 0.961, respectively. In the furniture type image database, the SROCC and PLCC with Euclidean distance are 0.894 and 0.912, respectively, with Manhattan distance yielding 0.902 and 0.912, respectively. The proposed method achieves 0.908 and 0.914, respectively. Overall, the proposed method outperforms models using Euclidean and Manhattan distances in both types of image databases. Analyzing the results of different distance metrics, it can be observed that the proposed method demonstrates higher evaluation accuracy for clothing and furniture type image databases. Compared to traditional Euclidean and Manhattan distances, the proposed method shows improvements in SROCC and PLCC metrics, with a more significant increase observed in the furniture type image database. This indicates that the proposed method can more effectively capture image content and distortion features, providing a more accurate quality assessment (Table 2).
As shown in Figure 4, in the ablation study of different numbers of retrieval instances for e-commerce product image quality assessment models, the performance of evaluation improves significantly with an increase in the number of retrieval instances for all four types of product images. In clothing type product images, the SROCC value increases from 0.924 to 0.960 as the number of retrieval instances rises from 1 to 10, indicating that evaluation performance gradually improves with more instances. For furniture type product images, the SROCC value rises from 0.888 to 0.933, stabilizing mainly after reaching 4 retrieval instances. In electronics type product images, the SROCC value increases from 0.898 to 0.935, showing a continuous improvement trend. For beauty and skincare type product images, the SROCC value increases from 0.840 to 0.907, with a significant rise, although the improvement slows down after reaching 5 instances. Overall, the data shows that increasing the number of retrieval instances has a significant positive impact on evaluation performance, especially with the most noticeable effects occurring during the initial increases. The results indicate that increasing the number of retrieval instances can significantly enhance the performance of image quality assessment models, particularly for clothing and electronics type product images. With more retrieval instances, the model can capture more image features and information, improving its ability to recognize and classify image quality issues. However, for furniture and beauty and skincare type product images, evaluation performance stabilizes after reaching a certain number of instances, suggesting that excessive retrieval instances may lead to diminishing marginal returns in these categories. Therefore, to balance computational efficiency and evaluation performance, it is advisable to select an appropriate number of retrieval instances based on the specific application scenario to optimize the practical effectiveness of the model.
Table 3. Ablation study of different MOS value aggregation strategies in e-commerce product image quality assessment models
|
Avg |
Number |
Beauty and Skincare |
Furniture Type |
||
|
SROCC |
PLCC |
SROCC |
PLCC |
||
|
Simple Average |
6 |
0.925 |
0.9254 |
0.905 |
0.9021 |
|
9 |
0.926 |
0.9369 |
0.906 |
0.9078 |
|
|
10 |
0.922 |
0.9354 |
0.904 |
0.9068 |
|
|
Weighted Average |
6 |
0.932 |
0.9458 |
0.906 |
0.9012 |
|
9 |
0.935 |
0.9485 |
0.905 |
0.9125 |
|
|
10 |
0.936 |
0.9412 |
0.903 |
0.9085 |
|
Table 4. Ablation study of different semantic classification modules in e-commerce product image quality assessment models
|
Semantic Classification Module |
Beauty and Skincare |
Furniture Type |
||
|
SROCC |
PLCC |
SROCC |
PLCC |
|
|
VGG |
0.956 |
0.9652 |
0.904 |
0.9212 |
|
AlexNet SqueezeNet |
0.954 |
0.9541 |
0.905 |
0.9264 |
|
ResNet- |
0.961 |
0.9562 |
0.902 |
0.9124 |
|
NasNet |
0.952 |
0.9526 |
0.903 |
0.9125 |
|
Xception |
0.956 |
0.9582 |
0.901 |
0.9256 |
|
EfficicntNct |
0.954 |
0.956 |
0.904 |
0.8874 |
|
The Proposed Module |
0.956 |
0.956 |
0.905 |
0.8795 |
In the ablation study of different MOS value aggregation strategies, the performance of the proposed model varies with different strategies for beauty and skincare and furniture type images (Table 3). For beauty and skincare images, using the simple average strategy, the SROCC and PLCC values for 6, 9, and 10 aggregated samples are 0.925 / 0.9254, 0.926 / 0.9369, and 0.922 / 0.9354, respectively. Using the weighted average strategy, these values are 0.932 / 0.9458, 0.935 / 0.9485, and 0.936 / 0.9412, respectively. It can be seen that the weighted average strategy slightly outperforms the simple average strategy in evaluating beauty and skincare images. For furniture type images, the simple average strategy yields SROCC and PLCC values of 0.905 / 0.9021, 0.906 / 0.9078, and 0.904 / 0.9068 for 6, 9, and 10 aggregated samples, respectively. The weighted average strategy gives values of 0.906 / 0.9012, 0.905 / 0.9125, and 0.903 / 0.9085. Although the differences are minor, the weighted average strategy performs slightly better in some cases. Analyzing the results of the ablation study for different MOS value aggregation strategies shows that the weighted average strategy generally performs better than the simple average strategy in evaluating both beauty and skincare images and furniture type images. Particularly for beauty and skincare images, the weighted average strategy shows higher SROCC and PLCC values under different numbers of aggregated samples compared to the simple average strategy, indicating that the weighted average strategy can more effectively reflect subtle differences in image quality. For furniture type images, although the performance of both strategies is close, the weighted average strategy has a notably higher PLCC value with 9 aggregated samples, suggesting that, with an appropriate number of samples, the weighted average strategy can better enhance evaluation performance.
In the ablation study of different semantic classification modules, the performance of the e-commerce product image quality assessment model varies significantly with different modules for beauty and skincare and furniture type images (Table 4). For beauty and skincare images, the ResNet module has the highest SROCC and PLCC values, 0.961 and 0.9562, respectively, while the proposed module has SROCC and PLCC values of 0.956 and 0.956, showing also good performance. Other modules like VGG, AlexNet, SqueezeNet, NasNet, and Xception have SROCC values ranging from 0.952 to 0.956 and PLCC values ranging from 0.9526 to 0.9652. For furniture type images, the VGG module has the highest PLCC value of 0.9212, while the SqueezeNet module has the highest SROCC value of 0.905. The proposed module has SROCC and PLCC values of 0.905 and 0.8795, respectively, showing some disparity. The analysis of the results from the ablation study indicates that different modules exhibit varying performance in image quality assessment. For beauty and skincare images, the ResNet module performs the best, demonstrating its effectiveness in extracting semantic features and details from images; the proposed module's performance is also close to the best, validating its design's effectiveness and applicability. For furniture type images, VGG and SqueezeNet modules excel in PLCC and SROCC, respectively, indicating advantages in extracting semantic features for furniture type images. However, the proposed module shows slightly weaker performance for furniture type images, suggesting a need for further optimization for specific image types.
Table 5. Ablation study results of e-commerce product image enhancement network
|
Method |
PSNR |
SSIM |
UIQM |
NIQE |
|
Proposed Network - Laplacian Operator - Wavelet Separation and Reconstruction |
21.254 |
0.824 |
2.874 |
4.895 |
|
Proposed Network - Laplacian Operator |
22.3654 |
0.895 |
2.895 |
4.851 |
|
Proposed Network - Wavelet Separation and Reconstruction |
23.548 |
0.912 |
3.026 |
4.756 |
|
Proposed Network |
23.265 |
0.914 |
3.125 |
4.265 |
In the ablation study of the e-commerce product image enhancement network, the proposed network and its variants show significant improvement in image quality (Table 5). The full network using both the Laplacian operator and wavelet separation and reconstruction has the best performance with PSNR, SSIM, UIQM, and NIQE values of 23.265, 0.914, 3.125, and 4.265, respectively. In contrast, the network using only the Laplacian operator has PSNR and SSIM values of 22.3654 and 0.895, slightly lower than the full network. The network using only wavelet separation and reconstruction achieves PSNR and SSIM values of 23.548 and 0.912, demonstrating higher detail reconstruction capability. The network combining Laplacian operator and wavelet techniques has relatively weaker performance with PSNR of 21.254 and SSIM of 0.824. The analysis of the ablation study results indicates that the effectiveness of the proposed network in image quality enhancement is mainly due to the combination of the Laplacian operator and wavelet transformation. The full network performs best in PSNR and SSIM metrics, showing significant advantages in enhancing image details and overall visual quality. Although the network using only wavelet separation and reconstruction shows excellent detail reconstruction, its UIQM and NIQE values are slightly lower, indicating some shortcomings in subjective image quality and naturalness. The network using only the Laplacian operator performs well in some metrics but does not match the overall performance of the full network. This suggests that combining both methods maximizes their individual advantages and achieves more balanced and outstanding image enhancement results.
Table 6. Comparison of image quality evaluation results for e-commerce product images after enhancement
|
|
Training Set |
Validation Set |
||||
|
|
MAE↓ |
MSE↓ |
PSNR↓ |
MAE↓ |
MSE↓ |
PSNR↓ |
|
HE |
2.562 |
0.625 |
5.124 |
2.058 |
0.558 |
4.125 |
|
NLM |
1.156 |
0.451 |
4.325 |
5.891 |
0.307 |
4.023 |
|
GF |
1.325 |
0.478 |
4.875 |
0.785 |
0.389 |
4.125 |
|
SRCNN |
1.425 |
0.475 |
4.425 |
0.912 |
0.425 |
4.124 |
|
EnhanceGAN |
1.378 |
0.489 |
4.326 |
0.635 |
0.378 |
3.785 |
|
MSCNN |
2.036 |
0.602 |
4.652 |
1.625 |
0.465 |
3.562 |
|
MSBDN |
1.458 |
0.523 |
4.325 |
1.365 |
0.425 |
3.325 |
|
Proposed Network |
0.987 |
0.448 |
4.215 |
0.458 |
0.356 |
3.458 |
In the comparison of image quality evaluation results for e-commerce product images after enhancement, the proposed network outperforms other methods in both the training and validation sets (Table 6). In the training set, the proposed network has MAE, MSE, and PSNR values of 0.987, 0.448, and 4.215, respectively, showing lower error and higher image quality compared to other methods. Specifically, the MAE and MSE values are lower than those of other networks, indicating effective reduction of errors and improved visual consistency during image enhancement. In the validation set, the proposed network has MAE, MSE, and PSNR values of 0.458, 0.356, and 3.458, still leading in all metrics compared to other methods. In contrast, methods such as EnhanceGAN, MSCNN, and MSBDN show weaker performance in PSNR, and their MAE and MSE values are higher than those of the proposed network. The analysis of the comparison results shows that the proposed network has a significant advantage in the precision and consistency of image enhancement. It demonstrates the lowest MAE and MSE values on both the training and validation sets, indicating stable and efficient enhancement under different dataset conditions. This is attributed to the combination of Laplacian operator and wavelet transformation technologies, which capture image details and features more effectively, thereby reducing errors and improving image quality.
The core content of this study is divided into two parts: the e-commerce product image quality assessment model and the image enhancement network based on Laplacian operator and wavelet transformation. First, the quality assessment model achieves automatic identification and classification of image quality issues through content and distortion retrieval. The goal of the assessment model is to provide rapid and accurate quality judgments to improve the overall quality management of e-commerce platform images. Second, the image enhancement network combines Laplacian operator and wavelet transformation techniques to refine image features and enhance visual effects. By effectively reconstructing and enhancing details, the network significantly improves the visual appeal and usability of images. The combination of these two components not only meets the requirements for high-quality and rapid processing of images in e-commerce but also provides new solutions and theoretical support for the field of image processing. The superiority and effectiveness of the proposed methods have been validated through a series of experiments. The e-commerce product image quality assessment model demonstrated excellent performance on four different image libraries, showing significant improvements in accuracy and efficiency compared to existing models. Ablation experiments on different distance metrics, retrieval instance numbers, MOS value aggregation strategies, and semantic classification modules further proved the robustness and adaptability of the model in various aspects. The ablation experiments of the image enhancement network and the comparison of image quality evaluation results also show that this network outperforms other advanced technologies in multiple quality metrics, proving its significant effectiveness in practical applications.
The research provides an efficient and accurate solution for image quality assessment and enhancement for e-commerce platforms, significantly improving visual effects and user experience. The design of the model and network is innovative both theoretically and practically, demonstrating strong application potential. By combining distortion retrieval with advanced image enhancement technologies, the research results are expected to have a broad impact on image processing and computer vision fields. Although the research shows advantages in many aspects, there are still some limitations, such as the model's generalization ability on different datasets and efficiency in real-time processing. Additionally, the enhancement network's performance under specific extreme conditions, such as high noise or low contrast images, needs improvement. Future research can focus on enhancing the model's real-time capability and cross-domain adaptability. Introducing deep learning and adaptive technologies to further improve the intelligence level of image quality assessment and enhancement is recommended. Moreover, exploring integration with other technologies, such as deep neural networks and GANs, could further optimize the model's effectiveness and application scope. Exploring diverse application scenarios, such as video quality enhancement and multimodal image processing, is also a promising direction for future research. Through continuous optimization and expansion, this study will provide more possibilities and support for image processing and e-commerce development.
This paper was supported by General Research Project of Economic and Social Development of Liaoning of China (Grant No.: 2022lslybkt-082).
[1] Amornkitvikai, Y., Tham, S.Y., Harvie, C., Buachoom, W.W. (2022). Barriers and factors affecting the e-commerce sustainability of Thai Micro-, Small-and Medium-Sized Enterprises (MSMEs). Sustainability, 14(14): 8476. https://doi.org/10.3390/su14148476
[2] Munshi, A., Alhindi, A., Qadah, T.M., Alqurashi, A. (2023). An electronic commerce big data analytics architecture and platform. Applied Sciences, 13(19): 10962. https://doi.org/10.3390/app131910962
[3] Cazabat, G., Paraschiv, D.M., Călin, A.C., Popovici, O.C. (2019). A contemporaneous statistical note on e-commerce adoption in Romania–Based SMEs. Amfiteatru Economic, 21(50): 177-193.
[4] Mustafa, S., Hao, T., Qiao, Y., Kifayat Shah, S., Sun, R. (2022). How a successful implementation and sustainable growth of e-commerce can be achieved in developing countries; A pathway towards green economy. Frontiers in Environmental Science, 10: 940659. https://doi.org/10.3389/fenvs.2022.940659
[5] Kim, B.K., Choi, J., Wakslak, C.J. (2019). The image realism effect: The effect of unrealistic product images in advertising. Journal of Advertising, 48(3): 251-270. https://doi.org/10.1080/00913367.2019.1597787
[6] Kwon, S., Suda, T., Nomura, T. (2024). 3D versus 2D: Effects of the number of dimensions of product images on perceptions of product size. Journal of Consumer Behaviour, 23(4): 1889-1899. https://doi.org/10.1002/cb.2312
[7] Kusuma, G.P. (2019). Classification of C2C e-commerce product images using deep learning algorithm. International Journal of Advanced Computer Science and Applications, 10(9): 196-203. https://doi.org/10.14569/IJACSA.2019.0100925
[8] Maier, E., Dost, F. (2018). Fluent contextual image backgrounds enhance mental imagery and evaluations of experience products. Journal of Retailing and Consumer Services, 45: 207-220. https://doi.org/10.1016/j.jretconser.2018.09.006
[9] Sioma, A. (2023). Vision system in product quality control systems. Applied Sciences, 13(2): 751. https://doi.org/10.3390/app13020751
[10] Feng, L., Qiu, P. (2018). Difference detection between two images for image monitoring. Technometrics, 60(3): 345-359. https://doi.org/10.1080/00401706.2017.1356378
[11] Murthad, A.Y., Yaseen, A.A., Al-Dabagh, M.Z.N. (2019). Deformation detection and classification system for car parts products using image processing algorithms. Materials Science and Engineering, 518(4): 042006. https://doi.org/10.1088/1757-899X/518/4/042006
[12] Niu, B., Xie, F. (2020). Incentive alignment of brand-owner and remanufacturer towards quality certification to refurbished products. Journal of Cleaner Production, 242: 118314. https://doi.org/10.1016/j.jclepro.2019.118314
[13] Arai, K., Shigetomi, O., Miura, Y., Yatsuda, S. (2019). Smartphone image based agricultural product quality and harvest amount prediction method. (IJACSA) International Journal of Advanced Computer Science and Applications, 10(9): 24-29.
[14] Ida, Z., Hidayati, I.N. (2020). Brand image and product quality against purchase decision: Sariayu hijab shampoo competitive environment. In IOP Conference Series: Earth and Environmental Science, 469(1): 012109. https://doi.org/10.1088/1755-1315/469/1/012109
[15] Olakanmi, S.J., Jayas, D.S., Paliwal, J. (2023). Applications of imaging systems for the assessment of quality characteristics of bread and other baked goods: A review. Comprehensive Reviews in Food Science and Food Safety, 22(3): 1817-1838. https://doi.org/10.1111/1541-4337.13131
[16] Jin, B.E., Kim, N.L., Yang, H., Jung, M. (2020). Effect of country image and materialism on the quality evaluation of Korean products: Empirical findings from four countries with varying economic development status. Asia Pacific Journal of Marketing and Logistics, 32(2): 386-405. https://doi.org/10.1108/APJML-11-2018-0456
[17] Miyata, T., Yanagawa, M., Kikuchi, N., Yamagata, K., Sato, Y., Yoshida, Y., Tomiyama, N. (2022). The evaluation of the reduction of radiation dose via deep learning-based reconstruction for cadaveric human lung CT images. Scientific Reports, 12(1): 12422. https://doi.org/10.1038/s41598-022-16798-9
[18] Maksimović-Moićević, S., Lukač, Ž., Temerinac, M. (2019). Objective estimation of subjective image quality assessment using multi-parameter prediction. IET Image Processing, 13(13): 2428-2435. https://doi.org/10.1049/iet-ipr.2018.6143
[19] Pedersen, M., Amirshahi, S.A., Provenzi, E. (2022). Image quality and perception: Introduction. Journal of the Optical Society of America A-Optics Image Science and Vision, 39(6): IQP1-IQP1.
[20] John Chemmanam, A., N, S., Jose, B.A. (2022). Fused features for no reference image quality assessment. The Imaging Science Journal, 70(5): 287-299. https://doi.org/10.1080/13682199.2023.2167267
[21] Varga, D. (2022). Saliency-guided local full-reference image quality assessment. Signals, 3(3): 483-496. https://doi.org/10.3390/signals3030028
[22] Steves, M.A., Xu, K. (2024). Mapping super-resolution image quality. Light: Science & Applications, 13(1): 39. https://doi.org/10.1038/s41377-024-01379-4