Xinlu Sun![]() | Jun Liu
| Jun Liu![]() | Yubing Qian*
| Yubing Qian*![]()
© 2024 The authors. This article is published by IIETA and is licensed under the CC BY 4.0 license (http://creativecommons.org/licenses/by/4.0/).
OPEN ACCESS
Aiming at key challenges in emotional recognition for college students in online learning, including the lack of experimental data sets, the imperfect emotion classification system, and the poor robustness of emotion recognition algorithms, this paper constructs an emotion recognition model for college students' online learning based on feature fusion and attention mechanism. First, based on face recognition technology, the Convolutional Neural Network (CNN) deep features, Histogram of Oriented Gradients (HOG) texture features, and Scale-Invariant Feature Transform (SIFT) features of images are extracted and fused, because three feature extraction algorithms have different feature extraction capabilities and have certain robustness to changes in image lighting, rotation, scale, and other factors, fusion can make feature vectors more comprehensive and rich in information, thereby improving the accuracy and robustness of detection and recognition; second, a ResNet network is constructed to complete the basic classification of learning expressions and verify the experimental results; In order to enhance the ability of deep learning methods to learn discriminative features from noisy signals and further improve classification accuracy, then, by combining the channel attention mechanism and soft thresholding to improve the ResNet network, a Deep Residual Shrinkage Network (DRSN) is constructed to achieve emotion recognition of college students' online learning; finally, through a horizontal comparison experiment of multiple different network structures, the effectiveness of the soft threshold attention mechanism is verified. This method obtains more complete facial expression features for emotion classification through feature fusion, and combines the channel attention mechanism module. The recognition accuracy of DRSN network is 84.12%, which is about 4.17% higher than the original ResNet network (79.95%). The application of this research can assess the concentration of college students in online learning and measure the degree of emotional engagement of college students. Through the analysis of model result data, teachers can understand the course content that college students are interested in, adjust teaching plans according to the learning status of students, help realize personalized teaching, and consolidate teaching results.
online learning, emotion recognition, feature extraction, feature fusion, attention mechanism, Deep Residual Network (ResNet), Deep Residual Shrinkage Network (DRSN)
In recent years, with various countries' emphasis and support for higher education, the continuous progress and innovation of internet technology, and the increasing acceptance and willingness to pay for online education among college students, the demand for online education in universities has been growing. However, in the natural environment of online learning, individual differences have a significant impact on online learning. Notable differences include prior knowledge and cognitive styles, etc. [1]. The design of online learning content and processes often overlooks students' personalities and psychology. The structured "online learning content" makes it hard for them to engage, resulting in a significant difference in concentration and interaction level compared to face-to-face teaching in traditional classrooms, failing to achieve the desired teaching goals. Therefore, researchers [2, 3] have proposed that emotion recognition can be used to analyze students' emotions in an online learning environment, to analyze whether students are focused and to judge the level of interaction, and accordingly to assess the students' learning state and suggest adjustments to learning strategies and content to promote the development of higher education teaching. From the perspective of physiological psychology, emotion encompasses complex states of experience, physiological responses, and behavior [4]. There are two ways for emotion recognition: one is to detect physiological signals such as breathing, heart rate, and body temperature, and the other is to detect emotional behaviors such as facial expression recognition, voice emotion recognition, and posture recognition. Since detecting physiological signals requires professional equipment, it is not very practical in classroom teaching or online learning environments. Currently, researchers mainly focus on expression recognition, voice recognition, and posture recognition for student emotion recognition in online learning. Among them, deep learning has shown excellent results in many fields such as computer vision and pattern recognition, such as face recognition, head pose estimation, etc. [5, 6], and many researchers have developed a series of advanced methods for emotion recognition [7-10], achieving excellent experimental results. Deep learning applications in emotion recognition in the field of education are also gradually developing, but there are few databases for student learning emotions, and there is no unified standard for database classification, with significant differences in expression categories. Meanwhile, a review of domestic and international research status reveals that current research on learning expressions mainly has the following problems: First, there is no unified standard for the classification of learning emotions; second, there are few databases related to learning expressions, and most of the current expression recognition technology is aimed at ordinary life expressions, lacking a database for learning expressions targeted at college student learners; third, learning expressions, due to their large intra-class differences and small inter-class differences, lead to poor robustness of emotion recognition algorithms, and related algorithms need to be improved.
In response to these problems, this paper constructs a college student online learning emotion recognition model based on feature fusion and attention mechanism. By querying relevant research literature on facial expression recognition, it was found that emotion recognition methods based on multimodal fusion are superior to single modal emotion recognition. Therefore, multi feature fusion was chosen for research, and attention mechanism is a hot research topic in the field of deep learning. It has been proven that it can improve the shortcomings of traditional Encoder-Decoder frameworks, enhance the performance and interpretability of artificial intelligence systems, and combine with residual networks to form a more powerful neural network structure. Method: Firstly, in response to the lack of a learning expression image database for college students, this paper collected 1655 images from 100 college students to build an online learning expression database for college students. At the same time, a survey of college students' learning situations was conducted. Participants and teachers classified the learning emotions of these images into six categories: focused, distracted, curious, confused, tired, and happy, and thus established a unified standard for college student learning emotion differentiation. Secondly, in response to the problem of poor robustness of emotion recognition algorithms, a multi-feature fusion feature extraction method combined with transfer learning VGG16 neural network model was used to extract the CNN deep global features, HOG local texture features, and SIFT local features of the expression images of the training and test sets, and the extracted features were normalized to minimize the difference between feature data, and the three features were concatenated to obtain fused features. Then, research on expression recognition algorithms based on feature fusion was conducted. The Resnet neural network structure was used, and a loss function designed for the expression recognition task. Through experimental testing and training, the model structure and hyperparameters were adjusted to obtain a model structure with better effects. Finally, to improve the accuracy of model classification, research on expression recognition algorithms based on feature fusion and attention mechanism was conducted. By combining with the ResNet network, and designing a channel attention mechanism module combined with a soft threshold function, the DRSN was constructed, and the effectiveness of the soft threshold attention mechanism module was verified through multiple groups of horizontal comparison experiments.
In the context of online learning, students' "facial expressions" are key subjective indicators of their current psychological state, emotions, and learning status. Accurate analysis of facial expressions can effectively assess the learning emotions of college students. Research on human expressions in various literatures [11-13] mainly focuses on six basic expressions: disgust, sadness, fear, anger, surprise, and happiness, with expression databases primarily sourced from movie videos or dynamic collections. However, expressions in educational environments differ from those in movies or daily life scenarios, especially during online learning, where students generally do not exhibit very exaggerated expressions and emotional changes, such as sadness, anger, or fear, making the common classification of expressions unsuitable for the online learning field.
Figure 1. Online learning expression database construction process
To build an online learning expression database, we collected videos of 100 students (50% male and 50% female) from the first and second years of college, who were learning courses on the school's online teaching platform. We select classrooms and offices with different lighting conditions as the experimental environment. The indoor lighting is not subjected to special treatment, and the sources of lighting are indoor fluorescent lamps and natural light outside the window, trying to maintain similarity with the classroom learning environment. The recording device was a laptop camera, with each student's video lasting 10 minutes. During the recording, it was ensured that there was sufficient lighting and no obstructions in front of the person. Before collecting data, we first obtained the informed consent of all students and informed them of the research purpose. In order to protect the privacy of participants, we anonymized the collected data, set limited access to the data, and only allowed team members who participated in the study to process and analyze it. The process of building the online learning expression database for college students is shown in Figure 1.
Psychologists have conducted extensive research on facial expressions and believe that the main basis for classifying expressions is the subtle differences in the eyebrows, eyes, nose, and mouth regions. They have also proposed the widely used Facial Action Coding System (FACS), which describes in detail the relationship between each expression and inner emotions. In order to enable computers to more accurately recognize learning expressions, this study combines a summary of "micro expressions" presented by psychology teachers and university full-time teachers during student learning, and uses the differences in features of mouth position, eye features, eyebrow features, head direction, and gaze direction to define and distinguish learning expressions. To determine objective standards for online learning expression classification, this study, based on related research outcomes and through observation of college students' online learning videos and consultation with psychology teachers and curriculum professional teachers, identified six frequently occurring learning expressions: focused, distracted, curious, confused, tired, and happy. Each student's learning expression image is verified and annotated by three different teachers, and any ambiguous expression images are ultimately determined through discussion. The specific definitions of expressions in the online learning expression database are shown in Table 1 below:
Table 1. Expression classification definitions
|
Expression Category |
Mouth Features |
Eye Features |
Eyebrow Features |
Head Orientation |
Gaze Direction |
|
Focused |
Closed |
Open |
Natural |
Straight ahead |
In front of the screen |
|
Distracted |
Closed |
Not looking at the screen |
Natural or lowered |
Shifted left/right or looking down |
To the left/right of the screen or downward |
|
Curious |
Open |
Widened |
Raised |
Straight ahead |
In front of the screen |
|
Confused |
Closed or downturned corners |
Open |
Frowning |
Straight ahead or looking down |
In front of the screen or downward |
|
Tired |
Open or yawning, larger distance between upper and lower lips |
Smaller or closed |
Natural or raised |
Looking down or up |
Above or below the screen |
|
Happy |
Corners raised or smiling |
Open |
Natural |
Straight ahead |
In front of the screen |
Finally, we identified image sequences where learners showed significant emotional changes. Based on the defined features of the six expressions, images with clear emotional expressions were categorized. After organizing the recorded data, converting images to grayscale, and standardizing their sizes, we ultimately obtained 1655 expression images from the 100 participants, including 406 focused, 306 distracted, 367 curious, 298 confused, 278 tired, and 372 happy.
3.1 CNN deep global features based on transfer learning
The feature fusion method used in this paper is the early fusion method, which immediately fuses the features of each modality after extracting them. The most common method is to perform simple concatenation operations on the features. Early fusion method learning utilizes the correlation and interaction between low-level features of each mode. Because only a single model is required for training, the training speed of this fusion method is faster.
Deep learning models are capable of effectively extracting deep features from facial expression images. Notable deep learning CNN models include AlexNet, GoogleNet, LeNet, VGGNet, ResNet, etc. [14], among which the VGG16 CNN model has become one of the most commonly used due to its simple network structure and good model performance.
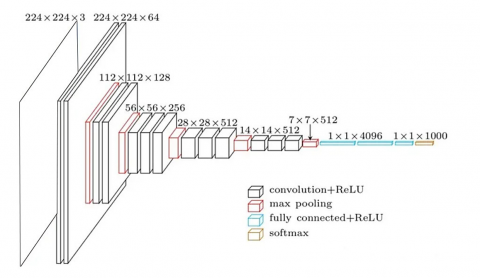
Figure 2. VGG16 CNN model
In this study, the VGG16 CNN model is utilized to extract deep global features of expression images through transfer learning. The original parameters of the model were trained on the ImageNet dataset. These original parameters are used as the initial parameters of the model. The VGG16 model is then trained using expression images from the online learning expression database, and finally, the trained model is used to extract deep features of the expression images. Figure 2 is the structural diagram of the VGG16 CNN model, consisting of 16 layers (13 convolutional layers + 3 fully connected layers, excluding pooling layers).
The training dataset is divided into two parts in a 3:1 ratio: a training set and a test set. The original weight parameters of the VGG16 model are used as the initial weight parameters. The model is trained using the training set sample data, and the model parameters are adjusted using the validation set. Finally, the adjusted VGG16 model is used to extract the CNN deep global features of the expression images. During the transfer learning process, the parameters are set as shown in Table 2 below:
Table 2. Model parameter settings
|
Parameter Name |
Parameter Setting |
Meaning |
|
Image Size |
224*224 |
Image input size for the VGG16 network model |
|
Learning Rate |
0.00001 |
Learning speed |
|
batch_size |
32 |
Number of images fed into the model at once |
|
epoch |
150 |
Number of training iterations for the training set sample data |
3.2 Extraction of HOG local texture features
HOG features are feature descriptors used for object detection in computer vision and image processing [15]. They are constructed by calculating and summarizing the histograms of gradient directions in local regions of an image. The core idea [16] is that in a facial image, the appearance and shape of local objects can be well described by the density of gradients and edges (statistical information of gradients, which mainly occur at edges). The process involves dividing the entire image into multiple small connected regions (cells) and computing the gradient or edge direction histograms for each cell. These histograms are combined to form feature descriptors. To improve accuracy, local histograms can be contrast-normalized over a larger region of the image (referred to as a block). The adopted method involves calculating the density of each histogram in its corresponding block and then normalizing all cells in the block based on this density. Normalization improves robustness against changes in lighting and shadows. The process of HOG feature extraction is as follows:
(1) Grayscale and Gamma Correction (Normalization)
Since HOG extracts texture features, which are independent of color information, it is necessary to convert color images to grayscale. Then, the image undergoes Gamma correction to standardize the entire image, enhancing the feature descriptor's robustness to lighting and other interfering factors. The correction formula is as follows:
$I(x,y)=I{{(x,y)}^{\gamma }},\gamma =0.5$ (1)
(2) Calculation of Image Gradients
The next step involves computing the gradients in the horizontal and vertical directions of the image, followed by calculating the gradient magnitude and direction for each pixel. Computing the image gradients through differentiation not only captures the edge and texture information of the image but also helps to reduce the effects of uneven lighting. To obtain the image gradients, convolution operations are performed on the image using gradient operators. The horizontal gradient component is obtained by convolving the image with a [-1,0,1] gradient operator, and the vertical gradient component is obtained using gradient operator [-1,0,1]ᵀ. The formulas for calculating the image's gradient magnitude and direction are as follows:
Horizontal gradient calculation formula:
$Gx(x,y)=I(x+1,y)-I(x-1,y)$ (2)
Vertical gradient calculation formula:
$Gy(x,y)=I(x,y+1)-I(x,y-1)$ (3)
Gradient magnitude calculation formula for each pixel:
$\nabla G(x,y)=\sqrt{{{G}_{x}}{{(x,y)}^{2}}+{{G}_{y}}{{(x,y)}^{2}}}$ (4)
Gradient direction calculation formula for each pixel:
$theta(x,y)=\arctan ({{G}_{y}}(x,y)/{{G}_{x}}(x,y))$ (5)
(3) Calculation of Gradient Direction Histograms in Cells
The image is divided into several connected regions (cells), such as 8×8 pixels per cell, with adjacent cells not overlapping. All gradient directions are divided into 9 directional bins (bins). Gradient direction histograms are then calculated within each cell. The direction angle can be set to either (0,180°) or (0,360°). Ultimately, each cell corresponds to a 9-dimensional feature vector.
(4) Normalization of Gradient Direction Histograms in Blocks
Each block consists of 2×2 adjacent cells. The gradient vectors of all cells in a block are concatenated to form the block's feature vector. The gradient direction histograms of all pixels in each cell are calculated and the cell's feature vectors are normalized, as shown in formula (6):
${{X}_{i}}=(\frac{{{x}_{1}}}{{{x}_{\max }}},\frac{{{x}_{2}}}{{{x}_{\max }}},\frac{{{x}_{3}}}{{{x}_{\max }}},\cdots ,\frac{{{x}_{9}}}{{{x}_{\max }}}),i=1,2,3,4$ (6)
where, $x_{\max }$ seems to be the maximum value in all eigenvectors, normalized cell feature vectors are then concatenated, resulting in a 36-dimensional feature vector for each block.
(5) Finally, the feature vectors of all blocks are concatenated to form the final HOG feature of each image
In the extraction of HOG features for this study, the experimental parameter settings were as follows: cells_per_block=(2,2), pixels_per_cell=(8,8), orientations=9. The size of each connected region is 8*8, each block consists of 2*2 adjacent cells, and the size of each block is 16*16. The gradient direction histograms of 9 directions are calculated for each connected region, with a 9-dimensional vector for each cell and a 36-dimensional vector (9*4) for each block. The entire image contains 7*7 blocks, resulting in a final feature vector dimension of 7*7*36=1764 dimensions.
3.3 Extraction of SIFT features
SIFT is an algorithm for extracting local features in images. It precisely locates and determines the main orientation of keypoints (feature points, key points) in different scale spaces, and constructs keypoint descriptors to extract features [17]. The essence of the SIFT algorithm is to find keypoints (feature points) across different scale spaces and calculate their orientations. Keypoints identified by SIFT are highly distinctive and remain invariant to changes in lighting, affine transformations, and noise. These keypoints include corner points, edge points, bright spots in dark regions, and dark spots in bright areas. The process flow of the SIFT feature extraction is depicted in the following diagram (Figure 3).
Figure 3. SIFT feature extraction process
3.4 Feature fusion
Since the extracted CNN deep global features, HOG local texture features, and SIFT local features vary significantly in their values, it is necessary to normalize these three types of features. The normalization process scales the feature values to a range between 0 and 1, and standardizes the feature vectors to a normal distribution. This normalization makes it easier for the model to capture patterns, thereby reducing the numerical differences between features, enhancing their correlation, and decreasing the likelihood of model overfitting. The normalized CNN deep global features, HOG local texture features, and SIFT local features are then concatenated. This process is shown in the following formula (7):
${{F}^{'}}=\frac{F-{{F}_{\min }}}{{{F}_{\max }}-{{F}_{\min }}}$ (7)
where, $F^{\prime}$ represents the normalized feature vector, $F$ is the original feature vector value, $F_{\min }$ is the smallest original feature vector value, and $F_{\max }$ is the largest original feature vector value.
The normalized CNN deep global features, HOG local texture features, and SIFT local features are then concatenated. This process is shown in the following formula (8):
${{F}^{'}}=\{{{F}_{1}}^{'},{{F}_{2}}^{'},{{F}_{3}}^{'}\}$ (8)
3.5 Comparative analysis of experimental results with different characteristics
The purpose of this section of the experiment is to compare and analyze the recognition effects of different features on online learning expressions. The ratio of training sample data to test sample data is set to 8:2. At the same time, in order to ensure the credibility of the experimental results, the training sample data and test sample data were randomly divided 10 times, and the mean of the 10 experimental results was calculated. The recognition results of online learning expressions based on different features are shown in Table 3.
Table 3. Comparison of recognition accuracy for different features
|
Experiment Times |
CNN Features |
HOG Features |
SIFT Features |
Fusion Features |
|
1 |
76.78% |
74.87% |
65.09% |
86.05% |
|
2 |
79.01% |
69.76% |
64.89% |
82.08% |
|
3 |
81.98% |
77.39% |
65.07% |
82.86% |
|
4 |
77.87% |
81.09% |
62.01% |
85.23% |
|
5 |
75.64% |
74.89% |
60.34% |
80.02% |
|
6 |
78.13% |
72.08% |
67.80% |
79.98% |
|
7 |
79.46% |
68.09% |
62.89% |
81.98% |
|
8 |
71.87% |
72.65% |
60.26% |
77.78% |
|
9 |
77.78% |
59.97% |
62.01% |
80.67% |
|
10 |
78.67% |
69.28% |
60.87% |
82.29% |
|
average accuracy |
77.72% |
72.01% |
63.12% |
81.89% |
One of the important indicators for evaluating the effectiveness of algorithms is recognition accuracy. From the above table, it can be seen that the average recognition accuracy of the fused features in 10 experiments is 81.89%, which is significantly higher than the recognition accuracy of the other three single features. This indicates that feature fusion is effective for this study.
4.1 Design of loss function
The loss function plays a crucial role in deep learning as it measures model performance, guides parameter optimization, and aids in model selection. It is a core component of model training and evaluation [18]. Due to the presence of many similar features in different facial expressions, emotion recognition tasks face the challenge of insufficient inter-class distances. To address this, it's necessary to design a loss function that increases the distance between different classes while decreasing the distance within the same class. Suppose there are input feature space X and label space Y, with the feature input into the neural network being $x_i \in X$, and its label being $y_i \in Y$. The output label of the input feature after passing through the neural network is shown in the following formula (9):
$\overline{{{y}_{i}}}={{F}_{r}}({{w}_{r}},{{x}_{i}})$ (9)
where, $F_r$ represents the neural network operation mechanism, and $W_r$ represents the neural network parameters.
Assume $d$ is the number of classes, with the class center being $c \in R^{m \times d}$, and its initial distribution is a random sampling of a Gaussian distribution in $d$-dimensions. Let $\|x\|_2$ denote the $l_2$ norm of vector $x$, and $\|x\|_2=\left(\sum_{i=1}^n x_i^2\right)^{\frac{1}{2}}$. The loss function used in this study is shown in formula (10):
$L(y,\overline{y})=\frac{\sum\nolimits_{i=1}^{M}{\left\| \overline{{{y}_{i}}}-{{c}_{yi}} \right\|_{2}^{2}}}{\sigma _{c}^{2}}$ (10)
In this formula, M is the total number of input features, and $\sigma_c$ represents the standard deviation between class centers. This loss function discriminates the distance between the output features and their class centers in the denominator, and the distance between class centers in the numerator, overall increasing the distance between class centers while bringing the features within a class closer to their respective centers.
To verify the effectiveness of the loss function proposed in this article, we use ResNet as the backbone network. The loss functions are compared using the cross entropy loss function and the loss function added to the cross entropy loss function using Eq. (10). The input features are trained through a neural network, and the output features are subjected to SNE dimensionality reduction and visualization. The loss function proposed in this paper can make the intra class features more compact, while increasing the inter class center distance.
4.2 Network structure design
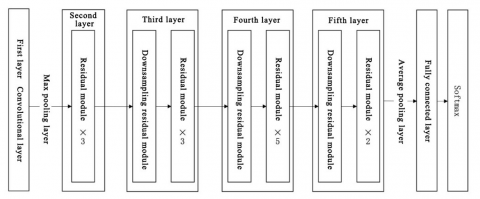
Figure 4. ResNet 18 network model structure
The ResNet is a type of CNN. Compared to traditional CNNs, ResNet incorporates skip connections that jump over some layers, preventing gradient vanishing and network degradation, thus easing the training of deep CNNs [19]. The ResNet 18 network model used in this study is shown in Figure 4, and its network structure configuration is detailed in Table 4.
Table 4. ResNet 18 network configuration
|
Layer Name |
Output Size |
Network Model |
|
Conv1 |
112×112×64 |
7×7, 64, stride 2, padding 3 |
|
Max pooling |
56×56×64 |
3×3, 64, stride 2, padding 1 |
|
Conv2 |
56×56×64 |
$\left[\begin{array}{ll}3 \times 3, & 64 \\ 3 \times 3, & 64\end{array}\right] \times 2$ |
|
Conv3 |
28×28×128 |
$\left[\begin{array}{ll}3 \times 3, & 128 \\ 3 \times 3, & 128\end{array}\right] \times 2$ |
|
Conv4 |
14×14×256 |
$\left[\begin{array}{ll}3 \times 3, & 256 \\ 3 \times 3, & 256\end{array}\right] \times 2$ |
|
Conv5 |
7×7×512 |
$\left[\begin{array}{ll}3 \times 3, & 512 \\ 3 \times 3, & 512\end{array}\right] \times 2$ |
|
Avg pooling |
1×1×512 |
7×7, stride 2 |
|
Fc |
7 |
7×1 |
The reason we use ResNet 18 network for six online learning expression recognition classifications is because the advantages of using ResNet for image classification tasks are mainly reflected in the following aspects: solving network degradation problems, improving accuracy, strong generalization ability, easy tuning, and strong transfer learning ability. This paper uses the pre trained resnet18 model on the ImageNet dataset for six online learning expression recognition classifications. The pre trained model can significantly shorten training time, save computational resources, and achieve better results on the six online learning expression datasets with the help of the generalization ability of the ResNet pre trained model. Due to the fact that the output layer of the ResNet pre trained model is 1000, and the number of classification tasks in this case is 6, it is necessary to change the number of output layers of resnet18 to 6 and freeze all parameters of other network layers.
4.3 Experimental results
The experiment for this algorithm used images from a self-built online learning expression database, totaling 1655 expression images. Among these, 406 images were categorized as 'focused', 306 as 'distracted', 367 as 'curious', 298 as 'confused', 278 as 'tired', and 372 as 'happy'. The ratio of the training set to the test set was 4:1, with a total of 1324 images in the training set and 331 images in the test set. The distribution is shown in Table 5.
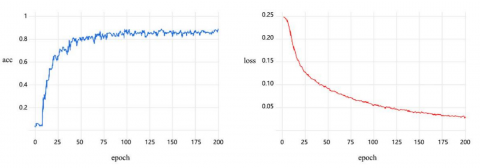
The experiment used the Adam optimizer with a batch size of 32 and a default learning rate of 0.001, with training conducted over 200 iterations. The training accuracy and loss rate of the ResNet network are shown in Figure 5. The precision, recall, and F1 scores for different types of learning expressions are detailed in Table 6.
Table 5. Distribution of expressions in the online learning dataset
|
Label |
Focused |
Distracted |
Curious |
Confused |
Tired |
Happy |
|
Training Set |
325 |
245 |
294 |
238 |
222 |
300 |
|
Test Set |
81 |
61 |
73 |
60 |
56 |
72 |
Figure 5. Training accuracy and loss curve
Table 6. Precision, recall, and F1 score for different types of learning emotions
|
|
Focused |
Distracted |
Curious |
Confused |
Tired |
Happy |
|
Precision |
83.2% |
83.1% |
72.1% |
79.7% |
75.8% |
92.5% |
|
Recall |
81.9% |
82.6% |
68.4% |
77.4% |
74.7% |
92.3% |
|
F1 |
82.1% |
84.5% |
68.6% |
78.6% |
75.1% |
92.3% |
Research indicates that in computer vision tasks, attention mechanisms can help models better understand input images or videos, thereby improving model performance [20]. Common attention mechanisms used in computer vision include spatial attention, channel attention, mixed attention, and self-attention mechanisms. A representative model of channel attention mechanism is the Squeeze-and-Excitation Network (SENet) [21]. The squeezing part aims to compress global spatial information, followed by feature learning in the channel dimension, and finally, the excitation part allocates different weights to each channel. This mechanism is particularly suitable for the emotion recognition algorithm based on feature fusion designed in this study. The channel attention mechanism module can be of two types: a conventional channel attention mechanism module (structure shown in Figure 6) and a channel attention mechanism combined with a soft threshold function.
Figure 6. SENet module structure
The structure of the SE module is shown above. In the squeezing part, the input feature map dimensions are $H \times W \times C$, where H, W, and C represent height, width, and number of channels, respectively. The squeezing function reduces the dimension from $H \times W \times C$ to $1 \times 1 \times C$ through global average pooling. In the excitation part, the dimension obtained from the squeezing part is integrated into a fully connected layer to predict the importance of each channel, which is then excited onto the corresponding channel of the previous feature map.
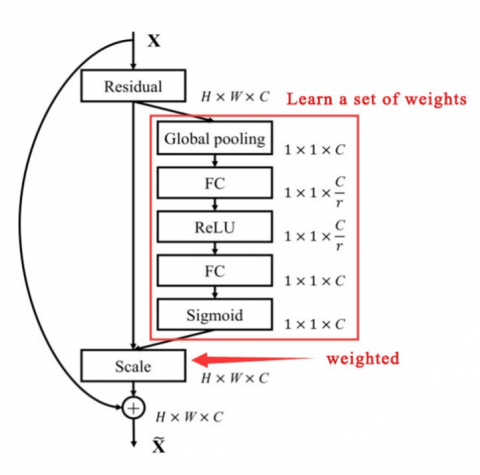
Although the SENet model has the advantages of small parameter size, good generalization performance, and high scalability compared to other models, it also has some drawbacks, such as long training time, requiring more iterations and computing resources, and being sensitive to initial weights. Therefore, it needs to be improved and optimized. The channel attention mechanism combined with the soft threshold function is an integration of attention mechanism and soft thresholding in the improved ResNet network form, known as DRSN. The residual block of DRSN is similar to that of ResNet, consisting of multiple convolutional layers, batch normalization layers, and activation functions. The difference is that DRSN adds a shrinkage operation at the end of each residual block to reduce the number of channels in the network. This contraction operation can be average pooling, maximum pooling, or convolution. Through this approach, DRSN can significantly reduce the size and computational complexity of the model while maintaining its performance. Given that the primary dataset used in this study is the student online learning expression dataset, which is a natural environment dataset characterized by a variety of facial poses, lighting, and occlusions, as well as diverse noises, the DRSN is particularly effective. It enhances the deep learning method's ability to learn discriminative features from noisy signals and improves classification accuracy [22]. Soft thresholding can also reduce the risks of gradient vanishing and explosion. In SENet, the specific pathway includes Global Average Pooling → Fully Connected Layer → ReLU Function → Fully Connected Layer → Sigmoid Function, as shown in Figure 7.
The DRSN employs a similar sub-network to automatically set the thresholds required for soft thresholding (as shown in Figure 8). The sub-network within the red box learns a set of thresholds to be applied to each channel of the feature map. In this sub-network, the absolute values of all elements in the input feature map are first computed. Then, after global average pooling and averaging, a feature is obtained, denoted as A. In another pathway, the feature map after global average pooling is fed into a fully connected network, which ends with a Sigmoid activation function to adjust the output between 0 and 1, obtaining a coefficient denoted as α. The final threshold is α×A. In essence, the threshold is a number between 0 and 1 multiplied by the average absolute value of the feature map. This method ensures that the threshold is positive and that different samples have different thresholds.
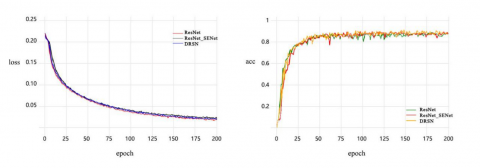
To study the effectiveness of the attention mechanism module, this paper compares the conventional ResNet network, the ResNet network embedded with the attention mechanism module (SENet), and the DRSN network, which integrates the attention mechanism and soft thresholding. The embedding of the attention mechanism module occurs after the residual module and before the addition operation, with the networks named ResNet, ResNet_SENet, and DRSN, respectively. The experimental results are shown in Table 7. The accuracy of ResNet_SENet is 82.57%, which is 2.63% higher than ResNet. The accuracy of DRSN is 84.12%, which is 4.17% higher than ResNet. However, there is no significant change in their FLOPs (Floating Point Operations Per Second).
Figure 7. SENET network channel weighting execution path
Figure 8. Path for setting thresholds in DRSN
The training curves of different networks after incorporating the attention mechanism module are shown in Figure 9. In the right image, all three networks stabilize after the 50-th iteration, with the DRSN network showing more stability and less fluctuation in the accuracy curve after reaching equilibrium compared to the other two networks.
The precision, recall, and F1 scores of the DRSN network are shown in Table 8. Compared to Table 5 from the previous section, it can be seen that after incorporating the soft threshold attention mechanism module, the model significantly improves the precision and F1 score of the categories, with the recall rate showing little difference from before the incorporation.
Table 7. Accuracy and FLOPs of various network structures
|
Network Structure |
Accuracy |
FLOPs |
|
ResNet |
79.95% |
1.83B |
|
ResNet_SENet |
82.57% |
1.85B |
|
DRSN |
84.12% |
1.87B |
Figure 9. Training curves of various networks
Table 8. Precision, recall, and F1 score of DRSN network
|
|
Focused |
Distracted |
Curious |
Confused |
Tired |
Happy |
|
Precision |
84.6% |
85.1% |
76.1% |
82.4% |
78.9% |
94.6% |
|
Recall |
82.1% |
82.5% |
70.4% |
78.1% |
74.9% |
92.2% |
|
F1 |
84.1% |
87.2% |
77.5% |
83.7% |
77.2% |
93.8% |
The rise of the new generation of information technology has driven the rapid development of online learning. How to improve the learning effectiveness of online learning is an important issue in the development of online learning. Facial expressions are an important factor for learners to reflect their emotions in learning, this paper began from the perspective that the features extracted determine the effectiveness of emotion classification and studied emotion recognition algorithms based on deep learning. Then, it combined feature fusion, channel attention mechanism modules, and deep learning neural networks to explore an online learning emotion recognition network for college students, enhance the network’s recognition ability by applying channel attention mechanisms to weight and denoise key features. Emotion recognition in online learning, as a typical classification task, also faces inevitable difficulties and challenges. Therefore, further research needs to improve the following content: (1) The expression samples in the online learning expression database for college students constructed in This paper are relatively small. Further research on learning expression recognition algorithms requires a database with a large sample size and rich expression categories, therefore it is necessary to further expand the sample data size of the database. (2) This paper studies six key learning emotions in online learning, but the expression categories in online learning are rich, and the six expressions in This paper cannot represent all learning emotion types. Therefore, further research is needed on the categories of online learning expression databases. (3) This paper is only a preliminary application of computer vision technology to student emotional state recognition and related improvements. There is still much room for improvement in recognition accuracy and detection speed, and there are also many areas that need to be optimized in model improvement. Further research and exploration are needed.
The research results of this paper have certain applications in the field of online learning education, which can help teachers better understand and pay attention to the learning status and needs of students, thereby improving teaching quality and effectiveness. Firstly, learning emotional recognition can help teachers better manage their classrooms. By observing the facial expressions of students, teachers can determine their emotional and attention states, and adjust teaching strategies and classroom management methods in a timely manner. Secondly, learning emotional recognition can assist teachers in personalized teaching. By observing the facial expressions and emotional states of students, teachers can determine their learning status and needs, and thus provide personalized teaching and guidance. For example, when students are found to have poor mastery of a certain knowledge point, teachers can provide targeted explanations and exercises to help students better understand and master it; When students are found to be feeling low or lacking motivation, teachers can adopt some methods of motivation or encouragement. At the same time, online learning facial expression recognition technology can enable teachers to observe students' expressions and emotional states through remote videos, thereby determining their learning status and needs, and making corresponding adjustments and guidance.
This work is supported by the Special Research Topic of the China Association for Business Economics in 2023 (Grant No.: 2023ZSZJYB17).
[1] Bälter, O., Jemstedt, A., Abraham, F.J., Osowski, C.P., Mugisha, R., Bälter, K. (2023). Effect of personalized email-based reminders on participants’ timeliness in an online education program: Randomized controlled trial. JMIR Formative Research, 7(1): e43977. https://doi.org/10.2196/43977
[2] Harb, A.A., Gad, A., Yaghi, M., Alhalabi, M., Zia, H., Yousaf, J., Ghazal, M. (2023). Diverse distant-students deep emotion recognition and visualization. Computers and Electrical Engineering, 111: 108963. https://doi.org/10.1016/J.COMPELECENG.2023.108963
[3] Mishra, S.P., Warule, P., Deb, S. (2023). Chirplet transform based time frequency analysis of speech signal for automated speech emotion recognition. Speech Communication, 155: 102986. https://doi.org/10.1016/J.SPECOM.2023.102986
[4] Wu, C., Davaasuren, D., Shafir, T., Tsachor, R., Wang, J.Z. (2023). Bodily expressed emotion understanding through integrating Laban movement analysis. arXiv preprint arXiv:2304.02187. https://doi.org/10.48550/arXiv.2304.02187
[5] Xu, L., Chen, J., Gan, Y. (2019). Head pose estimation with soft labels using regularized convolutional neural network. Neurocomputing, 337: 339-353. https://doi.org/10.1016/j.neucom.2018.12.074
[6] Wang, G., Yuan, Y., Chen, X., Li, J., Zhou, X. (2018). Learning discriminative features with multiple granularities for person re-identification. In Proceedings of the 26th ACM International Conference on Multimedia, pp. 274-282. https://doi.org/10.1145/3240508.3240552
[7] Baek, J.Y., Lee, S.P. (2023). Enhanced speech emotion recognition using DCGAN-based data augmentation. Electronics, 12(18): 3966. https://doi.org/10.3390/electronics12183966
[8] Hema, C., Marquez, F.P.G. (2023). Emotional speech recognition using CNN and deep learning techniques. Applied Acoustics, 211: 109492. https://doi.org/10.1016/j.apacoust.2023.109492
[9] Fernández Herrero, J., Gómez Donoso, F., Roig Vila, R. (2023). The first steps for adapting an artificial intelligence emotion expression recognition software for emotional management in the educational context. British Journal of Educational Technology, 54(6): 1939-1963. https://doi.org/10.1111/bjet.13326
[10] Arora, T.K., Chaubey, P.K., Raman, M.S., Kumar, B., Nagesh, Y., Anjani, P.K., Debtera, B. (2022). Optimal facial feature based emotional recognition using deep learning algorithm. Computational Intelligence and Neuroscience, 2022: 8379202. https://doi.org/10.1155/2022/8379202
[11] Pokharel, R., Kaur, M., Rakesh, N., Nand, P. (2022). Facial expression recognition system. Smart Innovation, Systems and Technologies, 235: 81-89. https://doi.org/10.1007/978-981-16-2877-1_8
[12] Turan, C., Neergaard, K.D., Lam, K.M. (2019). Facial expressions of comprehension (FEC). IEEE Transactions on Affective Computing, 13(1): 335-346. https://doi.org/10.1109/TAFFC.2019.2954498
[13] Owusu, E., Kumi, J.A., Appati, J.K. (2021). On facial expression recognition benchmarks. Applied Computational Intelligence and Soft Computing, 2021: 9917246. https://doi.org/10.1155/2021/9917246
[14] Hussein, H.S., Ali, M.H.E., Ismeil, M., Shaaban, M.N., Mohamed, M.L., Atallah, H.A. (2023). Automatic modulation classification: Convolutional deep learning neural networks approaches. IEEE Access. 11: 98695-98705. https://doi.org/10.1109/ACCESS.2023.3313393
[15] Dixit, U.D., Shirdhonkar, M.S., Sinha, G.R. (2023). Automatic logo detection from document image using HOG features. Multimedia Tools and Applications, 82(1): 863-878. https://doi.org/10.1007/s11042-022-13300-5
[16] Li, Y., Lu, R., Huang, R., Zhang, W. (2021). Research on face recognition algorithm based on hog feature. In Journal of Physics: Conference Series, 1757(1): 012099. https://doi.org/10.1088/1742-6596/1757/1/012099
[17] Harihar, S., Manjunath, R. (2020). SIFT image feature extraction for an efficient image registration. International Journal of Recent Technology and Engineering, 8(6).
[18] Avi-Aharon, M., Arbelle, A., Raviv, T.R. (2023). Differentiable histogram loss functions for intensity-based image-to-image translation. IEEE Transactions on Pattern Analysis and Machine Intelligence, 45(10): 1-12. https://doi.org/10.1109/TPAMI.2023.3278287
[19] Panda, M.K., Subudhi, B.N., Veerakumar, T., Jakhetiya, V. (2023). Modified ResNet-152 network with hybrid pyramidal pooling for local change detection. IEEE Transactions on Artificial Intelligence, 2023: 1-14. https://doi.org/10.1109/TAI.2023.3299903
[20] Hu, J.Q., Liu, Y., Wu, K.S. (2022). Neural network pruning based on channel attention mechanism. Connection Science, 34(1): 2201-2218. https://doi.org/10.1080/09540091.2022.2111405
[21] Mekruksavanich, S., Jitpattanakul, A. (2023). A hybrid convolution neural network with channel attention mechanism for sensor-based human activity recognition. Scientific Reports, 2023, 13(1): 12067. https://doi.org/10.21203/rs.3.rs-2745728/v1
[22] Wen, X., Cao, C., Li, Y., Sun, Y. (2022). DRSN with simple parameter-free attention module for specific emitter identification. In 2022 IEEE International Conference on Trust, Security and Privacy in Computing and Communications (TrustCom), Wuhan, China, pp. 192-200. https://doi.org/10.1109/TrustCom56396.2022.00036