Amit Kumar*![]() | Rashmi Saini
| Rashmi Saini![]() | Rajeev Kumar
| Rajeev Kumar![]()
© 2024 The authors. This article is published by IIETA and is licensed under the CC BY 4.0 license (http://creativecommons.org/licenses/by/4.0/).
OPEN ACCESS
Cancer, a disease with numerous subtypes, poses a deadly threat to human life, with the potential for successful clinical treatment heavily reliant on early detection and appropriate treatment planning. The classification of cancer patients into either low or high-risk subgroups is critical. Consequently, various research teams spanning the biomedical and bioinformatics fields have explored the use of Machine Learning (ML) technology in this crucial domain. The impressive capability of ML algorithms to discern significant features in complex datasets underscores their value. In the current study, we propose a framework to detect breast cancer (through benign and malignant categorization) utilizing advanced ML techniques with high accuracy. This framework deploys the Wisconsin Breast Cancer (Diagnostic) dataset. Five supervised ML techniques, namely Decision Tree, Random Forest (RF), Support Vector Machine (SVM), Extreme Gradient Boosting (XGBoost), and Artificial Neural Network (ANN), are trained for classification purposes. Out of 569 samples, 70% are allocated for training while the other 30% for testing. A comprehensive evaluation of ML techniques is performed using an array of metrics: precision, recall, specificity, F1 score, classification accuracy, ROC Curve, training time, and feature utilization. Additionally, feature importance is computed for each classifier. The results reveal that the SVM has the maximum accuracy as 97.66%, with an F1-score of 0.98 for benign and 0.97 for malignant classifications. Conversely, the decision tree registers the minimum performance (94.55%) with an F1-score of 0.95 for benign and 0.91 for malignant classes. Accuracy scores for RF, XGBoost, and ANN stand at 95.32%, 95.91%, and 97.07%, with corresponding F1-scores of 0.96, 0.97, and 0.98 for benign and 0.94, 0.95, and 0.96 for malignant respectively. Interestingly, RF and XGBoost exhibited near-equivalent similarly with respect of accuracy measurements. In the context of the area over the ROC curve, SVM outperformed the other ML classifiers and also reported the shortest training time. Conversely, the ANN reported the longest training time.
benign, feature importance, malignant, supervised machine learning, feature selection
Breast cancer, which develops from the cells of the breast, is a prevalent health concern. Considerable funding for breast cancer awareness and research has fueled progress in the recognition and treatment of this disease, effectively reducing mortality rates. Thanks to such advancements, coupled with earlier detection, innovative treatment options, and a more comprehensive understanding of the disease, survival rates have improved and associated deaths have declined. Within the scope of this research, our focus narrows to recognize breast cancer using machine learning.
The concept of classification, the process of sorting feature vectors into more than one classes, can vary among algorithms, and choosing an appropriate algorithm for a certain task involves many decisions. A primary challenge in the early identification of breast cancer lies in distinguishing benign from malignant tumors. Benign breast cancers are characterized by noncancerous cells, while malignant ones consist of cancerous cells that may start to spread. Early intervention can prevent benign tumors from progressing to dangerous stages.
To efficiently categorize breast cancer as benign or malignant, we propose a fast-acting predictive model for cancer categorization, operating within a human-computer interactive (HCI) diagnosis framework. Several HCI design approaches exist for cancer prediction [1]. The technique for predictive modeling we propose integrates HCI principles and includes an evaluation of the user interface for digital health systems [2]. While negotiation research encompasses many applications of cognitive HCI [3], the approaches for examining and assessing interacting patterns have been widely studied. The conventional categorization of affective, behavioral, and cognitive dimensions into positive, negative, and non-engagement introduces various fallacies [4].
This research investigates a number of machine learning strategies to perform the cancer categorization, identifying the most effective classifier based on parameters such as accuracy, precision, recall, specificity, F1 score, ROC AUC curve, training time, and maximum feature utilization.
The focus of this research is on five classifiers: the Decision Tree, the Random Forest, the SVM, XGBoosting, and ANN. We leverage the Wisconsin Breast Cancer (Diagnostic) dataset [5], comprising 569 samples and 30 features, with 212 malignant and 357 benign samples.
The purpose of this research is to detect breast cancer using classifier-based supervised machine learning methods that perform most efficiently on the given dataset and to decide the top predictive features. The remaining part of the article is structured into the following sections: Section 2 discusses the methods and findings of previous studies on breast cancer diagnosis. Section 3 discusses the planned technique for our study. Section 4 summarizes and examines the experimental outcomes. Finally, Section 5 concluded the article.
The realm of machine learning offers a plethora of algorithms for the detection and identification of breast cancer. Researchers utilize a variety of datasets to delve deeper into the studies on this disease. These datasets provide a resource for authors to extract and focus on different aspects for further exploration.
Within these methodologies, a decision tree-based diagnosis technique has been employed to identify breast cancer [6]. To augment the accuracy, it is recommended to eliminate some highly significant parameters. Subsequent to correlation and independence testing, variables such as tumor thickness and cell shape consistency are selected as a subsection of the decision tree approach. Several DT techniques have been scrutinized, with CART emerging as the most precise and accurate in terms of accuracy, time, and precision [7].
In a substantial contribution, Das et al. introduced a model known as the expert system for breast cancer prediction. This model employs a decision tree and the Undiluted Feature Set (UFS) algorithm. The UFS, a feature selection model, enhances the accuracy by a seemingly marginal 0.59%, an improvement that can have a substantial impact when applied to a larger population [8]. Maheshwar and Gautam compared different classification models and found that the decision tree worked well with regard to overall accuracy, when applied for breast cancer predictions [9, 10].
Moreover, the Random Forest algorithm can be found to be effective, as it combines different tree prediction methods so that they each depend on the values of a random vector, distributed uniformly across every single tree in a forest [11]. The integration of Random Forest and Support Vector Machines with multivariate time-series information using ultrasonic shear waves opens up new opportunities in the realm of elastic imagery enabling tissues identification, an advanced form of vibroelastography [12].
Anisha et al. [13] leveraged a machine learning technique known as the Random Forest classifier to predict breast cancer. It arranges the data into many trees and obtains an outstanding final accuracy of 98%, even when more parameters such as the physical dimensions of lumps and the stage of breast cancer are included.
Furthermore, Nguyen et al. [14] synergized a random forest approach with choice of features for breast cancer detection and prognosis. By preserving relevant features and removing duplicate information, they attained an average classification accuracy of 99.8%. Dai et al. [15] integrated the characteristics of multiple eigenvalues and combined multiple decision trees to enhance prediction accuracy. Their research focused on breast cancer diagnosis and yielded a high prediction accuracy.
Active learning, when integrating with SVM, can substantially minimize the demand for labelled training cases in both inductive and transudative environments [16]. An SVM proposed for Computer-Aided Detection (CAD) explores how changes perform in periodic vectors of features and kernel procedures affect the SVM's ability to classify malignant and benign DCE-MRI breast lesions [17, 18]. The application of SVMs for CAD of DCE-MRI in breast cancer surveillance has been proposed.
In a notable contribution, Kamel et al. [19] enhanced the effectiveness of SVMs by taking the optimal features via the Gray Wolf algorithm, thereby elevating the performance of breast cancer diagnosis. They used data mining to combine GWO's feature selection method with SVM. Further, Islam et al. [20] predicted breast cancer using SVM and K-Nearest Neighbor supervised machine learning techniques by training these algorithms on relevant attributes.
For various machine learning challenges, Chen and Guestrin proposed XGBoost, a scalable end-to-end boosting method frequently used to generate cutting-edge results, with the capacity to address real-world scale issues with fewer resources [21, 22]. A novel technique subdivides breast masses in mammography into benign, cancerous, and normal masses by combining the classification outcomes based on Deep Convolutional Neural Networks (DCNN) [23].
They demonstrated that the multifaceted model, built around DCNN using transfer learning and using the XGBoost threshold model, generally outperformed the single feature model and achieved higher accuracy. An artificial neural network, coupled with various ultrasonography features, was used to determine the malignancy of breast nodules [24, 25]. Trivedi et al. [26] employed ensemble techniques, which included feature extraction with OTSU Thresholding, Contrast Limited Adaptive Histogram Equalization (CLAHE), and Gray Level Co-occurrence Matrix (GLCM). They found that XGBoost performed more effectively having an accuracy rate of 97.5%.
Mahesh et al. [27] the efficiency of the XGBoost ensemble approach for durability in breast cancer categorization. They used the Synthetic Minority Oversampling Technique to deal with inequalities in classes and noise in data. The results revealed that XGBoost-RF outperformed other ensemble classifiers, achieving an accuracy of 98.20%.
Artificial Neural Networks (ANNs) were trained on breast lump images, achieving a normalized region within the Receiver Operating Characteristics curve of 0.95. Classifiers based on neural networks with Multilayer Perceptron and Radial Basis Function, and SVMs with a variety of kernels were used to identify the existence and categorize breast lesions as benign or malignant [28]. A review of recent developments and applications of ANNs has been presented to advance the research field [29, 30].
Nasien et al. [31] utilized an ANN with backpropagation to solve complicated problems relating to identification and recognizing patterns. Numerical simulations indicated that the system achieved an accuracy of 96.92%.
We have discussed the deep literature of machine learning algorithms. The above-mentioned five methods have shown promising results and could be employed to identify or diagnose with utilizing appropriate datasets.
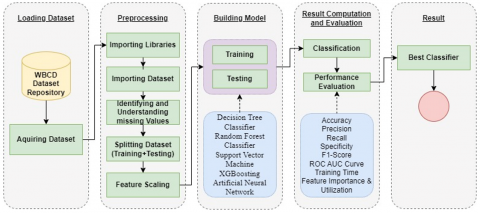
Determining the most precise and reliable algorithm for detecting breast cancer is the major goal of our work. The data analytic algorithm utilised for disease classification, clustering, anomalies and association [32]. To identify and classify breast tumors, we must access computer-assisted diagnostic data [33]. The proposed architecture shown below in the Figure 1. Here we assess the data and apply 5 supervised ML approaches to generate the correct decision using different parameter.
Imaging techniques such as X-ray, MRI, endoscope, ultrasound, and others produce good images but it harms the human body, so images are obtained with less energy, resulting in poor image quality and low contrast. Human computer interaction diagnosis (HCID) is a technique that improves image quality and interpreting mammography images to identify whether it is benign or malignant. Artificial intelligence diagnostic system, which measures the severity of the patient's symptoms and uses a membership function to address the patient's emotions [34]. Some proposed multi-feature disease fusion discrimination technique based on PD R-CNN [35]. As per research of the human breast cancer prognosis, prediction is performed utilizing diseased images and multiple kernel learning [36]. Proposed methodology for human computer interactive diagnosis:
These five steps show the complete process of data classification and evaluation to find best classifier using evaluation parameter.
Figure 1. Proposed architecture
3.1 Dataset acquisition
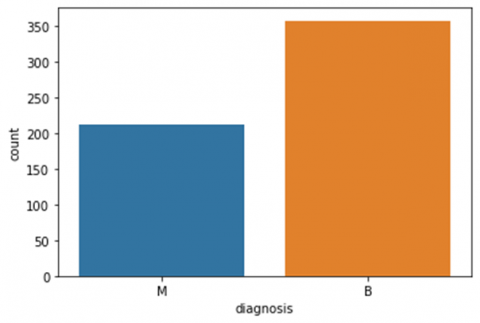
Figure 2. Benign and malignant count
For this analysis, we utilized the WBCD dataset, which computes ten real-valued characteristics from each nucleus cell. The standard error and average of the three biggest results are also obtained for these ten attributes, giving each image a overall of thirty characteristics. The data set include 659 images with a class composition that includes 212 malignant and 357 benign as depicts in Figure 2.
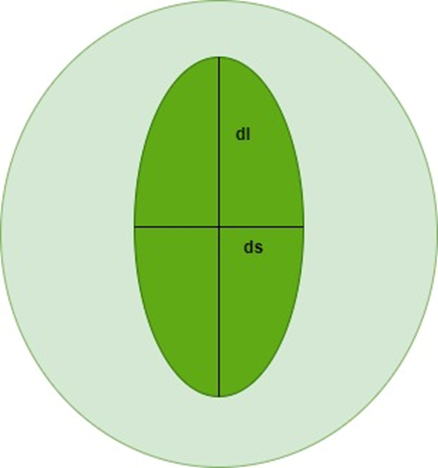
Figure 3. Image analysis
The characteristics of the breast image are calculated using a digital image of a breast mass aspirate taken with a very small needle as shown in Figure 3 [37], this information utilized for assessing either a cancer is benign or malignant, we train the model to classify the dataset using above machine learning techniques.
Figure 3 provides a graphical visualization of a cell, showing the nucleus's long (dl) and short (ds) diameters together with the mathematical calculations for the nucleus's approximative area $\left(A=\frac{\pi d_l d_s}{4}\right)$ and elongation $\left(E=\frac{d_l}{d_s}\right)$ that were derived from those measure [37].
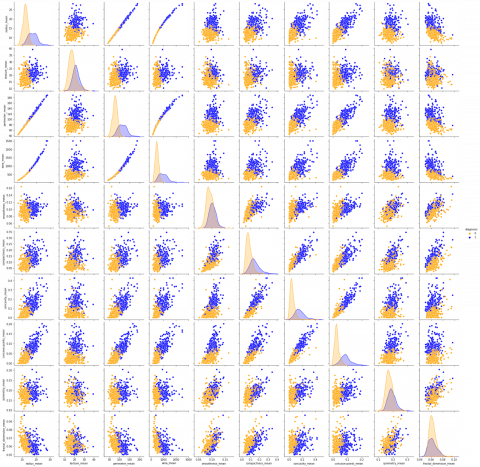
For each nucleus in this data set, the first ten core characteristics with real values are generated using ROI - radius (the mean distance between points on the perimeter and the center), texture (Grayscale value’s standard deviation) perimeter, area, smoothness (varying locally in radius), compactness (perimeter2 / area - 1.0), concavity (severity of the contour's concave regions), concave points (concave regions there in the contour), symmetry, fractal dimension ("coastline approximation" - 1), We compare all ten features as shown in the Figure 4.
Twenty more features have been computed available in data set, ten features are based on mean and ten based on worst values of 10 core features, resulting 30 features for each image. All features describe the nucleus cell depicted in the image. X-ray mammography is used to obtain images.
Figure 4. Comparison of 10 core features
Early detection and medication are the current approaches to this disease. More patients must be discovered early in this disease to enhance survival. As a result, we evaluate current and new breast cancer screening and detection strategies to see where we might make improvements. This paper goes over some of the most regularly used breast cancer prediction supervised ML approaches and dives into emerging modifications [38]. As indicated in Table 1, 70 percent training and thirty percent testing.
Table 1. Training and test data set
|
|
Training |
Testing |
|
|
Benign |
255 |
102 |
357 |
|
Malignant |
143 |
69 |
212 |
|
|
398 |
171 |
569 |
We emphasize the comprehensive study of supervised ML approaches to classify the cancer is benign or malignant. We classify WBCD dataset using above five supervised ML approaches that will used for human computer interactive diagnosis. Some study based on identification of gene that is more correlated worth the prognosis of breast cancer [39]. IDS is implemented using CatBoost Classifier, it is a part of the ML ensemble strategy [40]. In order to improve breast cancer classification, Liew et al. [41] developed Deep Learning and Extreme Gradient Boosting, which divides binary breast cancer histology images into benign and malignant categories (DLXGB). In this era deep learning, mammography is considered computer-assisted detection as a use case for better human-computer interaction [42].
Benign and malignant dataset is to be classified using various machine learning algorithm. We have 10 basic features, each with a standard error and the average of the three greatest values, therefore data will be arranged into thirty features.
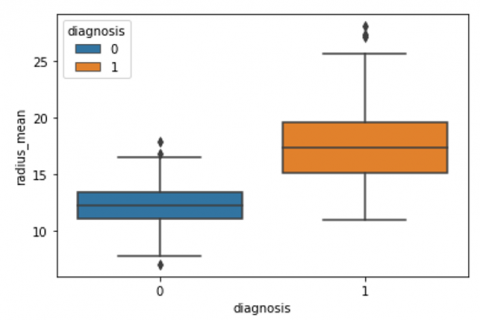
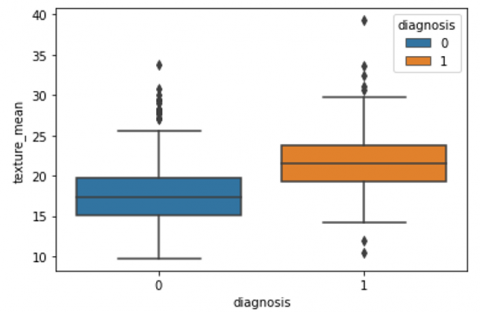
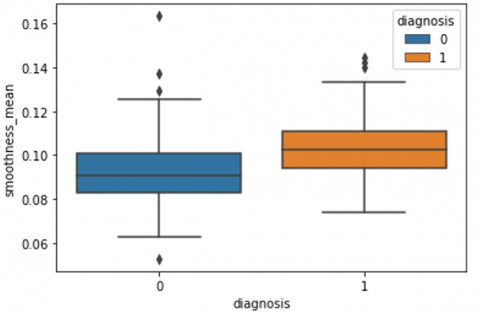
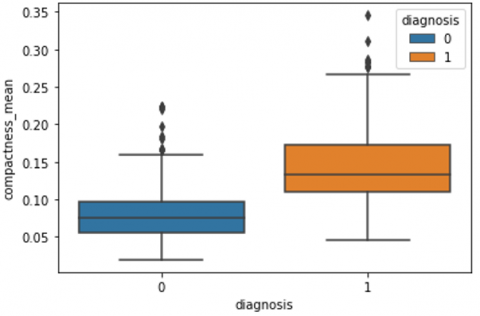
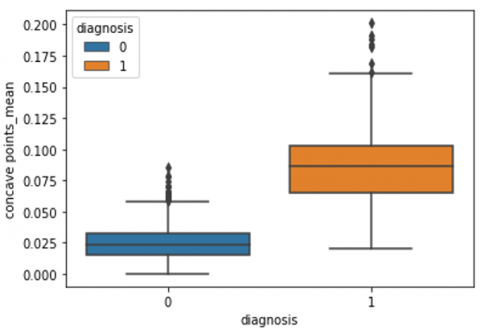
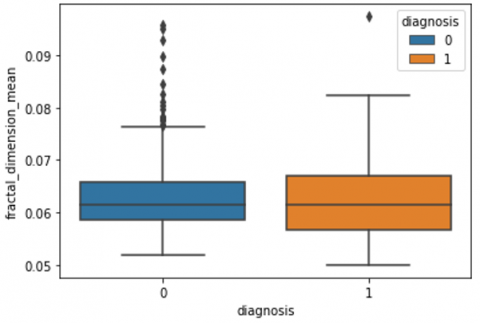
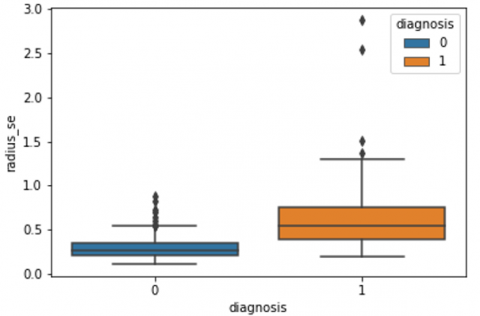
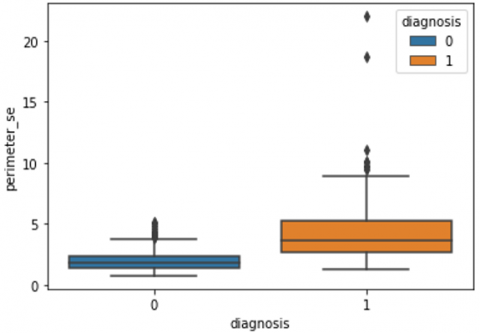
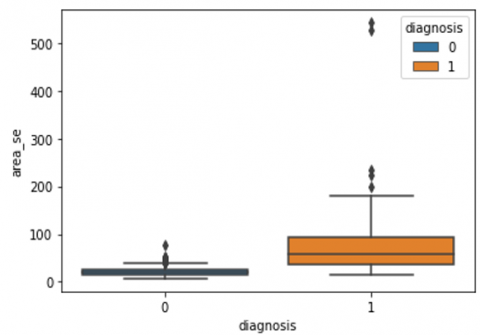
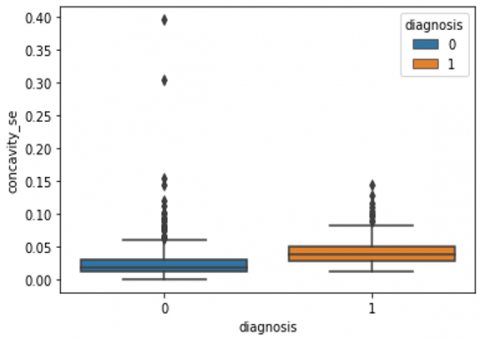
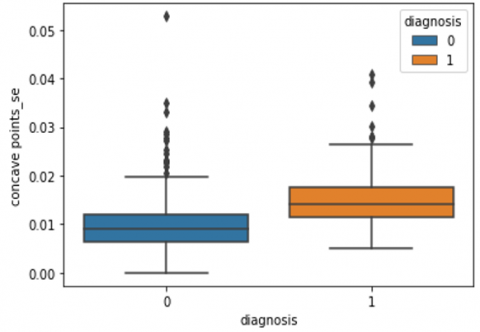
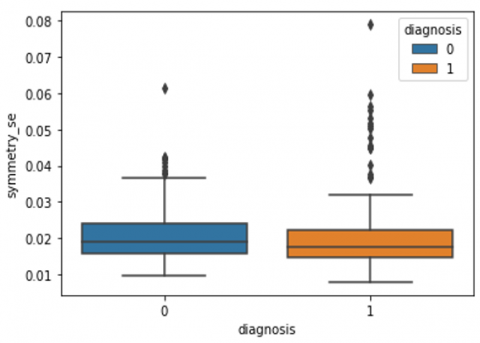
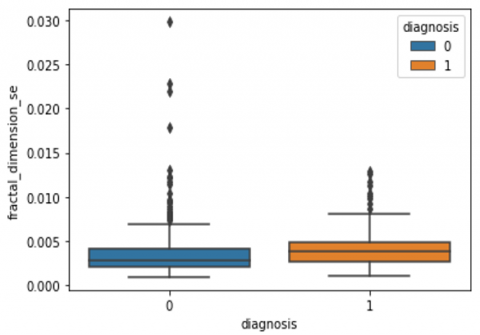
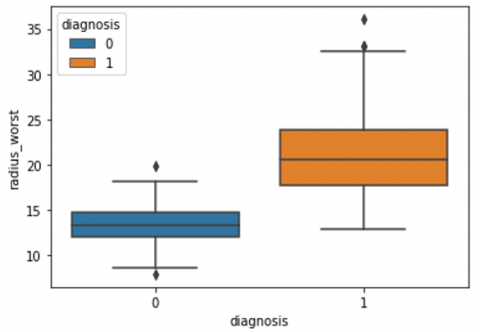
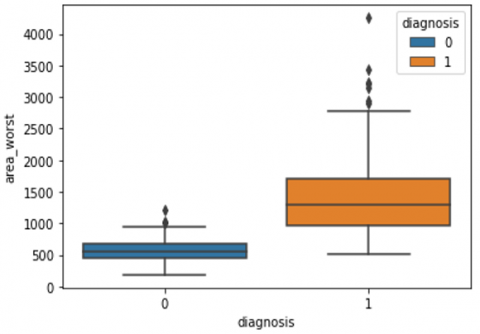
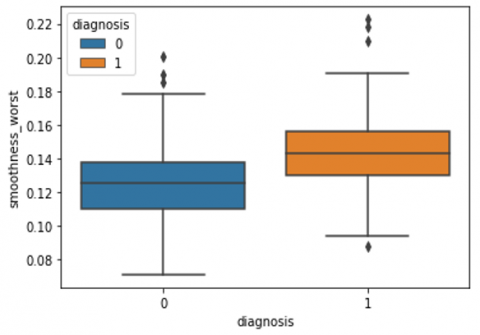
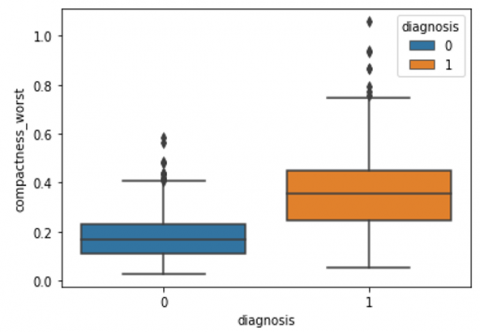
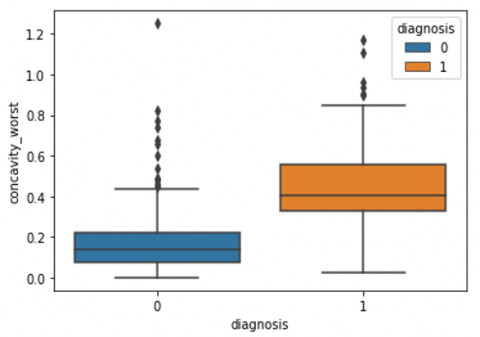
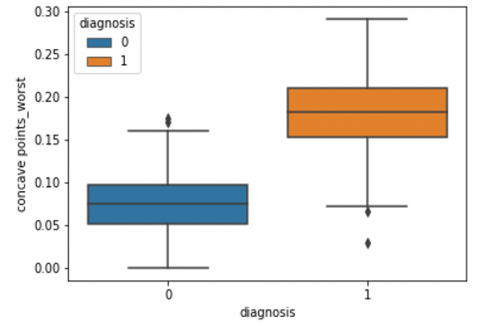
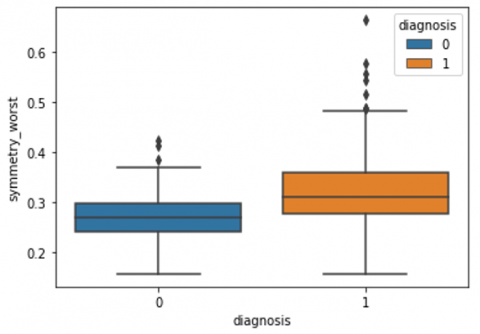
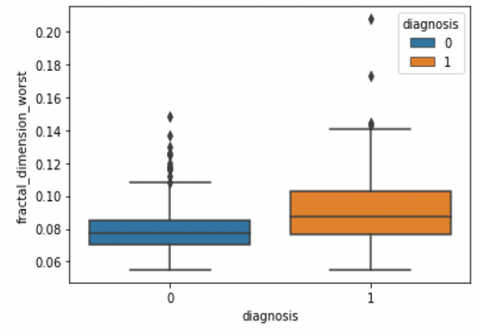
Human-computer interaction is vital for improving and maintaining high-level cancer detection skills. The results revealed that utilizing a low-cost display monitor and a variety of HCI approaches, observers may be trained to distinguish some critical breast cancer appearances. Deep learning applied to a specific clinical application for radiology image processing, which is known as computer-assisted diagnosis (CAD) [42]. To determine which features are helpful for classification, a box plot is used to show the classification. Since the median values for radius mean, perimeter mean, and area mean differ significantly in this instance, these characteristics are important for classifying cancer. However, the box plot of these characteristics is virtually same, thus we may select any feature from these features to decrease the size of the data collection or the computational complexity of the prediction as show in Figure 5. Box plot will show the data for all features having details of lower quartile (25% data below such value), upper quartile (25% data beyond this and 75% of data above this value), median (mid point of data), max denote highest value and min denote the lowest score.
Figure 5. Benign and malignant deviations in all 30 features
3.2 Supervised machine learning algorithms
Machine learning techniques applied for WBCD dataset are:
1. Decision tree classifiers provide a training model that predicts the category or value of the target variable using past data and basic decision criteria. The detailed approach to the decision tree, compare most used algorithm in decision tree, and found that decision approach had the highest accuracy in all other studies [43]. Decision tree is trained on default value of criterion that is gini which is the measure of purity and impurity while producing a decision tree using the CART technique. Gini index reduce the impurities through the root to the leafy nodes of a decision tree model.
2. A meta estimator called the random forest classifier fits a variety of decision trees to diverse dataset subsamples, improving prediction accuracy and reducing overfitting. A survey and future research directions, present the result for improvement in accuracy by using different split measures and combining functions [44]. The Number of trees are estimated with a default value 100. The working procedure can be outlined in the following steps:
3. To efficiently categorize newly data points in future, support vector machines build the ideal decision boundary or line that separates an n-dimensional space into classes. A hyperplane is the optimal decision boundary, many applications built around SVM summarized challenges and trends, SVM has been utilized in numerous academic disciplines, including face recognition, text categorization, image classification, and handwritten character recognition, they find that SVM is not so popular when the data set is so large data set require huge training time and accuracy will become poor. So, it is enough for small data sets [45, 46]. Radial Basis Function (RBF) kernel is a prominent kernel function associated with SVM machine learning. It is a nonlinear kernel function that transfers the input data into a higher dimensional input domain using a Gaussian function. The guassian kernel is expressed as $\exp \left(-\gamma\left\|x-x^{\prime}\right\|^2\right)$ where $\gamma$ is specified by parameter gamma, must be greater than 0. $\left\|\mathrm{x}-\mathrm{x}^{\prime}\right\|^2$ is squared Euclidean distance across the supplied vectors.
4. Extreme gradient boosting is a scalable machine learning approach that uses a distributed gradient-boosted decision tree. It offers concurrent tree boosting. It is a random forest-inspired decision tree ensemble learning algorithm. A power system transient stability prediction approach based on XGBoost makes predictions about stability depending on particular operating scenario features [47, 48]. The gradient boosting ensemble technique consist of three simple steps.
$F_1(x)<-F_0(x)+h_1(x)$
To increase F1's performance, we could model after its residual and develop a new model F2:
$F_2(x)<-F_1(x)+h_2(x)$
This procedure can be performed m times until the residual is as small as desirable:
$F_m(x)<-F_{m-1}(x)+h_m(x)$
The active learner does not interfere with the preceding steps' functions, Individuals instead provide their own information to reduce inaccuracies.
5. A computing network called an artificial neural network is frequently modelled on the biological neural networks that give the structure of human brain. It has neurons that are interconnected through several network levels. The most recent developments are formed of biological neurons, a network of linked nodes that resemble the neurons in a biological brain. Neural networks are quite helpful when working with enormous data sets [29, 49]. To predict the breast cancer artificial neural network has been trained with in 100 epoch with 32 batch size. The model has been compile using adam optimizer and binary_crossentropy loss function.
We find the number of features utilized for each machine learning technique. We have 30 features, sorted index is calculated for each feature used for all five machine learning techniques. We extract 5 most usable features for machine learning technique.
After introducing a machine learning algorithm towards the WBCD dataset, we evaluate the cancer prediction by optimize the count of benign and malignant category using confusion matrix from predicted models. A review for the digital pathological images based on deep learning framework which is use for pre and post image processing technique [50].
Accuracy, which is defined as, referred to as the ratio of successfully predicted observations to all observations, is the most fundamental performance metric. If our model has a high level of accuracy and utilized maximum features, it is assumed as the best model. Accuracy will measure on basis of actual class and predicted class we have four categories of values that is true positive (TP), true negative (TN), false positive (FP) and false negative (FN).
$A C C U R A C Y=\frac{T P+T N}{T P+F P+F N+T N}$ (1)
The precision ratio is described as the proportion of positively imagined observations that were perfectly predicted compared to all projected observations. Precision is connected with low FP rates.
$PRECISION =\frac{T P}{T P+F P}$ (2)
Recall is the proportion of accurately predicted observations to the total observations in the class. The model will benefit if it is higher than 0.5.
$R E C A L L=\frac{T P}{T P+F N}$ (3)
The model's specificity is expressed as the fraction of TN detected properly. Because they were initially misinterpreted as positive outcomes, actual negatives—also known as false positives—will rise in number as a result. This ratio is also known as a TNR. The sum of the FPR and the specificity (actual negative rate) would always be one. While a model with low specificity may incorrectly classify many negative results as positive, one with high specificity will properly identify the vast majority of negative outcomes.
$S P E C I F I C I T Y=\frac{T N}{T N+F P}$ (4)
The F1 score is a precision and recall weighted average that includes both FP and FN into consideration. F1 is frequently more valuable than accuracy in situations when there is an unequal distribution of classes. Accuracy performs best when the cost of a FP and FN is similar.
$F 1 S C O R E=\frac{2 *(\text { RECALL } * \text { PRECISION })}{\text { RECALL }+ \text { PRICISION }}$ (5)
The Receiver Operator Characteristic (ROC) curve is a tool for measuring the quality of binary classification issues. To separate the "signal" from the "noise", comparing the TPR and FPR at various boundary levels, it is a probability curve. The ROC curve's summarize statistic, the AUC, measures a classifier's ability to make distinctions within classes.
From the results of the training set, Table 2 and Figure 6 indicate the accuracy for WBCD dataset. We can observe that all the classifiers have various accuracy levels, but SVM consistently outperforms other classifiers (97.66%).
Figure 6. Comparative graph for different classifier accuracy
Table 2. Accuracy percentage for WBCD dataset
|
Algorithm |
Accuracy (%) |
|
DT Classifier |
94.15 |
|
RF Classifier |
95.32 |
|
SVM |
97.66 |
|
XGBoosting |
95.91 |
|
ANN |
97.07 |
Human computer interactive diagnosis is used to enhance the early detection of cancer. HCID will switch to self-diagnose as per symptoms find. That system will helpful in future for early diagnose, and improve the patient survival and save the life. Some futuristic approach has given that will used to improve the detection approach like breath biopsy that helps to analyze breathe sample to stratify bio markers, mammary ductoscopy is a procedure that involves inserting a tiny endoscope into the breast milk ducts to enable for observation of the ductal epithelial lining and cell recovery [51]. A review on digital image-based shows AI technologies for diagnose of skin cancer [52].
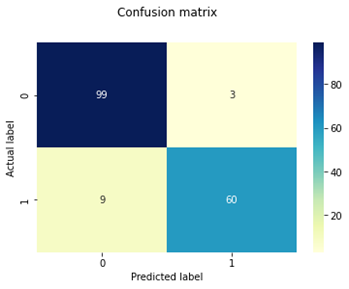
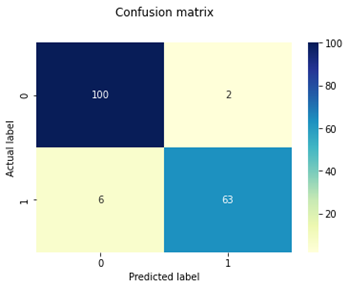
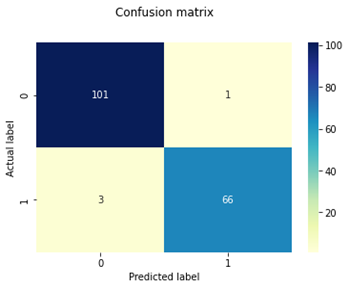
Table 3. Confusion matrix statistics for classifiers
|
Classifier |
Confusion Matrix |
|
DT Classifier |
|
|
RF Classifier |
|
|
SVM |
|
|
XGBoosting |
|
|
ANN |
Table 3 represents the classifier and its obtained confusion matrix for testing the dataset on all classifiers because confusion matrices are a good tool for evaluating the classifier. The classification model's generated performance metrics accuracy, recall, and specificity for benign and malignant diseases are shown in Table 4.
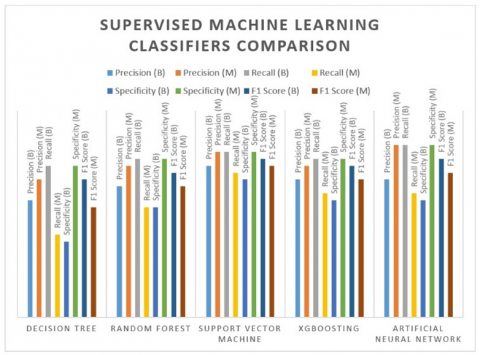
As shown in Table 3 confusion matrix demonstrates that SVM correctly predicts all 167 test cases out of 171 total, including 101 benign instances that are genuinely benign 101 benign instances are genuinely benign, while 66 instances that are malignant are actually malignant. There were 4 cases where SVM incorrectly predicted cases, including 1 benign class case that was misclassified as malignant and 3 malignant class cases that were misclassified as benign. Therefore, support vector machine’s accuracy is preferable to that of other categorization techniques. As per the result of Table 4 SVM has higher average percentage of precision (), recall (), specificity () and f1-score () for both classes than other classifiers. SVM outclass than other classifier in performance of WBCD dataset cancer classification.
Table 4. Interpretation of performance measure
|
Algorithm |
Precision |
Recall |
Specificity |
F1 Score |
Class |
|
DT Classifier |
0.92 |
0.97 |
0.86 |
0.95 |
B |
|
0.95 |
0.87 |
0.97 |
0.91 |
M |
|
|
RF Classifier |
0.94 |
0.98 |
0.91 |
0.96 |
B |
|
0.97 |
0.91 |
0.98 |
0.94 |
M |
|
|
SVM |
0.97 |
0.99 |
0.95 |
0.98 |
B |
|
0.99 |
0.96 |
0.99 |
0.97 |
M |
|
|
XGBoosting |
0.95 |
0.98 |
0.92 |
0.97 |
B |
|
0.97 |
0.93 |
0.98 |
0.95 |
M |
|
|
ANN |
0.95 |
1.00 |
0.92 |
0.98 |
B |
|
1.00 |
0.93 |
1.00 |
0.96 |
M |
Figure 7. Classifier comparisons
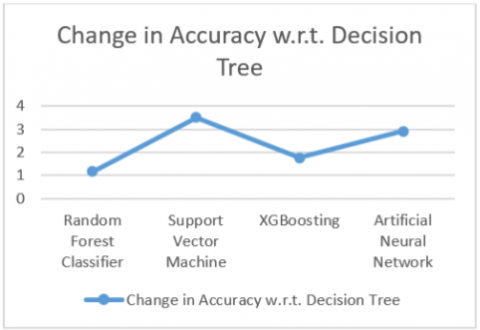
Table 5. Accuracy change table with respect to decision tree
|
Algorithm |
Change Accuracy w. r. t. Decision Tree Accuracy Testing Set (%) |
|
RF Classifier |
1.17 |
|
SVM |
3.51 |
|
XGBoosting |
1.76 |
|
ANN |
2.92 |
Figure 7 shows a comparison of supervised machine learning techniques. Table 5 and Figure 8 show the accuracy change with respect to decision tree having low accuracy, SVM shows that the change outclass as compare to another classifier.
Figure 8. Change in accuracy w.r.t. decision tree
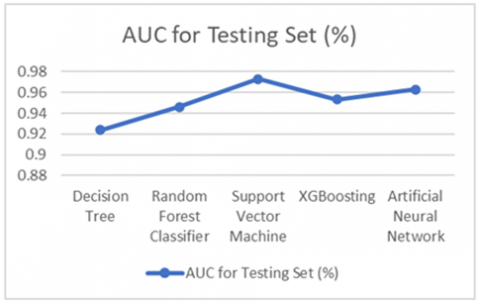
Figure 9. ROC AUC curve area comparison
Figure 9 displays the ROC curve for each machine learning approach. The effectiveness of classifiers is largely determined by the ROC curve. The area beneath the ROC curve is determined AUC. The classifier works better when the region is greater. The SVM has the best AUC score (0.973), whereas the decision tree has the fewest (0.924), as shown in Table 6.
Table 6. The area under ROC curve (AUC)
|
Algorithm |
AUC for Testing Set (%) |
|
DT Classifier |
0.924 |
|
RF Classifier |
0.946 |
|
SVM |
0.973 |
|
XGBoosting |
0.953 |
|
ANN |
0.963 |
Table 7. Training time
|
Algorithm |
Training Time |
|
DT Classifier |
0.015 |
|
RF Classifier |
0.109 |
|
SVM |
0.010 |
|
XGBoosting |
0.094 |
|
ANN |
1.84(100 Epoch) |
Table 7 displays the training time for each of the classifiers and SVM take very less time as compared to other classifiers, ANN takes higher time due to 100 epochs.
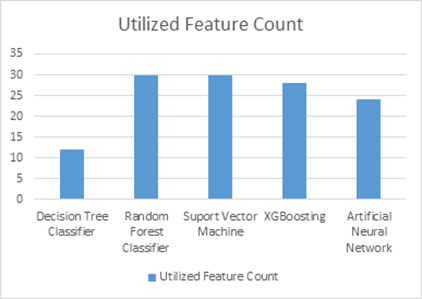
We select best classifier having higher accuracy (97.66%) with utilizing all features as shown in Table 8 and Figure 10.
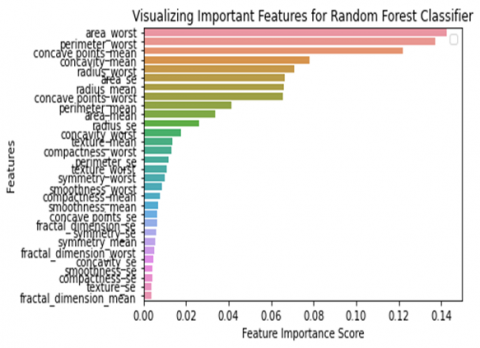
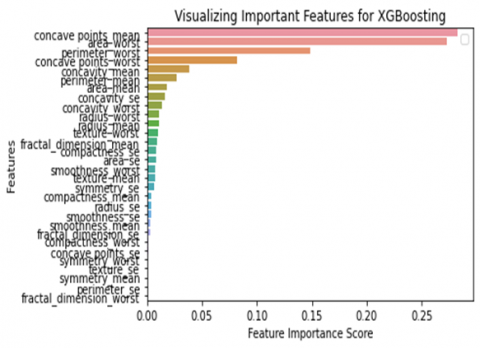
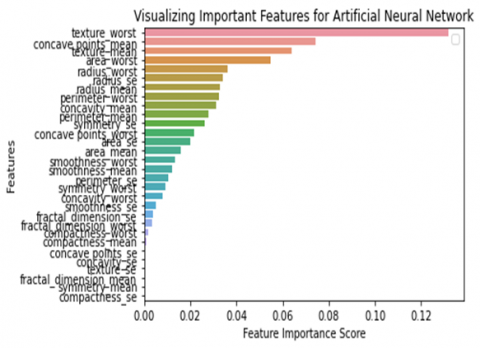
Table 9 shows that the feature importance for all features of breast cancer Wisconsin diagnosis data set for all classifiers. Here importance of each feature is in sorted order for all classifiers. We can find here the top 5 features having higher importance.
Table 8. Feature utilization for machine learning technique
|
Machine Learning Technique |
Utilized Feature Count |
|
DT Classifier |
12 |
|
RF Classifier |
30 |
|
SVM |
30 |
|
XGBoosting |
28 |
|
ANN |
24 |
Figure 10. Feature utilization
Table 9. Feature importance for classifiers
|
Classifier |
Feature Importance |
Top 5 Features |
|
DT Classifier |
|
|
|
RF Classifier |
|
|
|
SVM |
|
|
|
XGBoosting |
|
|
|
ANN |
|
Figure 11. Feature utilization
Figure 11 shows over all importance of all features for classifiers, area worst, perimeter worst, texture worst, concave points worst, and concave points mean are common features in all classifiers that perform well. Till now SVM perform well in all aspects, in future aspects if we use features having high importance than we achieve accuracy up to 100%.
Some features having more importance should be find from other dataset with inclusion of these features system performance will be upgraded that achieve in future. This study limited to WBCD dataset it can include MRI, US and mammogram image dataset to detect best features.
In this work supervised machine learning algorithms – DT, RF, SVM, XGBoosting and ANN are used to classify breast cancer. A well-organized comparative analysis is introduced with performance metrics accuracy, precision, recall, F1 score and specificity from classification of WBCD dataset. This study also introduced the feature importance and utilization for all features available in above data set to determine the most accurate, precise, and efficient machine learning algorithm. All algorithm has been implemented in the anaconda environment with the scikit-learn package in python. After accurate comparison among the models, we found that SVM utilized all features and achieved higher accuracy of 97.66%. Precision, recall, specificity and F1 score evaluation matrix for SVM shows better result as compare to other classifier. SVM take less time and area under curve is bigger than other classifier. In conclusion, SVM exhibit effectiveness in predicting and diagnosing breast cancer and reach optimal performance through the use of performance measures. It reveals that this technique is applied exclusively on the WBCD dataset, the dataset based on technique like MRI, mammograms and US can used for future to work it is required to use the same procedure and approaches on other databases to validate them. On larger data sets with more classes, we can apply various machine learning algorithms with additional parameters to increase accuracy.
[1] Bansal, H., Khan, R. (2018). A review paper on human computer interaction. International Journal of Advanced Research in Computer Science and Software Engineering, 8: 53-56. https://doi.org/10.23956/ijarcsse.v8i4.630
[2] Paton, C., Kushniruk, A.W., Borycki, E.M., English, M., Warren, J. (2021). Improving the usability and safety of digital health systems: The role of predictive human-computer interaction modeling. Journal of Medical Internet Research, 23(5): e25281. https://doi.org/10.2196/25281
[3] Fu, Q., Lv, J. (2020). Research on application of cognitive-driven human-computer interaction. American Academic Scientific Research Journal for Engineering, Technology, and Sciences, 64(1): 9-27.
[4] O'Brien, H.L., Roll, I., Kampen, A., Davoudi, N. (2021). Rethinking (Dis)engagement in human-computer interaction. Computers in Human Behavior, 128: 107109. https://10.1016/j.chb.2021.107109
[5] Sarmento, R. (2019). Breast cancer wisconsin (diagnostic) data set. https://doi.org/10.13140/RG.2.2.24243.99364
[6] Yi, L., Yi, W. (2017). Decision tree model in the diagnosis of breast cancer. 2017 International Conference on Computer Technology, Electronics and Communication (ICCTEC), Dalian, China, pp. 176-179. https://doi.org/10.1109/ICCTEC.2017.00046
[7] Patel, H., Prajapati, P. (2018). Study and analysis of decision tree based classification algorithms. International Journal of Computer Sciences and Engineering, 6(10): 74-78. https://doi.org/10.26438/ijcse/v6i10.7478
[8] Das, A.K., Biswas, S.K., Mandal, A. (2022). An Expert System for Breast Cancer Prediction (ESBCP) using decision tree. Indian Journal of Science and Technology, 15(45): 2441-2450. https://doi.org/10.17485/IJST/v15i45.756
[9] Maheshwar, Kumar, G. (2019). Breast cancer detection using decision tree, Naïve Bayes, KNN and SVM classifiers: A comparative study. 2019 International Conference on Smart Systems and Inventive Technology (ICSSIT), Tirunelveli, India, pp. 683-686. https://doi.org/10.1109/ICSSIT46314.2019.8987778
[10] Tarawneh, O., Otair, M., Husni, M., Abuaddous, H.Y., Tarawneh, M., Almomani, M.A. (2022). Breast cancer classification using decision tree algorithms. International Journal of Advanced Computer Science and Applications, 13(4): 676-680. http://dx.doi.org/10.14569/IJACSA.2022.0130478
[11] Breiman, L. (2001). Random forests. Machine Learning, 45:5-32. https://doi.org/10.1023/A:1010933404324
[12] Shao, Y., Hashemi, H.S., Gordon, P., Warren, L., Wang, J., Rohling, R., Salcudean, S. (2022). Breast cancer detection using multimodal time series features from ultrasound shear wave absolute vibro-elastography. IEEE Journal of Biomedical and Health Informatics, 26(2): 704-714. https://doi.org/10.1109/JBHI.2021.3103676
[13] Anisha, P.R., Reddy, C.K.K., Apoorva, K., Mangipudi, C.M. (2021). Early diagnosis of breast cancer prediction using random forest classifier. IOP Conference Series: Materials Science and Engineering, 1116l: 012187. https://doi.org/10.1088/1757-899X/1116/1/012187
[14] Nguyen, C., Wang, Y., Nguyen, H. (2013). Random forest classifier combined with feature selection for breast cancer diagnosis and prognostic. Journal of Biomedical Science and Engineering, 6(5): 551-560. https://doi.org/10.4236/jbise.2013.65070
[15] Dai, B., Chen, R.C., Zhu, S.Z., Zhang, W.W. (2018) Using random forest algorithm for breast cancer diagnosis. 2018 International Symposium on Computer, Consumer and Control (IS3C), Taichung, Taiwan, pp. 449-452. https://doi.org/10.1109/IS3C.2018.00119
[16] Tong, S., Koller, D. (2001). Support vector machine active learning with applications to text classification. Journal of Machine Learning Research, 2: 45-66.
[17] Levman, J., Leung, T., Causer, P., Plewes, D., Martel, A.L. (2008). Classification of dynamic contrast-enhanced magnetic resonance breast lesions by support vector machines. IEEE Transactions on Medical Imaging, 27(5): 688-696. https://doi.org/10.1109/TMI.2008.916959
[18] Kumar, A., Tewari, N., Kumar, R. (2021). Study towards the analytic approach for human computer interaction using machine learning. The International Journal of Analytical and Experimental Modal Analysis.
[19] Kamel, S.R., YaghoubZadeh, R., Kheirabadi, M. (2019). Improving the performance of support-vector machine by selecting the best features by Gray Wolf algorithm to increase the accuracy of diagnosis of breast cancer. Journal of Big Data, 6: 90. https://doi.org/10.1186/s40537-019-0247-7
[20] Islam, M.M., Iqbal, H., Haque M.R., Hasan, M.K. (2017). Prediction of breast cancer using support vector machine and K-Nearest neighbors. 2017 IEEE Region 10 Humanitarian Technology Conference (R10-HTC), Dhaka, Bangladesh, pp. 226-229. https://doi.org/10.1109/R10-HTC.2017.8288944
[21] Chen, T., Carlos, G. (2016). Xgboost: A scalable tree boosting system. KDD '16: Proceedings of the 22nd ACM SIGKDD International Conference on Knowledge Discovery and Data Mining, pp. 785-794. https://doi.org/10.1145/2939672.2939785
[22] Malik, S., Harode, R., Singh, A. (2020). XGBoost: A deep dive into boosting (introduction documentation). Simon Fraser University: Burnaby, BC, Canada. https://doi.org/10.13140/RG.2.2.15243.64803
[23] Song, R., Li, T., Wang, Y. (2020). Mammographic classification based on XGBoost and DCNN with multi features. IEEE Access, 8: 75011-75021. https://doi.org/10.1109/ACCESS.2020.2986546
[24] Joo, S., Yang, Y.S., Moon, W.K., Kim, H.C. (2004). Computer-aided diagnosis of solid breast nodules: Use of an artificial neural network based on multiple sonographic features. IEEE Transactions on Medical Imaging, 23(10): 1292-1300. https://doi.org/10.1109/TMI.2004.834617
[25] Kumar, A., Tewari, N., Kumar., R. (2022). A comparative study of various techniques of image segmentation for the identification of hand gesture used to guide the slide show navigation. Multimedia Tools and Applications, 81: 14503-14515. https://doi.org/10.1007/s11042-022-12203-9
[26] Trivedi, A., Sheth, U., Sawant, V., Nimje, V., Malhotra, A. (2022). Breast cancer detection using ensemble techniques. International Journal of Creative Research Thoughts (IJCRT), 10(4): b159-b166.
[27] Mahesh, T.R., Kumar, V.V., Muthukumaran, V., Shashikala, H.K., Swapna, B., Guluwadi, S. (2022). Performance analysis of XGBoost ensemble methods for survivability with the classification of breast cancer. Journal of Sensors, 2022: 4649510. https://doi.org/10.1155/2022/4649510
[28] Cruz, T.N., Cruz, T.M., Santos, W.P. (2018). Detection and classification of mammary lesions using artificial neural networks and morphological wavelets. IEEE Latin America Transactions, 16(3): 926-932. https://doi.org/10.1109/TLA.2018.8358675
[29] Dastres, R., Soori, M. (2021). Artificial neural network systems. International Journal of Imaging and Robotics, 21(2): 13-25.
[30] Nosova, S.A., Turlapov, V.E. (2019). Detection of brain cells in optical microscopy based on textural features with machine learning methods. Program Comput Soft, 45: 171-179. https://doi.org/10.1134/S0361768819040054
[31] Nasien, D., Enjeslina, V., Adiya, M.H., Baharum, Z. (2022). Breast cancer prediction using artificial neural networks back propagation method. Journal of Physics: Conference Series, 2319(1): 012025. https://doi.org/10.1088/1742-6596/2319/1/012025
[32] Razzak, M.I., Imran, M., Xu, G. (2020). Big data analytics for preventive medicine. Neural Computing and Applications, 32: 4417-4451. https://doi.org/10.1007/s00521-019-04095-y
[33] Huang, Q., Huang, X., Liu, L., Lin, Y., Long, X., Li, X. (2018). A case-oriented web-based training system for breast cancer diagnosis. Computer Methods and Programs in Biomedicine, 156: 73-83. https://doi.org/10.1016/j.cmpb.2017.12.028
[34] Das, S., Sanyal, M.K. (2020). Machine intelligent diagnostic system (MIDs): An instance of medical diagnosis of tuberculosis. Neural Computing and Applications, 32: 15585-15595. https://doi.org/10.1007/s00521-020-04894-8
[35] Hua, S., Xu, M., Xu, Z. (2021). Multi-feature decision fusion algorithm for disease detection on crop surface based on machine vision. Neural Computing and Applications, 34: 9471-9484. https://doi.org/10.1007/s00521-021-06388-7
[36] Sun, D., Li, A., Tang, B., Wang, M. (2018). Integrating genomic data and pathological images to effectively predict breast cancer clinical outcome. Computer Methods and Programs in Biomedicine, 161: 45-53. https://doi.org/10.1016/j.cmpb.2018.04.008
[37] Chain, K., Legesse, T., Heath, J.E., Staats, P.N. (2019). Digital image‐assisted quantitative nuclear analysis improves diagnostic accuracy of thyroid fine‐needle aspiration cytology. Cancer Cytopathology, 127(8): 501-513. https://doi.org/10.1002/cncy.22120.
[38] Nover, A.B., Jagtap, S., Anjum, W., Yegingil, H., Shih, W.Y., Shih, H., Brooks, A.D. (2009). Modern breast cancer detection: A technological review. International Journal of Biomedical Imaging, 2009: 902326. https://doi.org/10.1155/2009/902326
[39] Radha, R., Rajendiran, P. (2014). Using K-means clustering technique to study of breast cancer. 2014 World Congress on Computing and Communication Technologies, Trichirappalli, India, pp. 211-214. https://doi.org/10.1109/WCCCT.2014.64
[40] Bhati, N.S., Khari, M.A. (2021). New intrusion detection scheme using CatBoost classifier. In: Ever E., Al-Turjman F. (eds) Forthcoming Networks and Sustainability in the IoT Era. FoNeS-IoT 2020. Lecture Notes of the Institute for Computer Sciences, Social Informatics and Telecommunications Engineering, 353. Springer, Cham. https://doi.org/10.1007/978-3-030-69431-9_13
[41] Liew, X.Y., Hameed, N., Clos, J. (2021). An investigation of XGBoost-based algorithm for breast cancer classification. Machine Learning with Applications, 6: 100154. https://doi.org/10.1016/j.mlwa.2021.100154
[42] Nishikawa, R.M., Bae, K.T. (2018). Importance of better human-computer interaction in the era of deep learning: Mammography computer-aided diagnosis as a use case. Journal of the American College of Radiology, 15(1): 49-52. https://doi.org/10.1016/j.jacr.2017.08.027
[43] Jijo, B., Abdulazeez, A.M. (2021). Classification based on decision tree algorithm for machine learning. Journal of Applied Science and Technology Trends, 2(1): 20-28. https://doi.org/10.38094/jastt20165
[44] Bernard, S., Heutte, L., Adam, S. (2013). Random forest classifiers: A survey and future research directions. International Journal of Advanced Computing, 36(1): 1144-1153.
[45] Cervantes, J., Garcia-Lamont, F., Rodríguez-Mazahua, L., Lopez, A. (2020). A comprehensive survey on support vector machine classification: Applications, challenges and trends. Neurocomputing, 408: 189-215. https://doi.org/10.1016/j.neucom.2019.10.118
[46] Vijayashree, J., Sultana, H.P. (2018). A machine learning framework for feature selection in heart disease classification using improved particle swarm optimization with support vector machine classifier. Programming and Computer Software, 44: 388-397. https://doi.org/10.1134/S0361768818060129
[47] Chen, M., Liu, Q., Chen, S., Liu, Y., Zhang, C.H., Liu, R. (2019). XGBoost-based algorithm interpretation and application on post-fault transient stability status prediction of power system. IEEE Access, 7: 13149-13158. https://doi.org/10.1109/ACCESS.2019.2893448
[48] Vychegzhanin, S.V., Kotelnikov, E.V. (2019). Stance detection based on ensembles of classifiers. Programming and Computer Software, 45: 228-240. https://doi.org/10.1134/S0361768819050074
[49] Gupta, V., Mishra, V.K., Singhal P., Kumar, A. (2022). An overview of supervised machine learning algorithm. 2022 11th International Conference on System Modeling & Advancement in Research Trends (SMART), Moradabad, India, pp. 87-92. https://doi.org/10.1109/SMART55829.2022.10047618
[50] Salvi, M., Acharya, U.R., Molinari, F., Meiburger, K.M. (2021). The impact of pre- and post-image processing techniques on deep learning frameworks: A comprehensive review for digital pathology image analysis. Computers in Biology and Medicine, 128: 104129. https://doi.org/10.1016/j.compbiomed.2020.104129
[51] Mishra, J., Kumar, B., Targhotra, M., Sahoo, P.K. (2020). Advanced and futuristic approaches for breast cancer diagnosis. Future Journal of Pharmaceutical Sciences, 6: 106. https://doi.org/10.1186/s43094-020-00113-2
[52] Goyal, M., Knackstedt, T., Yan, S., Hassanpour, S. (2020). Artificial intelligence-based image classification methods for diagnosis of skin cancer: Challenges and opportunities. Computers in Biology and Medicine, 127: 104065. https://doi.org/10.1016/j.compbiomed.2020.104065