Jie Yan*![]() | Na Wang
| Na Wang![]() | Yiming Wei
| Yiming Wei![]() | Menglu Han
| Menglu Han![]()
© 2023 IIETA. This article is published by IIETA and is licensed under the CC BY 4.0 license (http://creativecommons.org/licenses/by/4.0/).
OPEN ACCESS
The development of online education has driven a profound transformation in the teaching mode of vocational education, with the generation of personalized learning paths as one of the key factors in improving the learning effectiveness of learners. However, current online learning platforms still face a series of challenges in personalized teaching practices. Especially in terms of accurately capturing and understanding learner behavior and emotions, existing systems have not fully met the personalized learning needs of learners. This study aims to explore a novel mechanism for generating personalized learning paths for learners through image recognition technology. Firstly, by combining migration learning and dual stream convolutional networks, this study proposes a recognition method that can adapt to the behavioral characteristics of different groups of learners. Secondly, using graph convolutional neural networks (GCNNs) for deep recognition of learner micro-expressions to accurately capture the learner's emotional state, making the generation of learning paths more detailed and adaptable. This study addresses the shortcomings of existing systems in processing multimodal data integration and real-time feedback dynamic adaptation, and improves the accuracy and practicality of personalized learning path generation for learners. The research results not only promote the progress of personalized learning path generation in online education for learners technically, but also provide learners with a more customized learning experience.
online education, personalized learning paths, image recognition, transfer learning, micro-expression recognition
Vocational colleges are an important way to cultivate high-quality and highly skilled talents that meet the needs of social development, and are an important component of the lifelong education system. With the booming development of online education and the continuous progress of artificial intelligence technology, in order to meet the learning habits and needs of students, industries, and social learners, the education and teaching models of vocational colleges are also constantly being updated, transforming from traditional offline training to a combination of online and offline or pure online training. The teaching quality and effectiveness of online education have always been a focus of attention in vocational colleges, among which the research on personalized learning paths for learners has become one of the key to improving teaching effectiveness. Traditional online learning systems typically adopt a static course structure, ignoring individual differences and dynamic learning needs among learners. Building a system that can identify learner behavior and emotional states and provide individualized learning paths is therefore very crucial [1-6]. The identification and analysis of learner features is greatly aided by image recognition, a significant area of artificial intelligence [7, 8]. Related study is important because it helps understand learners' requirements and learning status more precisely by analyzing their learning behavior and micro-expressions in detail [9-11]. Dual stream convolutional networks can efficiently process time series data and precisely identify learner behavior patterns, whereas migration learning can assist systems in fast adapting to new learner groups [12-14]. In addition, GCNNs are an effective tool for deciphering and examining learner micro-expressions due to their advantages in processing non-Euclidean data structures. The development of mechanisms for creating tailored learning paths will be considerably aided by the integration of these technologies [15, 16].
Nonetheless, there are still issues with current study methodologies. Utilizing the rich information included in video data is challenging because, on the one hand, current systems frequently lack efficient integration procedures when processing multimodal data [17-19]. However, the development of learning paths frequently relies too much on preset guidelines and lacks the dynamic flexibility needed to respond quickly to learners' feedback. Such a shortfall hinders the depth and precision of personalized learning paths.
This paper focuses on the exploration of a novel mechanism for generating personalized learning paths tailored to the needs of learners in vocational colleges. The core research is bifurcated into two segments: the first involves the formulation of a method for recognizing learner group behavior, amalgamating transfer learning with dual-stream convolutional networks, thereby enhancing suitability for varied learner characteristics. The second part focuses on using GCNNs to recognize complex micro-expressions, which allows for a more thorough recording of learners' emotional fluctuations. In addition to improving the understanding of learner behaviors and emotional states in online learning environments, the suggested mechanism makes it easier for learning paths and content to be dynamically adjusted in response to real-time input, resulting in more individualized training. It is expected that this research would significantly enhance the field of online education technology by offering vocational institutions' online learners more sophisticated, tailored learning experiences.
Within the context of online education, the implementation of group behavior recognition, predicated on image processing, is instrumental in the construction of mechanisms for generating personalized learning paths. This recognition mechanism provides an intuitive and dynamic way to understand learners' learning attitudes, engagement, and responses by capturing and analyzing their visual behavior data, enabling the teaching system to more accurately adjust teaching content and pace to meet the specific needs of different learners. For example, by monitoring the attention distribution of learners, the system can determine whether they understand the current teaching content or feel confused and uneasy.
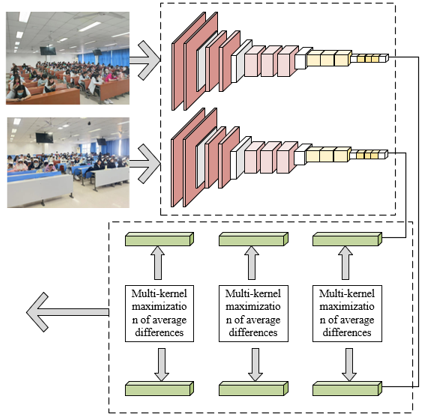
A method is proposed, amalgamating transfer learning with dual-stream convolutional networks, for the recognition of group behavior among learners in vocational college online education. Figure 1 depicts the structure of a conventional dual-stream convolutional network. Transfer learning can utilize existing rich data resources to quickly adjust model parameters to adapt to the behavioral characteristics of specific groups of learners. In addition, dual-stream convolutional networks can more comprehensively capture and analyze the dynamic behavioral changes of learners during the learning process by simultaneously processing spatial features and time series information. Integrating the fast adaptation characteristics of transfer learning with the deep information processing capabilities of dual stream convolutional networks, this image recognition driven behavior analysis not only improves the generation efficiency of personalized learning paths, but also provides a more delicate and personalized teaching strategy for online education in vocational colleges, helping to achieve a truly learner centered teaching model.
Figure 1 illustrates the structure of a traditional dual-stream convolutional network. In the task of identifying group behavior of learners in online education, the spatial and temporal flow networks of the dual stream convolutional network are configured to jointly handle the static features and dynamic changes of video frames. The spatial network is mainly responsible for parsing the image content of each individual video frame, capturing the facial expressions, postures, and other spatial features related to learning behavior of learners. Usually, this stream adopts a standard convolutional neural network (CNN) architecture, which has been proven to have strong feature extraction capabilities in various image recognition tasks. Time networks focus on sequence information, processing the flow of actions and behaviors between consecutive frames, and mining the behavior patterns of learners in the temporal dimension, such as gesture actions, changes in gaze points of the eyes, etc. This flow usually uses optical flow method to pre calculate and input motion information between frames, and encodes these dynamic features through CNN architecture. Figure 2 presents the framework of the recognition model, grounded in transfer learning and dual-stream convolutional networks, as conceptualized in this study.
The spatial network's output is manifested as a high-dimensional feature vector, encapsulating the spatial information of the current frame. This serves as the foundational basis for subsequent behavior recognition and analysis. Inputs to the spatial stream network predominantly comprise raw video frame imagery, capturing static visual characteristics of learners at discrete moments, such as posture, facial expressions, and interactive actions. In contrast, the temporal network yields an alternative set of feature vectors, delineating the dynamic alterations in learners' behaviors over time, exemplified by the fluidity of gestures and the velocity of head rotations. The temporal stream network inputs a succession of consecutive video frames comprising optical flow images, specifically engineered to calculate and depict the motion information transpiring between frames, thereby reflecting changes in object and surface movements.
The optical flow images for the temporal stream network are customarily derived from processing red, green and blue (RGB) images of learners' group behavior in online education settings, utilizing optical flow methodologies. Optical flow, a method for estimating pixel motion across consecutive video frames, operates on the premise that pixel intensity remains unaltered over brief periods, with only minor spatial shifts occurring in corresponding pixel locations. Within the scope of analyzing group behavior in online education, optical flow initially acquires continuous RGB frame sequences and subsequently computes a motion vector for each pixel from one frame to the next. This vector is composed of both horizontal and vertical displacement components. The foundational assumption of brightness constancy in optical flow facilitates the tracking of learners’ movements, such as head rotations and gestural alterations. The direction and velocity of these movements are estimated by examining the variations across the image sequence. Assuming the velocity vector of a pixel is denoted by n= (i, n), the brightness constancy assumption is articulated as follows:
$U(a, b, s)=U(a+f a, b+f b, s+f s)$ (1)
Expanding this using Taylor's series results in:
$U(a, b, s)=U(a, b, s)+\frac{\partial U}{\partial a} f a+\frac{\partial U}{\partial b} f b+\frac{\partial U}{\partial s} f s+\gamma$ (2)
Defining i=fa/fs, n=fn/fs, Ua=∂U/∂a, Ub=∂U/∂b, and Uc=∂U/∂c, the combination of the preceding expressions yields the following relationship:
$U_a i+U_b i+U_s=0$ (3)
In the context of a single optical flow image, the information pertaining to pixel motion is confined to that between two consecutive frames. This limitation might not suffice to capture complex or gradual motion patterns, a scenario often encountered in group behavior recognition tasks that necessitate analysis over extended time sequences. To address this challenge, a trajectory tracking method is employed, processing the input from a singular optical flow image. This technique is instrumental in accumulating and amalgamating motion information across a series of consecutive frames. The process involves tracking the movement paths of designated feature points or pixel blocks over multiple frames, thereby constructing trajectories that encapsulate motion changes over prolonged durations. The input vector is denoted by Us, and the following procedure is applied to each frame s:
$\begin{aligned} U_n(i, n, 2 j-1) & =f_{n+j-1}^a\left(O_j\right) ; U_n(i, n, 2 j)=f_{\pi+j-1}^b\left(O_j\right) \\ i & =[1, q], n=[1, g], j=[1, M]\end{aligned}$ (4)
Oj denotes the j-th layer along the trajectory. In the frames capturing learner group behaviors, it is posited that a recursive relationship exists, commencing from (i, n):
$O_1=(i, n) ; O_j=O_{j-1}+f_{n+j-2}\left(O_{j-1}\right), j>1$ (5)
To harness the knowledge embedded in models pre-trained on extensive datasets, thus expediting and refining the learning process for learner behavior recognition in specific online education scenarios, this study integrates transfer learning into the dual-stream convolutional network designed for vocational college learner group behavior recognition. Transfer learning facilitates the transference of feature representations, honed in the domain of image recognition, to the realm of learner behavior recognition within online education. This approach serves a dual purpose: for behavior recognition tasks in online education, where data is often scarce, pre-trained models offer a substantial foundation of knowledge, diminishing the dependency on extensive annotated data needed for training models from the ground up. Additionally, it endows the model with robust feature extraction capabilities from the onset of learning, enabling quicker adaptation and refinement in recognizing learner behavior features during subsequent training phases. Simultaneously, the study incorporates a formalized approach to maximizing average differences using multiple kernels. This strategy aims to augment the efficacy of model testing, essentially enhancing the model's capacity to discern true effects, while concurrently minimizing Type II errors, which entail the risk of erroneously accepting a spurious hypothesis or failing to reject an invalid null hypothesis.
Figure 1. Structure of the traditional dual-stream convolutional network
Figure 2. Framework of the proposed recognition model based on transfer learning and dual-stream convolutional networks
In unsupervised domain adaptation, the source domain is defined as Ft={(atu,btu)}vtu=1, and vt is marked as an example. The target domain is defined as Fu={ask}vsk=1, where vs is an unmarked example. The probability distributions of source and target domains are represented by o and w, respectively. By maximizing the testing power, the multi-kernel maximization of average differences aids in accurately capturing the real behavioral pattern changes in online education scenarios. By minimizing Type II, it ensures that the model does not easily miss important behavioral signals when facing unseen behavioral samples. The goal is to build a deep neural network that can learn transferable features across domain differences, and to construct a classifier b=ϕ(a) to minimize the target risk R(ϕ)= Oe(a,b)-w[ϕ(a≠b)]. In the context of semi-supervised adaptation, where the target domain contains a limited number of labeled samples, annotated examples vx for both the source and target domains are represented as Fx={(axi, bxu)}.
It is hypothesized that the reproducing kernel Hilbert space, equipped with feature kernel j, is represented by Gj. The average embedding of distribution o in Gj, identified as the unique element ωj(o), ensures that for all d∈Gj, the relation Ra~Ed(a)=<(d(a),ωj(o)>Gj is upheld. The distance between the average embeddings of distributions o and w in the reproducing kernel Hilbert space, termed as the multi-kernel maximization of average differences LJ-LLF fj(o,w), is defined. The squared formula for this multi-kernel maximization of average differences is articulated as:
$f_j^2(o, w) \stackrel{\Delta}{=}\left\|R_o\left[\theta\left(a^s\right)\right]-R_o\left[\theta\left(a^s\right)\right] \mid\right\|_{G_j}^2$ (6)
The model developed in this research is predicated on transfer learning and dual-stream convolutional networks, drawing upon the VGGNet architecture. Its network depth is adept at extracting intricate feature representations, essential for comprehending learners' behaviors and emotional states. The network comprises 13 convolutional layers and 5 maximum pooling layers, designed to capture features across varying scales and to abstract higher-level semantic information progressively. Three fully connected layers integrate these features, and a preceding softmax layer processes them for probability output before classification. In the realm of transfer learning, adaptation layers (14 to 16) are appended to the VGGNet foundation, facilitating the fine-tuning of the pre-trained model's weights for enhanced performance on novel datasets. Additionally, by merging features from both the spatial and temporal streams before the softmax layer, the model harnesses static information (e.g., posture, expressions) and dynamic data (e.g., gestures, motion trajectories) from learners, enabling more precise behavior predictions.
To harmonize the distributions of source and target domains under the latent representation of the fully connected layers (14th to 16th), the CNN risk incorporates a multi-layer adaptation regularizer grounded in the multi-kernel maximization of average differences. It is posited that the network's final three layers are denoted as m0, m1, and m2. The aggregation of all labeled data from both source and target domains is represented by axu and vx. Consequently, the network's optimization objective is formulated as follows:
$\underset{\Phi}{M N} \frac{1}{v} \sum_{n=1}^{v_p} K\left(\phi\left(a_n^x\right), b_n^x\right)+\eta \sum_{m=U_0}^{U_2} f_j^2\left(F_t^s, F_s^s\right)$ (7)
The essence of the multi-kernel maximization of average differences is founded on employing a suite of kernel functions to translocate data into a high-dimensional feature space. Within this space, the disparities in distributions between source and target domains are quantified. The process of computing the inner products of these kernels fundamentally entails evaluating the similarities between data from source and target domains across multiple dimensions. Nonetheless, this approach may be susceptible to biases arising from unbalanced sample sizes, potentially leading to skewed estimations. An unbiased estimation technique is utilized to mitigate this concern. By making up for any potential bias in sample selection, this technique aims to prevent systematic biases and align the predicted expectations with the actual distribution differences. Using cu=∆(at2u-1, at2u,as2u-1, as2u)f2j(o.w)=2/vt∑vt/2u=1hj(cu), one may express the unbiased estimation:
$\begin{aligned} & h_j\left(c_u\right) \stackrel{\Delta}{=} j\left(a_{2 u-1}^t, a_{2 u}^t\right)+j\left(a_{2 u-1}^s, a_{2 u}^s\right) -j\left(a_{2 u-1}^t, a_{2 u}^s\right)-j\left(a_{2 u-1}^t, a_{2 u}^s\right)\end{aligned}$ (8)
Micro-expressions made by learners in online education can provide nuanced and intricate insights on their emotional and mental states. The educational system may infer learners' emotional reactions during the learning process, such as perplexity, uncertainty, interest, or contentment, by accurately classifying and detecting learners' micro-expressions. In individualized instruction, these emotional states provide as vital feedback signals. For instance, the system can automatically modify the course material to match each learner's unique needs, offer more thorough explanations, or offer further assistance as soon as it notices a perplexed learner's micro-expression.
However, in the event that learners exhibit micro-expressions of contentment or curiosity, the system might expedite instruction or suggest more difficult materials in order to correspond with their degree of involvement. Utilizing image processing technology for the recognition of micro-expressions enables fine-tuned adjustments in personalized learning paths, concentrating on brief, subtle facial movements that often represent non-verbal, intuitive expressions of internal emotional states. This enhanced understanding of learners by the teaching system fosters a more sensitive and responsive learning environment, where teaching strategies dynamically align with shifts in learners' emotional states, thus effectively bolstering learning efficiency, elevating learner satisfaction, and ultimately enhancing learning outcomes.
In order to identify micro-expressions in online learners, this research presents a novel method that combines the attention on essential facial action units with the use of Graph Convolutional Networks (GCNs). Structured facial expression data is easily captured and utilized by GCNs. They successfully simulate the interactions between edges (like the muscles that cause changes in skin texture) and nodes (like the mouth and eyes) in important facial regions. By scrutinizing the complex interplay between these domains and action units, GCNs reveal the more profound patterns present in micro-expressions.
Figure 3. The whole structure of the prototype network
Figure 4. Prototype network structure
Prototypes are used in this work to contain the feature representations and important parameters for each micro-expression category. The prototype network's overall structure and framework are depicted in Figures 3 and 4, respectively. The Euclidean distance between these prototypes and the input test image is calculated during the recognition phase. The predicted micro-expression category is determined by identifying the prototype's category that is closest to the test image. An adaptive hybrid function that combines triplet loss and cross-entropy loss is used to improve classification accuracy. To guarantee that samples from the same category are close together in the feature space, while samples from different categories are separated, triplet loss functions are used. Within-category compactness and inter-category differentiation are strengthened by this optimization of relative sample distances. On the other hand, the prediction probability for the accurate category is optimized by cross-entropy loss. Combining these loss functions improves the model's ability to generalize and facilitates more distinct boundary lines across categories.
The developed prototype network's computational process proceeds as follows:
Learners' facial expression images are first processed using a GCN, which maps each image into a feature embedding space. Within this space, embedding vectors signify the expression features of the images, delineating the intricate relations between pivotal facial areas and action units. For each micro-expression category in the training set, the weighted average of its embedding vectors is computed, signifying the central point of that category in the feature embedding space, hence forming the class prototype. The computation of covariance matrices for the embedding vectors of each category captures the distribution of features within the class. This computation reflects the dispersion of data points within each category, aiding in evaluating the resemblance of new samples to the class prototypes. The embedding function is denoted by dθ(Au), with a sample set of j categories represented by Tj, the quantity of samples in j categories indicated by |Tj|, the feature vector of the u-th sample in Tj illustrated by Au, and the label of the u-th sample in set Tj represented by Bu. The formula for each category prototype zj is delineated as:
$z_j=\frac{1}{\left|T_j\right|} \sum_{\left(a_u, b_u\right)=T_j} d_\theta\left(A_u\right) b_u$ (9)
In the assessment of an input test sample, it is initially mapped into the feature embedding space utilizing the same GCN. Subsequently, the Euclidean distances between the sample and each class prototype are computed. Assuming that the inverse matrix of the covariance matrix for category j is denoted by Lj, the formula for calculating the Euclidean distance dfj(u) given the class prototype zj, is established as follows:
$f_j u=\sqrt{\left(a_u-z_u\right)^T L_j\left(a_u-z_u\right)}$ (10)
The distances calculated between the test sample and each class prototype are then fed into a softmax regression function. This function transforms these distances into a probability distribution for belonging to each category, with the category having the highest probability designated as the model's predicted category. The formula for calculating the probability of test sample a belonging to category j is articulated as:
$o_\theta(b=j \mid a)=\frac{\exp \left(-f\left(d_\theta(a), z_j\right)\right)}{\sum_j \exp \left(-f\left(d_\theta(a), z_j\right)\right)}$ (11)
The following formula is used to compute the cross-entropy loss function:
$\operatorname{LOSS}_z=-\sum \log o(b=j \mid a)$ (12)
During the network's training phase, a hybrid loss function that combines cross-entropy loss and triplet loss is used to assess the model's prediction mistakes. Depending on the size of the loss value, the backpropagation algorithm modifies the parameters of the GCN. By decreasing the value of the loss function, this method aims to improve the model's ability to distinguish between various categories of micro-expressions inside the feature embedding space.
In order to improve the model's capacity for generalization in situations where sample availability is restricted and to guarantee that positive (same category) and negative (different categories) samples are effectively distinguished during the learning process, this study applies the triplet loss function in an N-way K-shot setting to the recognition and classification of micro-expressions in online learners. Small samples of data are used in this N-way K-shot learning technique; "N-way" denotes that N categories are selected for each learning task, and "K-shot" denotes that K samples are available for each category to train the system. This technique allows appropriate categorization even in the presence of sparse or novel data by training the model with significant cases. The maximum distance between a positive sample, dϕ(aux), and a negative sample, dϕ(auo), is represented by the formula MAX(f(dϕ(aux))-f(dϕ(auo)).
$\operatorname{LOSS}_S=\sum_{u=1}^V \sum_{x=1}^V\left[l+\operatorname{MAX}\left(f\left(d_\phi\left(a_x^u\right)\right)-f\left(d_\phi\left(a_o^u\right)\right)\right)\right]_{+}$ (13)
In this study, a hyperparameter l is constructed to carefully balance the effects of triplet loss and cross-entropy loss inside the composite loss function, thereby fine-tuning the model's responsiveness to challenging data. This hyperparameter ensures that the model is appropriately trained to increase categorization distinction and recognition accuracy for positive data by adjusting the weighting of the different components of the loss function. The following is a list of the processes needed to create the hybrid loss function. With T standing for the training set and murd for the length of the final dimension in the feature matrix, the following function for the u-th embedding space in the training set, represented by dsϕ(a), is hypothesized:
$m_{r d}^u=d_\phi^u(a), a_r, a_d \in T,(r \neq d)$ (14)
The first step involves using a GCN to extract features from learners' micro-expression images, which creates a modified feature matrix. For every image post-network processing, this matrix contains high-dimensional feature vectors that capture important visual information related to micro-expressions. dsϕ(a) represents the matrix [Vz, Vt, murd], where Vz is the total number of categories and Vt is the number of categories in the training set. The altered feature vectors are aggregated over the range of Vt in order to generate this matrix. The summation ∑Vtk=0duθ(a) expresses this numerically.
$d_\phi^u(x) \stackrel{V_z, V_t, m_{r d}^u}{\rightarrow} d_\phi^u(a) \rightarrow \sum_{k=0}^{t_t} d_\phi^u(a)$ (15)
The different feature vectors within ∑Vtk=0duϕ(a) are then separated by pairwise Euclidean distances. This distance matrix reveals the samples' relative positions in the feature space, which is a fundamental component in differentiating between various micro-expression categories.
$F_{r d}^u=\left\|\sum_{k=0}^{V_t} d_\phi^u\left(a_{r^r}\right), \sum_{k=0}^{V_t} d_\phi^u\left(a_d\right)\right\|_2(r \neq d)$ (16)
The next step is to link the matching micro-expression labels to the calculated distance matrix. To be more precise, Furd is transformed into a matrix Furd′, sized [VWA×VQU, VWA], and has a micro-expression label m attached. The goal of this process is to adjust the weights in the loss function according to the label of each sample, reflecting the categorical differences across samples. The following is how the distance matrix Furd′′ is obtained:
$F_{r d}^{u^{\prime \prime}}=F_{r d}^{u^{\prime}}+m$ (17)
$\left(F_{r d}^{u^{\prime \prime}}\right)=\operatorname{MIN}\left(F_{r d}^{u^{\prime \prime}} \mid r \neq d\right) \xrightarrow{\text { Column } 1} f_{r d}^u$ (18)
The influence of each sample's label within the training process is ascertained by calculating the ratio of every element in the distance matrix Furd′′ to its corresponding distance-label vector furd element. This ratio dictates the weight each sample holds within the loss function; samples with greater label influence are assigned lower weights, thereby diminishing their impact during the training phase.
$e_t=\frac{F_{r d}^{u \prime}}{f_{r d}^u}$ (19)
Subsequent to a series of experimental trials and validations, the hyperparameter value is fine-tuned to attain an optimal configuration. This optimal setting allows the adaptive loss function to effectively balance the challenge of recognizing different categories during the training process, thereby optimizing the overall performance of the model. The determination of the hyperparameter value is iterative in nature, typically reliant on the model's performance in the validation set. The formula for calculating the final hyperparameter value is:
$S(l)_{d r}^u=e^* l$ (20)
$e=\log \left(e_t\right)+1-\left(\log \left(e_t\right)+1\right) * m$ (21)
The computation formula for the triplet loss function, a critical component of the hybrid loss function, is formulated as:
$LOS{{S}_{S}}\sum\limits_{a\in W}{\sum\limits_{x\ne o}{\sum\limits_{u}{{{\left[ S\left( l \right)_{rd}^{u}+MAX\left( f\left( {{d}_{\varphi }}\left( a_{x}^{u} \right) \right)-f\left( {{d}_{\varphi }}\left( a_{o}^{u} \right) \right) \right) \right]}_{+}}}}}$ (22)
The scaling factor, denoted by β, plays a crucial role in the hybrid loss function, which is expressed as:
$L O S S=\operatorname{LOSS}_z+\beta^* \operatorname{LOSS}_S$ (23)
In the experimental evaluation, the method incorporating transfer learning and dual-stream convolutional networks, specifically designed for the recognition of group behaviors in vocational college learners, demonstrated superior performance. The comparative analysis of recognition rates, presented in Table 1, reveals that this method achieved remarkable success across various group behavior recognition tasks. Notably, in the task of synchronous interaction, the proposed method significantly excelled, outstripping competitors such as Residual Network (ResNet) and EfficientNet, underscoring its proficiency in complex behavior analysis. While the EfficientNet model registered a marginally higher recognition rate (98.9%) in the discussion and cooperation category, the proposed method's performance (95.6%) remained commendably close. Regarding collective emotional response, the method's rate (97.8%) was on par with ResNet, though the implausibly high rate (101%) of EfficientNet suggests potential methodological inaccuracies. For categories such as participation changes and discipline and order, data for EfficientNet and GoogLeNet were not available, indicating either non-assessment in these areas or subpar results. On average, the proposed method led with a recognition rate of 96.1%, closely tailed by GoogLeNet's 94.5%. The efficacy of the method proposed in this study, integrating transfer learning with dual-stream convolutional networks, was demonstrated to surpass that of other prevalent CNN models. This superiority is ascribed to the method's capacity to harness pre-trained knowledge comprehensively, thereby augmenting feature extraction capabilities and accurately capturing dynamic behavioral aspects of learners. These results so confirm that the suggested method can be used to identify group behaviors among vocational college learners. This methodology is demonstrated to be a highly effective tool for creating customized learning paths, suggesting that it has broad relevance in the vocational education domain.
Based on True Positive Rates (TPR) and False Positive Rates (FPR) at various thresholds, the created group behavior recognition model's Receiver Operating Characteristic (ROC) curve was plotted to assess the classifier's performance. A ROC curve that is ideal approaches the upper left corner, signifying a high TPR accompanied by a minimal FPR. As can be seen in Figure 5, the curve shows a growth in TPR in tandem with growing FPR, a common feature of ROC curves where classifiers produce more false alarms while stepping up their efforts to identify true positives. The steady rise in TPR in regions with low FPR (from 0 to roughly 0.2) indicates the model's limited ability to correctly detect true positives while preserving a low rate of false positives. With further escalation in FPR, a marked acceleration in TPR growth is observed, particularly notable in the range from 0.2 to 1, where TPR elevates from 0.04 to 1. This trend indicates the model's proficiency in identifying true positives, albeit accompanied by an increase in false alarms. Reaching a TPR of 1 at an FPR of 1 implies that the classifier ultimately detects all true positives, but also misidentifies all negatives as positives. The ROC curve, thus, underscores the utility of the group behavior recognition model, especially in scenarios where a higher tolerance for false alarms exists.
In the context of model training, Figure 6 elucidates the accuracy trajectory of the group behavior recognition model across varying epochs. The initial training phase (0-20 epochs) witnessed a modest rise in accuracy from 0.315 to 0.375, indicative of the model's initial phase of feature learning for group behavior recognition. Accuracy increased steadily during the course of training (20-60 epochs), peaking at 0.645 by the 60th epoch, indicating the model's continuous adaptability and learning improvement. Specifically, accuracy increased significantly between 60 and 100 epochs, reaching a maximum of 0.915, indicating a notable improvement in the model's capacity to identify group behaviors. This steady increase in accuracy during the training period demonstrates how well the model learns the characteristics of group behavior. The model achieves excellent accuracy, as seen by the highest accuracy of 0.915, and the overall trend shows an upward pattern in accuracy. Despite fluctuations in later training stages, the model's performance distinctly surpassed random guessing, emphasizing the robustness and effectiveness of the proposed method in recognizing group behaviors.
Table 1. Comparative recognition rates of different group behavior recognition models
|
Behavior Type |
Proposed Method |
ResNet |
DenseNet |
EfficientNet |
GoogLeNet |
|
Collective attention |
96.1 |
95.2 |
77.9 |
93.6 |
95.6 |
|
Synchronous interaction |
88.9 |
55.8 |
72.1 |
64.2 |
88.7 |
|
Discussion and cooperation |
95.6 |
88.9 |
92.3 |
98.9 |
97.8 |
|
Collective emotional response |
97.8 |
98.3 |
72.5 |
101 |
97.6 |
|
Participation changes |
93.5 |
85.2 |
82.3 |
N/A |
N/A |
|
Discipline and order |
95.8 |
95.4 |
92.6 |
N/A |
N/A |
|
Average |
96.1 |
88.6 |
81.2 |
88.9 |
94.5 |
Table 2. Impact of threshold values on recognition accuracy for 5-way-1-shot learning strategy
|
Threshold Value |
5-Way-1-Shot |
|
|
Training Set |
Validation Set |
|
|
0.05 |
0.562 |
0.415 |
|
0.14 |
0.578 |
0.421 |
|
0.21 |
0.559 |
0.418 |
|
Threshold Value |
5-Way-1-Shot |
|
|
Training Set |
Validation Set |
|
|
1.1 |
0.748 |
0.725 |
|
1.3 |
0.789 |
0.745 |
|
2.1 |
0.745 |
0.736 |
Table 3. Comparison of F1-score and recognition accuracy with several micro-expression recognition models
|
Method |
Training Set |
Validation Set |
||
|
Accuracy |
F1-Score |
Accuracy |
F1-Score |
|
|
3D-FCNN |
0.578 |
0.558 |
0.568 |
0.542 |
|
Deep CNNN |
0.714 |
0.732 |
0.569 |
0.463 |
|
Graph-TCN |
0.751 |
0.724 |
0.764 |
0.689 |
|
Micron-BERT |
0.779 |
0.732 |
0.762 |
0.725 |
|
LDL |
0.746 |
- |
- |
- |
|
LE |
0.689 |
- |
- |
- |
|
DCACNN |
0.652 |
0.639 |
0.589 |
0.598 |
|
MER-GCN |
0.432 |
- |
- |
- |
|
Proposed method |
0.789 |
0.751 |
0.765 |
0.744 |
Figure 5. ROC curve of the constructed group behavior recognition model
Figure 6. Accuracy curve of the constructed group behavior recognition model
The investigation of learner micro-expression recognition utilizing GCNs was conducted to more precisely discern the nuances of learner emotional changes. Table 2 delineates the model's recognition accuracies on both training and validation sets under varying threshold settings, employing a 5-way-1-shot learning strategy. Recognition accuracies on the training set were observed at 0.562, 0.578, and 0.559 for threshold values of 0.05, 0.14, and 0.21, respectively, while accuracies on the validation set were 0.415, 0.421, and 0.418. These relatively modest accuracies, particularly on the validation set, indicate constrained generalization capabilities. Enhancement in accuracies was noted when threshold values were increased to 1.1, 1.3, and 2.1, achieving 0.748, 0.789, and 0.745 on the training set, and 0.725, 0.745, and 0.736 on the validation set, respectively. This improvement suggests an upward trend in model performance with elevated threshold values. The threshold setting of 1.3 emerged as the most effective, yielding the highest accuracy on both the training (0.789) and validation (0.745) sets, thereby indicating its optimality for training and generalization. The findings imply that threshold values significantly influence the performance of micro-expression recognition models, with higher settings enhancing accuracy in both training and validation contexts. This underscores the efficacy of the proposed methodology and the critical role of appropriate threshold settings in bolstering model generalization, particularly emphasizing the GCNs' capability in micro-expression capture.
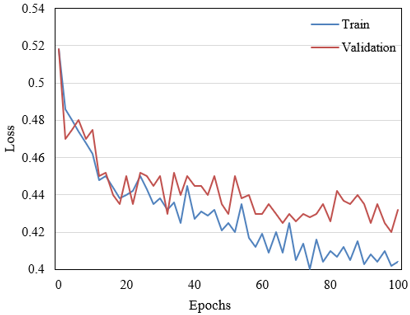
Figure 7 showcases the learner micro-expression recognition model's loss curves on both training and validation sets across various training epochs. Initially, an identical loss of 0.518 was exhibited on both sets, reflecting the model's commencement of learning from a state of random weight initialization. In the initial 20 epochs, a marginal decline in loss was observed on the training set, contrasted with a rise followed by a decrease on the validation set, indicating the model's adaptation to the dataset's characteristics. The loss on the training set displayed a gradual yet fluctuating decrease from epochs 20 to 100, with the validation set showing greater fluctuation. Beyond 100 epochs, a stabilization in loss trends on both sets suggested the attainment of optimal learning capacity. Overall, a progressive reduction in loss was noted throughout the training, manifesting effective generalization on the validation set.
The accuracy evolution of the micro-expression recognition model across training epochs, tracked in Figure 8, reflects the model's learning effectiveness over time. Initially, in the first 20 epochs, a rise in accuracy on both training and validation sets was observed, indicating the model's commencement in assimilating useful features from the data. Continued training up to 100 epochs led to a steady increase in accuracy, a trend that persisted without substantial overfitting, as demonstrated by the concurrent rise in accuracy on the validation set. Post 100 epochs, accuracies approached 0.796 on the training set and attained 0.797 on the validation set, highlighting the model's robust generalization ability. The closeness of accuracies on both sets throughout the training process is indicative of sound model generalization, suggesting the model learned generalizable features applicable to the validation set. A sign of a successful model generalization is when the accuracy on the validation set continuously matched that of the training set during the training process. This observation suggests that instead of overfitting on the training data, the model absorbed general features that worked just as well on the validation set. Consequently, the study's learner micro-expression recognition model achieved excellent levels of accuracy on both the training and validation sets and demonstrated a steady rise in accuracy during the training stages. These outcomes support the model's excellent generalization capabilities and demonstrate its ability to distinguish between different micro-expressions.
Figure 7. Loss change curves of the learner micro-expression recognition model
Figure 8. Accuracy change curves of the learner micro-expression recognition model
Table 3 contains several micro-expression recognition models as well as two essential metrics: recognition accuracy and F1-score, which are used to assess how well classification models work. While the F1-score, a harmonic mean of precision and recall, shows the comprehensiveness and accuracy of positive class recognition, accuracy represents the percentage of correctly classified samples. With an accuracy of 0.789 on the training set, the suggested methodology performed better in terms of categorization than the other methods. Its F1-score of 0.751 was likewise among the top on the training set. The suggested method had the highest accuracy (0.765) and F1-score (0.744) on the validation set, indicating its strong ability to differentiate between real positive samples while retaining high accuracy and completeness. The suggested technique's exceptional capacity for generalization is demonstrated by its excellent accuracy and F1-score on training and validation sets. This capacity is crucial for micro-expression recognition algorithms to function well on unseen data. To sum up, the approach described in this research is remarkably effective at identifying micro-expressions. It performs exceptionally well on the training set and retains high accuracy and F1-score on the validation set. The approach's great generalization capabilities are indicated by the consistency seen between the outputs obtained during training and validation. Working with complex data types such as micro-expressions emphasizes how crucial it is for the approach to precisely identify and interpret minuscule changes in facial expressions. The results demonstrate the efficacy of the suggested methodology, particularly with regard to managing the multitude of subtleties included in micro-expression data.
This study aimed to enhance the recognition and interpretation of learner group behaviors and micro-expressions in online vocational college education systems through the use of deep learning technology. This would enable the development of tailored learning pathways. The approach that was developed primarily addressed perceiving learner group behaviors by combining dual-stream convolutional networks with transfer learning. Transfer learning made use of information from heavily trained datasets, and the dual-stream network design handled temporal and spatial data, which was necessary to distinguish the dynamics of learner behavior. Moreover, GCNs were utilized for the complex identification of students' micro-expressions. By skillfully managing non-Euclidean structures in image data, GCNs were able to accurately represent learners' subtle emotional changes on their faces, making them an effective tool for assessing learners' emotional states. Combining these methods produced highly accurate results in terms of identifying the emotions and behaviors of learners. The demonstrated efficacy of the suggested approach considerably enhances the online education systems for vocational colleges' operational efficiency. This feature facilitates the dynamic modification of learning paths and content based on real-time feedback from learners, hence encouraging the development of more customized teaching approaches.
The experimental outcomes showed the method's exceptional performance on a range of datasets. This technique outperformed numerous well-known deep learning models in the field of group behavior identification in terms of accuracy and F1-score. The approach showed significant potential for generalization in the field of micro-expression recognition, as evidenced by its good accuracy and F1-score, which were particularly noteworthy in the validation set.
In conclusion, both conceptually and empirically, it has been demonstrated that the strategy suggested for the creation of customized learning pathways in vocational colleges is workable and efficient. This method has become an essential tool for online learning because it can reliably identify the behaviors and micro-expressions of learners in groups. It allows instructors and online learning platforms in vocational colleges to better meet the individual needs of each student, which improves the quality of instruction and the efficacy of learning outcomes.
[1] Kulkarni, P., Rajesh, T.M. (2021). Video based sub-categorized facial emotion detection using LBP and edge computing. Revue d'Intelligence Artificielle, 35(1): 55-61. https://doi.org/10.18280/ria.350106
[2] Wang, S.Y. (2021). Online learning behavior analysis based on image emotion recognition. Traitement du Signal, 38(3): 865-873. https://doi.org/10.18280/ts.380333
[3] Anji Reddy, K., Regula, T., Sharmila, K., Srinivas, P.V.V.S., Ziaur Rahman, S. (2023). Performance enhancement in facial emotion classification through noise-injected FERCNN model: A comparative analysis. Ingénierie des Systèmes d’Information, 28(5): 1161-1175. https://doi.org/10.18280/isi.280505
[4] Zhu, C.J., Ding, T., Min, X. (2022). Emotion recognition of college students based on audio and video image. Traitement du Signal, 39(5): 1475-1481. https://doi.org/10.18280/ts.390503
[5] Nihad, E., Seghroucheni, Y.Z. (2017). Analysing the outcome of a learning process conducted within the system ALS_CORR [LP]. International Journal of Emerging Technologies in Learning (Online), 12(3): 43. https://doi.org/10.3991/ijet.v12i03.6377
[6] Rajendran, R., Muralidharan, A. (2013). Impact of Mindspark's adaptive logic on student learning. In 2013 IEEE Fifth International Conference on Technology for Education (t4e 2013), Kharagpur, India, pp. 119-122. https://doi.org/10.1109/T4E.2013.36
[7] Patil, V., Narayan, A., Ausekar, V., Dinesh, A. (2020). Automatic students attendance marking system using image processing and machine learning. In 2020 International Conference on Smart Electronics and Communication (ICOSEC), Trichy, India, pp. 542-546. https://doi.org/10.1109/ICOSEC49089.2020.9215305
[8] Yang, Z., Yang, J., Rice, K., Hung, J.L., Du, X. (2020). Using convolutional neural network to recognize learning images for early warning of at-risk students. IEEE Transactions on Learning Technologies, 13(3): 617-630. https://doi.org/10.1109/TLT.2020.2988253
[9] Wang, Q., Cui, J., Qin, Z., Ma, X., Li, G. (2021). A classroom students convergent behavior analysis system based on image recognition. In 2021 3rd International Workshop on Artificial Intelligence and Education (WAIE), IEEE, Xi'an, China, pp. 53-59. https://doi.org/10.1109/WAIE54146.2021.00019
[10] Chen, H., Wang, Y., Shu, H., Wen, C., Xu, C., Shi, B., Xu, C., Xu, C. (2020). Distilling portable generative adversarial networks for image translation. In Proceedings of the AAAI Conference on Artificial Intelligence, 34(4): 3585-3592. https://doi.org/10.1609/aaai.v34i04.5765
[11] Li, X., Yue, R., Jia, W., Wang, H., Zheng, Y. (2021). Recognizing students' emotions based on facial expression analysis. In 2021 11th International Conference on Information Technology in Medicine and Education (ITME), IEEE, Wuyishan, Fujian, China, pp. 96-100. https://doi.org/10.1109/ITME53901.2021.00030
[12] Tang, H., Cen, X. (2021). A survey of transfer learning applied in medical image recognition. In 2021 IEEE International Conference on Advances in Electrical Engineering and Computer Applications (AEECA), Dalian, China, pp. 94-97. https://doi.org/10.1109/AEECA52519.2021.9574368
[13] Qiu, Z., Shi, D., Kuang, Y., Liao, C., Zhu, X. (2021). Image recognition of harmful bird species related to transmission line outages based on deep transfer learning. Gaodianya Jishu/High Voltage Engineering, 47(11): 3785-3794.
[14] Chen, A., Xie, Y., Wang, Y., Li, L. (2021). Knowledge graph-based image recognition transfer learning method for on-orbit service manipulation. Space: Science & Technology. https://doi.org/10.34133/2021/9807452
[15] Wang, S.Y., Tang, H., Chai, L. (2021). Class imbalance in facial expression recognition by GCN with focal loss. In 2021 China Automation Congress (CAC), IEEE, Beijing, China, pp. 3270-3275. https://doi.org/10.1109/CAC53003.2021.9727624
[16] Lo, L., Xie, H.X., Shuai, H.H., Cheng, W.H. (2020). MER-GCN: Micro-expression recognition based on relation modeling with graph convolutional networks. In 2020 IEEE Conference on Multimedia Information Processing and Retrieval (MIPR), Shenzhen, China, pp. 79-84. https://doi.org/10.1109/MIPR49039.2020.00023
[17] Iyer, G., Chanussot, J., Bertozzi, A.L. (2020). A graph-based approach for data fusion and segmentation of multimodal images. IEEE Transactions on Geoscience and Remote Sensing, 59(5): 4419-4429. https://doi.org/10.1109/TGRS.2020.2971395
[18] Brahimi, T., Boubchir, L., Fournier, R., Naït-Ali, A. (2017). An improved multimodal signal-image compression scheme with application to natural images and biomedical data. Multimedia Tools and Applications, 76(15): 16783-16805. https://doi.org/10.1007/s11042-016-3952-7
[19] Kurekin, A., Radford, D., Lever, K., Marshall, D., Shark, L.K. (2011). New method for generating site-specific clutter map for land-based radar by using multimodal remote-sensing images and digital terrain data. IET Radar, Sonar & Navigation, 5(3): 374-388. https://doi.org/10.1049/iet-rsn.2010.0036