Jayanta Kiran Shimpi*![]() | Poonkuntran Shanmugam
| Poonkuntran Shanmugam![]()
© 2023 IIETA. This article is published by IIETA and is licensed under the CC BY 4.0 license (http://creativecommons.org/licenses/by/4.0/).
OPEN ACCESS
Diabetic Retinopathy (DR), a degenerative eye condition, is primarily attributed to Diabetes Mellitus, a disease characterized by elevated blood glucose levels that manifest symptoms on the retina. Among adults in developing countries, DR is a prevalent cause of blindness. The treatment is focused on preserving the patient's existing visual acuity, given the irreversible nature of the disease. Early detection of DR and appropriate intervention can prevent further deterioration of a patient's vision, thereby increasing the likelihood of effective treatment. Traditional diagnosis of DR involves a manual examination of retinal fundus images by ophthalmologists, a time-consuming and costly procedure. This study aims to evaluate the efficacy of deep learning methods in early, intermediate, and advanced stages of DR diagnosis using fundus images. The Proposed Hybrid Diabetic Retinopathy Neural Network (DRNN) model is designed for early detection of DR. The fundus images are classified into five categories: No DR, Mild DR, Moderate DR, Severe DR, and Proliferative DR. The proposed model involves stages of data collection, preprocessing, splitting, and modeling, achieving an accuracy rate of 99.86% in the training phase and 96.91% in the testing phase. Moreover, this study reviews and compares recent advancements in Deep Learning (DL) techniques such as Convolutional Neural Networks (CNNs), Recurrent Neural Networks (RNNs), Deep Belief Networks (DBNs), and Google Nets. The proposed model is juxtaposed with various deep-learning methodologies to ascertain the most effective approach for DR detection and classification. The comparative results elucidate the superior accuracy of the DRNN model, thereby contributing valuable insights for algorithm selection in future research.
diabetic retinopathy, detection, fundus images, classification, deep learning
The escalating concern surrounding diabetic retinopathy (DR), a complex visual condition, underscores the urgent need for advanced and precise diagnostic techniques. If left unchecked, DR could potentially progress to severe vision impairment and eventually, blindness. As the global prevalence of diabetes continues to rise, there is a critical demand for automated diagnostic methods that can swiftly and accurately detect the onset and progression of DR. These automated techniques not only ensure early diagnosis but also hasten the initiation of therapeutic measures, playing a vital role in mitigating the adverse impact of DR on visual health.
Over the past two decades, diabetes prevalence has surged dramatically. According to the International Diabetes Federation's Atlas [1], nearly 500 million individuals of all ages globally are affected. This number is projected to rise to 700 million by 2045, underscoring the global reach of this issue. The IDF Diabetes Atlas predicts that by 2040, one-third of all individuals with diabetes will develop DR, the most common microvascular complication. By then, over 200 million people worldwide are expected to be affected by DR.
Diabetic retinopathy is characterized by retinal damage induced by diabetes. Two forms of DR are recognized: non-proliferative diabetic retinopathy (NPDR) and proliferative diabetic retinopathy (PDR). NPDR, typically causing mild vision loss, provokes macular edema due to the swelling and leaking of small retinal blood vessels. PDR, a more hazardous type of DR, instigates the growth of new blood vessels within the retina, which may rupture and induce severe vision loss and ocular pain. Risk factors for DR include types 1 and 2 diabetes, Hispanic or African ancestry, hypertension, hypercholesterolemia, pregnancy, and familial history of DR. Symptoms include blurred vision, spots and floaters, blind spots in the central retina, and diminished night vision [2].
Early DR symptoms encompass visual impairment and moving spots within the retina. If left untreated, advanced stages of the condition can culminate in total blindness. The disease is signaled by various forms of retinal lesions, including hard exudates, soft exudates, and hemorrhages/microaneurysms. Early detection is often missed in patients, which underscores the importance of regular eye exams, ideally twice a year, to facilitate early treatment and prevent further complications. DR is classified according to severity, with mild cases identified and treated in the early stages, while PDR is typically diagnosed after widespread progression [3].
The advent of machine learning (ML) algorithms and artificial intelligence (AI) technology offers healthcare professionals precise strategies for various diseases and clinical predictions. These include cholesterol, short-term glucose prediction, continuous glucose monitoring, chronic kidney disease, acute lung failure, and cancer. Machine learning, a branch of AI, has significantly simplified early DR detection. Another pervasive method is deep learning [4], which has proven particularly effective in predicting health issues. Deep learning techniques are increasingly utilized in diabetic retinopathy prediction due to their exceptional ability to manage complex data and identify crucial patterns. These techniques allow the automatic extraction of key features from intricate retinal images, obviating the need for manual feature engineering. This capability enables precise generalization and continuous adaptation, crucial for early detection and intervention in a degenerative condition like diabetic retinopathy. Furthermore, deep learning's capacity to detect minute changes, expedite the diagnostic process, and reduce the requirement for expert involvement enhances its effectiveness in improving patient outcomes and minimizing vision loss [5]. These methods routinely predict disease progression at an early stage aiming for optimal, precise results without human intervention, potentially saving millions of lives. Figure 1 illustrates the relationship between DL, ML, and AI.
Figure 1. Similarities among AI, ML, and DL
This research was driven by the desire to improve DR diagnosis from fundus images using DL. Manual diagnosis of these medical images is a labor-intensive process requiring highly trained experts who specialize in diagnosing ocular diseases based on imaging and other evidence. The requirement for such specialized medical professionals makes diagnosis potentially costly. Moreover, given human limitations, only a finite number of patients can be attended to at any given time. Human errors, as with many medical diagnostic techniques, also pose potential problems. Thus, it is often advised that individuals with significant medical concerns seek a second opinion. Considering these limitations, any effort towards automation would result in cost savings, reduced diagnostic errors, and increased throughput, allowing more patients to be attended to around the clock. This does not advocate for replacing experts with automated systems but rather suggests that the results from such a system could assist specialists in treating their patients more efficiently [6].
1.1 Global statistics in diabetic retinopathy
According to the American Diabetes Association (ADA), the utilization of Optical Coherence Tomography (OCT) in diagnosing intraretinal diseases has revolutionized the detection and treatment of diabetic retinopathy. The data derived from OCT allows for a more precise measurement of retinal fundus thickness and the identification of microvascular abnormalities [7]. This highlights the significant public health impact of diabetic retinopathy. Since 1980, the incidence of diabetes mellitus (DM) in men has surged by 110%, and in women, by 58%. These rates are anticipated to rise by 9% and 7.9% worldwide, respectively, in 2014. According to current estimates, an additional 422 million individuals will be diagnosed with diabetes in the coming years, a number that could increase to 629 million by 2045 [8]. The introduction of computer-assisted diagnostic systems could alleviate the workload of eye specialists in routine screenings. In addition, various algorithms, feature extraction methods, and classification techniques are being employed for the early detection of DR [9].
1.2 Objective and motivation of the work
The primary objective of this study is to design a method for automated detection of DR in retinal fundus images. If not diagnosed and treated promptly, DR, a severe complication of diabetes, can result in irreversible vision loss. Traditional DR diagnostic procedures involve a labor-intensive, subjective manual examination of retinal photographs by an ophthalmologist.
The main aim of this research is to devise a computer-aided design (CAD) system that can enable ophthalmologists to diagnose diabetic retinopathy (DR) swiftly and accurately. Deep learning algorithms can be trained to automatically extract relevant information from retinal images, thereby expediting and enhancing the diagnostic process.
Furthermore, in underserved regions where ophthalmologists may be scarce, the application of deep learning for DR detection could facilitate easier access to healthcare for individuals with diabetes. Widespread implementation of CAD systems for screening and early detection of DR is critical to prevent blindness due to diabetes. By improving early detection and treatment, research on DR diagnosis using deep learning techniques could significantly impact public health.
1.3 Organization of the study
The organization of this study is as follows: Section 2 provides a review of research on the application of deep learning in aiding patients with diabetic retinopathy. In Section 3, various deep learning methods and datasets related to DR classification are explored. Section 4 presents the results of performance comparisons using diverse metrics. Section 5 discusses the findings and potential future research directions.
Depending on their focus, researchers on the subject of diabetic retinopathy have made significant contributions. While experts in the fields of healthcare and artificial intelligence have suggested and executed several different machine-learning approaches, a comprehensive comparative evaluation of these DL approaches [10] is still absent concerning the detection and treatment of diabetic retinopathy. Taking into account the outcomes and searching for other ML algorithms for DR, the work as shown to be an innovative technique.
Venkaiahppalaswamy et al. [11] uses an effective hybrid binocular Siamese with a technique based on deep learning to classify the DR picture. First, a step called "pre-processing" is used to get rid of background noise. For this reason, it is important to use a cross-guided bidirectional filter (CGBF). The feature extraction step is there so that features can be extracted from the image that has already been processed. For feature extraction, we construct a wavelet-based Chimp optimization method (WBCOA). Once the features have been found, open-closed watershed management (OCWSM) can be used to divide the optical disc (OD) and blood vessel (BV). In this work, we propose using AlexNet and GoogleNet, both based on the Siamese network architecture, together with a support vector machine for classification. The suggested hybrid DL network uses segmented OD and BV as input. Finally, the retrieved images are assembled, and the model built by the SVM is used to categorize them. The suggested method, which is written in Python, is tested with the DIARETDB1 (DB1) and DIARETDB0 (DB0) datasets. The suggested hybrid DL network worked 94% of the time on DB0 and 94.83% of the time on DB1.
Gunasekaran et al. [12] despite the challenge, identifying diabetes individuals using retinopathy photos was explored. In order to predict DR from fundus pictures, the researchers used a deep recurrent neural network (RNN). Prediction accuracy for DR was 95.5% using the suggested deep learning system.
Khan et al. [13] used transfer learning to create many deep-learning network topologies, including VGG-net, ResNet, and InceptionV3. During preprocessing, the Gaussian technique was utilised to reduce noise and enhance results. We put cases of DR into five groups: none, mild, moderate, severe, and spread. Multiple deep neural network models were evaluated, and the findings revealed that InceptionV3 had the greatest training-phase accuracy (81.2%), and overall accuracy (79.4%).
Baba and Bala [14] suggested a DL-based method for automatically classifying high-resolution fundus pictures for diabetic retinopathy detection. To train the dataset that distinguishes between infected and unaffected retinal pictures, they use the CNN method. The model was trained using 757 colour retinal images, and 151 images were used to test it. To prove the efficacy of the suggested method, simulation results are shown. It has been demonstrated that the proposed convolutional network approach outperforms existing solutions, with 99.5 percent accuracy, 97.5 percent sensitivity, and 91.24 percent precision.
The study of Latchoumi et al. [15] shows how to find certain traits and lesions within a fundus retinal image in a way that is reliable and useful in real life. Elements with comparable intensities were distinguished using geometric properties and relations. Professional imaging and analysis of the retina were performed. Diabetic retinopathy severity, which in turn impacts progression rate, was used to establish exam frequency. Due to a severe lack of qualified monitors, computer-assisted monitoring has become necessary. In their novel approach, the researchers suggest looking for the main arteries and using the points where they cross to estimate the size of the optical disc. The image's color information is utilized for spatial orientation. Blood vessels, exudates, microaneurysms, and haemorrhages were all shown to be easily detected by researchers using a variety of morphological approaches. Optic disc navigation success was 97.1 percent, exudate diagnosis was 95.7 percent sensitive and 94.2 percent specific, and microaneurysm/hemorrhage detection was 95.1 percent sensitive and 90.5 percent specific, using a set of 516 images that differed in a comparison, luminescence, and disorder stages. These are functionally equivalent to existing systems and portend the imminent introduction of advanced technology [15].
Damage to the retina, an area of the eye that detects and responds to light, has been identified as a common diabetes complication known as DR. To detect DR, they first segmented digital fundus images into both vertical and horizontal patches before applying, an already-trained DenseNET model that was used for the analysis. After 10 rounds of validation, the model was accurate 84.90 percent of the time [16].
In this work, Yadav et al. [17] diabetes may be predicted using retinal pictures as input, and a computer vision-based approach is proposed. This aids in the identification of DR at its earliest stages. Pre-processing, the segmentation procedure, and extraction of features are all steps in the processing pipeline for these photos. After the images have been processed, they are classified using machine learning. They found that using the Python programming language improved the outcomes of our experiments. They build the code for our experimental results platform on Jupiter. When tested on datasets available to the public, the proposed system outperformed SVM (87.3%) and CNN (98.50%) in terms of accuracy. The results are competitive with other cutting-edge unsupervised ML techniques. Due to its simplified procedures and improved assessment metrics, it is well suited for use in processing retinal images for the purpose of diagnosing DR.
Math and Fatima [18] used Adaptive ML to build a classification system for diabetic retinopathy. We used a convolutional neural network that had already has been trained to categorize images of diabetic retinopathy in the fundus. Based on experiments on the Kaggle dataset, the algorithm has a sensitivity that is 96.37%, a specificity of 96.37%, as well as an area subject to the ROC curve of 0.963. Table 1 shows the comparative study of related work.
Table 1. A comparative analysis of similar work for detecting diabetic retinopathy using deep learning
|
Authors |
Years |
Title |
Main Method(s) |
Used Dataset(s) |
Findings |
|
Fousiya and Kv [19] |
2022 |
“Using Segmented Fundus Images of the Retinal Vasculature with Attention U-NET to Classify Diabetic Retinopathy” |
Attention U-NET, Res-UNET, and Easy U-NET |
Statistics about People with Blindness, Handy Aptos the year 2019 Blindness Detection Database, as well as Indian Diabetes Retinopathy Dataset. |
The best accuracy attained with the suggested model is 95.6%. |
|
Pamadi et al. [20] |
2022 |
“Using the MobileNetV2 Architecture to Identify Diabetic Retinopathy” |
There are two different types of CNNs. |
Gaussian-filtered fundus images |
Using a pre-trained MobileNetV2 model for transfer learning may further improve accuracy, taking it from 78% for multinomial classification to as high as 97% for binomial classification. |
|
Patra and Singh [21] |
2022 |
“Enhanced ResNet50-InceptionV3 for Diabetic Retinopathy Detection” |
Convolutional Neural Networks (CNNs) |
Eye fundus images |
83.79 percentile accuracy |
|
Karakaya et al. [22] |
2022 |
“Diabetic Retinopathy Detection with Confidentiality Preserving Deep Learning” |
Collaborative learning approach to train CNN models |
There are five picture databases of the retina. |
The sensitivity of DR detection is improved to 93.5%. |
|
Hatode et al. [23] |
2022 |
"Detection of diabetic retinopathy by employing a deep learning algorithm: formulation and validation". |
ResNet-50 deep learning technique |
Kaggle database photos of the retinal fundus |
After the first epoch, you get an accuracy of 90.74 percent, while at the end of the run, you get an accuracy of 91.60 percent. |
|
Kumar and Babu et al. [24] |
2022 |
"Deep Learning Algorithms for DR Detection". |
Densenet-169, The Conv LSTM and Dense-LSTM are all instances of deep learning approaches. |
MESSIDOR dataset |
The findings showed that the Densenet-169 model achieved 94% accuracy, the ConvLSTM (proposed model) achieved 99% accuracy, and the Dense-LSTM model achieved 83% accuracy. |
The dataset that was used and the deep learning methods applied are outlined in this section.
3.1 Dataset description
The dataset used in this study is the diabetic retinopathy dataset, which was obtained from Kaggle. The dataset contains 2750 retinal images that have been categorized into five groups based on the severity of diabetic retinopathy: Healthy (Not DR) with 1000 images, Mild DR with 370 images, Moderate DR with 900 images, Proliferative DR with 290 images, and Severe DR with 190 images. These groups reflect the progression of the disease from healthy retinas to severe cases that involve abnormal growth of blood vessels and possible visual impairment. This dataset can be utilized to teach machine learning algorithms to recognize the severity of diabetic retinopathy by analyzing retinal images, thereby aiding in the early detection and management of the disease. Figure 2 displays a sample of the fundus images database.
Figure 2. Fundus image database
Database categories and the quantity of associated fundus photos are listed in Table 2.
Table 2. Categorization of the images in the database
|
Classes |
Number of Images |
|
Healthy (Not DR) |
1000 |
|
Milder DR |
370 |
|
Moderate DR |
900 |
|
Proliferate DR |
290 |
|
Severe DR |
190 |
Figure 3. Data distribution graph
The above Figure 3 shows a distribution graph of the used diabetic retinopathy dataset. Images can be split into four or five distinct groups according to the degree of DR (shown by the x-axis) and the sheer volume of images (represented by the y-axis). The first category is labeled “Healthy,” which includes 1000 images of eyes that do not show any signs of diabetic retinopathy. The second category is labeled “Mild DR” which includes 370 images, and the third category is labeled “Moderate DR” includes 900 images. And the fourth category labeled “Proliferate DR” includes 290 images, and the fifth and final category labeled “severe DR” includes 190 images of eyes that show the most severe signs of diabetic retinopathy.
3.2 Data preprocessing
A series of data preprocessing and visualization processes for a classification problem involving an image dataset as described in the accompanying code snippets. The ‘cls_df’ list is first populated with class labels that have been taken from the image file paths. The count of photos for each class is then determined by utilizing the pandas data frame ‘data_df’, which is created from this list. A bar chart is used to display the resulting class distribution, with class labels on the x-axis and image counts on the y-axis. The code also shows a selection of the dataset’s first 15 photographs. Matplotlib is used to display the photos in a 3×5 grid after being resized to the typical size of 224×224 pixels and read using OpenCV. Overall, the code carries out tasks in preprocessing such as extracting class labels, generating class-wise image counts, and giving visual cues into the distribution of classes in the dataset and sample photos.
3.2.1 Data splitting
The train_test_split function is utilised to split the data, typically done in machine learning and data analysis. The purpose of this operation is to divide a given dataset into two distinct subsets: a training set (x_train and y_train) and a testing set (x_test and y_test). The training set consists of both image features (train_image_features) and their related labels (train_image_lbls). The test_size option is set to 0.2, which means that 20% of the data will be used for the testing set and 80% for the training set. This data partitioning has various important uses. Offering different datasets for training and testing, it facilitates the evaluation and validation of machine learning models in the first place. The model is trained using the training set, which enables it to recognize patterns and connections in the data. The performance of the model and its generalizability to fresh. unexplored data are evaluated using the testing set, which the model has not seen during training. This method, which divides the data into training and testing sets, helps prevent overfitting by offering an unbiased evaluation of model performance. Overfitting occurs when a model performs well on training data but badly on fresh data.
3.3 Hybrid DRNN (Diabetic Retinopathy Neural Network) model
This work proposed a novel model named is hybrid DRNN model. The hybrid model consisting of ResNet-152 and DenseNet-121 is a deep learning model that incorporates two distinct state-of-the-art architectures, ResNet & DenseNet, to enhance performance on image classification tasks.
To train very deep neural networks, the notion of residual learning was first developed by ResNet (short for Residual Network). ResNet's residual blocks route the input through a shortcut connection that facilitates the gradient's passage through the network, thereby preventing the problem of gradients that dissipate. In this way, ResNet may be used to create very deep neural networks, which are otherwise challenging to train.
The dense connectivity produced by DenseNet feeds forward from one layer to the next. This dense connectivity permits each layer to receive the output of all antecedent layers, allowing the network to capture a greater variety of features at various scales.
Improved performance on image classification tasks was achieved using a hybrid model that incorporates ResNet-152 and DenseNet-121. In particular, the model is built from many layers of ResNet-152 followed by several levels of DenseNet-121, with Each layer having a lot of layers of convolution and pooling layers. The ResNet-152 blocks take high-level data from the picture that comes in, and then more granular features are captured by the DenseNet-121 blocks. Finally, at the network's end, a classification layer is added to obtain the predicted class label as shown in Figure 4, which depicts the architecture of the DRNN model.
Figure 4. Architecture of the DRNN model
Table 3. Model summary
|
Layer (type) |
Output Shape |
Param # |
Connected to |
|
input_layer (InputLayer) |
[(None, 196, 196, 3)] |
0 |
[] |
|
-resnet152 (Functional) |
(None, None, None, 2048) |
58370944 |
['input_layer[0][0]'] |
|
densenet121 (Functional) |
(None, None, None, 1024) |
7037504 |
['input_layer[0][0]'] |
|
flatten (Flatten) |
(None, 100352 |
0 |
['resnet152[0][0]'] |
|
flatten_1 (Flatten) |
(None, 36864) |
0 |
['densenet121[0][0]'] |
|
concatenate (Concatenate) |
(None, 137216) |
0 |
['flatten[0][0]', 'flatten_1[0][0]'] |
|
flatten_2 (Flatten) |
(None, 137216) |
0 |
['concatenate[0][0]'] |
|
dense (Dense) |
(None, 1024) |
140510208 |
['flatten_2[0][0]'] |
|
dense_1 (Dense) |
(None, 1024) |
1049600 |
['dense[0][0]'] |
|
dense_2 (Dense) |
(None, 2) |
2050 |
['dense_1[0][0]'] |
|
Total params |
206,970,306 |
||
|
Trainable params |
206,735,234 |
||
|
Non-trainable params |
235,072 |
||
The state-of-the-art on several image classification benchmarks, including the ImageNet Large Scale Visual Recognition Challenge (ILSVRC) dataset, have been demonstrated with the hybrid ResNet-152/DenseNet-121 model. Moreover, the use of hybrid ResNet/DenseNet architectures has been explored in other medical imaging applications, such as pulmonary nodule detection and breast cancer histopathology image classification, demonstrating the versatility of this approach.
The following Table 3 shows a summary of the proposed DRNN model. In this model of summary, there are 206,970,306 total parameters, 206,735,234 trainable parameters, and 235,072 non-trainable parameters given.
3.4 Classification methods
Diabetic retinopathy fundus image classification using DL has been the subject of a large body of research. In this paper, we have compared some deep learning approaches including CNN [25], RNN [26], deep belief network, and GoogleNet with our novel approach. But, here, we have discussed only two methods i.e., CNN, and RNN.
3.4.1 Convolutional Neural Network or (CNN)
Deep learning is a popular research topic. It's effective across a wide range of data formats. The use of a DL model allows for the creation of a CNN-based image categorization network. Figure 5 depicts the architecture of CNN. In a computer, an image is created by connecting pixels. A collection of pixels may depict the image's edge, shadow, or another pattern. By using convolution, it is feasible to locate these patterns. Each pixel in a picture is represented by a digital matrix that stores and manipulates the image. The matrix of image pixels must be multiplied by a "filter" matrix in order to create spot patterns. The filter size is variable, and the manner in which multiplication is performed by entirely dependent on the filter size. Convolution may be done by beginning with the first pixel in the image's pixel matrix and extracting a portion of it according to the size of the filter. Convolution is then applied to the following image pixel, and this procedure is done as many as necessary until all of the matrix's image pixels have been processed [27].
Convolving is the procedure of combining multiple variables into one. In order to pass on useful information to the next layer, convolution is utilized to generate a feature map. The next sort of layer within the CNN framework is the pooling layer. This layer decreased the output or feature map in order to prevent overfitting. As the most advanced layer, the FCL is the highest classification. This layer "flattens" the result of the layers which came before it so that it can be utilized as an input in the next phase. Batch normalizations can be used to standardize feature maps collected at each stage. Dropouts are sometimes used to hasten computational processes [28].
Figure 5. Basic architecture of the CNN
The edges, a DR categorization characteristic, could be taught to the first layer, whereas the layer with the greatest depth learned to interpret hard exudate. Complex functional mapping that occurs between input and output variables is generated by the network's convolutional blocks, which are activated at the top layer.
Each layer of convolution is followed by a batch of normalization of the output variables. Each block receives an additional batch normalization in sequence as the number of unique feature maps increases.
Layers in CNN:
Based on the layer designs of the network shown in Figure 6, an overview of the primary layers used in a CNN.
Figure 6. Convolutional Neural Network (CNN) layers
3.4.2 Recurrent Neural Network (RNN)
Figure 7. Recurrent neural network architecture
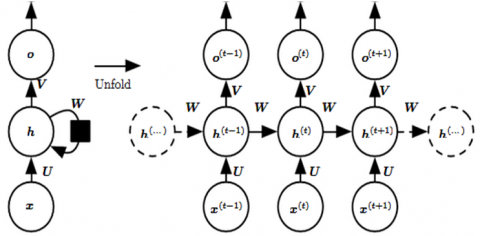
A type of artificial neural network known as recurrent neural network (RNN) is designed to handle a sequence of data, represented as x(t)=x(1), x,..., x, where t is the step number. RNNs are particularly useful for processing speech and language inputs that have a specific order, as illustrated in Figure 7. If we are interested in predicting the next word in an NLP problem, it is necessary to know what words have come before it. Recurrent neural networks, also known as RNNs, are so-called because they do the same thing for each item in a series, and the result depends on what they did before. RNNs can also be thought of as having a "memory" that keeps track of all that has been computed so far [29].
A notation for an RNN may be seen on the left side of the image above, while the unrolling of an RNN into its full network can be seen on the right. With "unroll," we mean to delete the series's network from our DVRs. The network will be unfurled into a three-layer network of neurons, with a single layer corresponding to each of the words, if the pattern we are interested in is a three-word sentence.
Working of RNN:
With the assistance of the following example, you can see how an RNN works as shown in Figure 8:
Example:
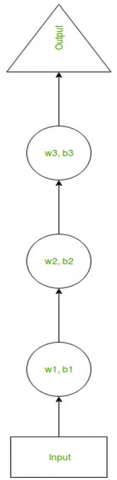
Complex networks may have more than one input layer, multiple intermediate layers, and a single output layer. Thus, biases and weights for Hidden Layer 1 could be (w1, b1), Hidden Layer 2 could be (w2, b2), and Hidden Layer 3 could be (w3, b3), similar to other types of neural networks. Each of these levels is self-contained, meaning it does not rely on the results of other layers.
Figure 8. Weight distribution in RNN
Currently, the RNN will act as follows depicted in Figure 9:
Figure 9. Looping mechanism in RNN
A Method for Evaluating the present situation:
$h_t=\mathrm{f}\left\{h_{t-1}+X_t\right)$ (1)
where, ht present state, ht-1 preceding state, xt input state.
Here is the equation for the activated function (tanh):
$h_t=\tanh \left(W h h h_{t-1}+W x h X_t\right)$ (2)
Weight at the recurrent nerve (Whh) and weight at the input (Wxh) to a nerve cell.
The technique for calculating output is
$\mathrm{yt}=$ Whyht (3)
where, Yt Outcome, Why Output weighting layer.
RNN is used for training
3.5 Proposed system flowchart
This section detailed a proposed flowchart for this system's implementation.
3.6 Pseudocode of the proposed model
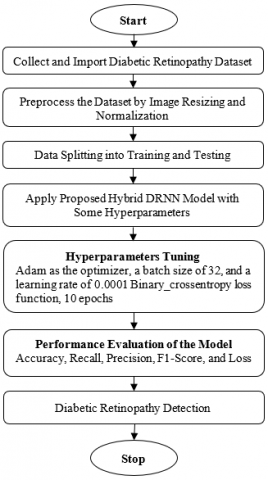
Figure 10, shows the flow of the proposed DRNN model.
Start
Stop
Figure 10. Working flowchart of the proposed methodology
The experimented and simulated results are provided in this section with their interpretation based on the diabetic retinopathy dataset and also presents the comparison with some deep learning classifiers.
Figure 11 shows the proposed DRNN model’s accuracy trends as shown for both the training and validation stages. The y-axis efficiently measures the accuracy of predictions, while the x-axis beautifully traces the epochs. The extraordinary result of 99.86% accuracy during training and 96.91% accuracy during validation is highlighted.
The training and validation loss trends for the proposed DRNN model are depicted in Figure 12 with elegance. Epochs are accurately counted on the X-axis, and the varying loss values are expertly captured on the y-axis. A tiny training loss of 0.0032 and a minimal validation loss of 0.1324 are impressively revealed by the image.
A DRNN model confusion matrix is displayed in Figure 13. This confusion matrix illustrates the connection between the correct label and the, and predicted label with respect to the two classes i.e., healthy and DR. We are able to observe that the total number predicted to be Healthy or DR is 533, and the misclassification number is 17 in a hybrid model.
Figure 11. Training and validation accuracy of DRNN model
Figure 12. Training and validation loss of DRNN model
Figure 13. Confusion matrix loss of the DRNN model
Figure 14 shows the heatmap of DRNN model, heatmap illustrates the connection between the correct label and predicted label concerning the two classes i.e., healthy and DR.
The performance metrics of the proposed DRNN model are painstakingly outlined in Table 4, which includes both training and validation datasets. With a peak training accuracy of 99.86%, validation accuracy of 96.91%, training loss of 0.0032, and validation loss of 0.1324, these results demonstrate the model’s strength.
Figure 14. Heatmap of the proposed DRNN model
Table 4. Performance results of the proposed DRNN model
|
Model |
Training Accuracy |
Training Loss |
Validation Accuracy |
Validation Loss |
|
DRNN |
0.9986 |
0.0032 |
0.9691 |
0.1324 |
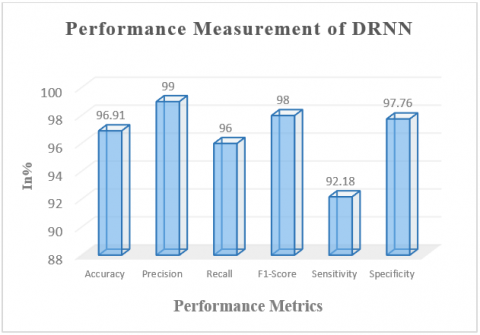
The performance characteristics of the DRNN model on a classification task as shown in the following Table 5, which is based on Precision, Recall, F1-Score, Sensitivity, and Specificity. From this table, the DRNN model has obtained the highest 99% of precision, 96% of recall, 98% of f1-score, 92.18% of sensitivity, and 97.76% of specificity, respectively.
Figure 15 skillfully integrates many critical performance indicators into a thorough performance evaluation of the suggested DRNN model. The graph skillfully illustrates the model’s multifaceted competency by interpreting accuracy, precision, and specificity.
Table 5. Evaluation findings for the DRNN model using other performance metrics
|
Model |
Precision |
Recall |
F1-Score |
Sensitivity |
Specificity |
|
DRNN |
99% |
96% |
98% |
92.18% |
97.76% |
Figure 15. Performance measuring graph of the DRNN model
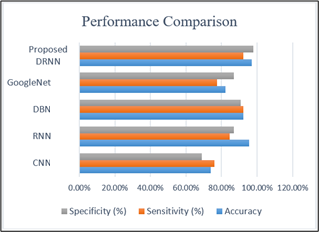
In Table 6, compares the accuracy, sensitivity and specificity of various deep learning approaches, including CNN, RNN, DBN, GoogleNet, and the proposed DRNN model. The CNN model has an accuracy of 73.81%, a sensitivity of 76.0%, and a specificity of 69.5%. With 95.48% accuracy, 84.54% sensitivity, and 86.81% specificity, the RNN model surpasses. The DBN Model has an accuracy of 92.12%, a sensitivity of 92.22%, and a specificity of 90.75%. GoogleNet has an accuracy of 82.18%, a sensitivity of 77.56%, and a specificity of 86.84%. Notably, the suggested DRNN model outperforms the previous models in terms of accuracy, sensitivity, and specificity, with 96.91% accuracy, 92.18% sensitivity, and 97.76% specificity.
Table 6. Comparative performance results of different DL methods
|
DL Models |
Accuracy |
Sensitivity (%) |
Specificity (%) |
|
CNN [30] |
73.81% |
76% |
69% |
|
RNN [31] |
95.48% |
84.54% |
86.81% |
|
DBN [32] |
92.12% |
92.22% |
90.75% |
|
GoogleNet [33] |
82.18% |
77.56% |
86.84% |
|
Proposed DRNN Model |
96.91% |
92.18% |
97.76% |
Figure 16. Performance comparison graph
The core of performance comparison among several deep learning models is brilliantly shows in Figure 16, which brings us to a close. This graph, which demonstrates sensitivity, specificity, and accuracy, clearly demonstrates the proposed DRNN model’s superior abilities. It also shows that it has the highest values for sensitivity, specificity, and accuracy.
Patients with DR who receive therapy and diagnosis later are more inclined to lose their vision. Early warning signs must be identified before the disease's severity can be established, at which point the appropriate course of treatment can be chosen. The project focus on using an algorithm based on deep learning to classify DR fundus photos according to severity. Deep learning is thought to be a useful method for predicting and categorizing diseases on a technical level. A more typical eye problem is diabetic retinopathy (DR), which is brought on by elevated blood sugar. Over half of people under 70 worldwide have diabetes. Despite early diagnosis and treatment, DR patients typically lose their vision. The severity of the issue must be determined after identifying the warning signs in order to select the finest course of action. In this research, the severity of DR fundus images is classified using deep learning. This study presents a new method that uses DRNNs. which is built using two different deep learning models i.e., ResNet152, and DenseNet-121 for categorizing fundus DR images. In addition, this paper also reviewed some deep-learning-based approaches such as CNNs, RNNs, DBNs, and GoogleNet for use with fundus pictures in the diagnosis of diabetic retinopathy. This paper uses the diabetic retinopathy dataset to test the performance metrics for the model, such as sensitivity, recall, f1-score, accuracy, specificity, and precision. The proposed DRNN model obtained the highest 96.91% of accuracy, whereas the other models have 73.81% accuracy for CNN, 95.48% accuracy for RNN, 92.12% accuracy for DBN, and 82.18% accuracy for GoogleNet, respectively. It is clearly shown that the proposed DRNN model outperformed the other models.
This project effectively finds diabetes by using deep learning on pictures of the fundus. It could be used in the future as one way to find diabetes. In the future, work will be done to improve the classification of DR by using the most recent deep learning methods rather than human grading to find cases of diabetic retinopathy.
The aforementioned works have made significant contributions to the field of diabetic retinopathy (DR) detection by utilizing deep learning techniques. However, it is vital to thoroughly evaluate the potential limits of their techniques. One major disadvantage is the lack of comprehensive comparison of a wide range of deep learning models, which may limit comprehension of the full range of possibilities. Furthermore, while the datasets used in these studies show promising results, they may not fully represent the diversity and complexity experienced in real-world clinical circumstances. This could have an impact on the data's generalizability to larger patient populations.
Another problem is the only dependence on image-based studies, which may omit critical clinical and contextual information that clinicians generally evaluate when diagnosing and managing DR. Considering these constraints, the interpretation of the findings should be handled with a balanced viewpoint that respects these restraints. Researchers not only display a critical grasp of their work by publicly recognizing and sharing these limits, but they also pave the path for future investigations to overcome these issues. As a result, the field can develop towards more strong, comprehensive, and practically applicable solutions that take into account the multidimensional nature of diabetic retinopathy and its diagnosis.
The recent study on diabetic retinopathy (DR) detection using deep learning reveals intriguing future research directions. Researchers can build on these findings to improve the accuracy and feasibility of DR diagnosis. Opportunities include multi-class categorization refinement, clinical data integration for tailored diagnoses, and the development of interpretable models. Data augmentation and transfer learning techniques can improve model performance, while real-time diagnostics and longitudinal tracking have the potential to revolutionize management. Integrating various imaging methodologies and addressing ethical concerns can help ensure that these technologies are used responsibly.
[1] Sebastian, A., Elharrouss, O., Al-Maadeed, S., Almaadeed, N. (2023). A survey on deep-learning-based diabetic retinopathy classification. Diagnostics, 13(3): 345. https://doi.org/10.3390/diagnostics13030345
[2] Bajwa, A., Nosheen, N., Talpur, K.I., Akram, S. (2023). A prospective study on diabetic retinopathy detection based on modify convolutional neural network using fundus images at Sindh institute of ophthalmology & visual sciences. Diagnostics, 13(3): 393. https://doi.org/10.3390/diagnostics13030393
[3] Gadekallu, T.R., Khare, N., Bhattacharya, S., Singh, S., Maddikunta, P.K.R., Srivastava, G. (2020). Deep neural networks to predict diabetic retinopathy. Journal of Ambient Intelligence and Humanized Computing, 14: 5407-5420. https://doi.org/10.1007/s12652-020-01963-7
[4] Rohilla, V., Kaur, M., Chakraborty, S. (2022). An empirical framework for recommendation-based location services using deep learning. Engineering, Technology & Applied Science Research, 12(5): 9186-9191. https://doi.org/10.48084/etasr.5126
[5] Rohilla, V., Chakraborty, S., Kumar, R. (2019). Random Forest with harmony search optimization for location based advertising. International Journal of Innovative Technology and Exploring Engineering, 8(9): https://doi.org/10.35940/ijitee.i7761.078919
[6] Butt, M.M., Iskandar, D.A., Abdelhamid, S.E., Latif, G., Alghazo, R. (2022). Diabetic retinopathy detection from fundus images of the eye using hybrid deep learning features. Diagnostics, 12(7): 1607. https://doi.org/10.3390/diagnostics12071607
[7] Solomon, S.D., Chew, E., Duh, E.J., Sobrin, L., Sun, J. K., VanderBeek, B.L., Gardner, T.W. (2017). Diabetic retinopathy: A position statement by the American Diabetes Association. Diabetes Care, 40(3): 412-418. https://doi.org/10.2337/dc16-2641
[8] Cheloni, R., Gandolfi, S.A., Signorelli, C., Odone, A. (2019). Global prevalence of diabetic retinopathy: protocol for a systematic review and meta-analysis. BMJ Open, 9(3): e022188. https://doi.org/10.1136/bmjopen-2018-022188
[9] Mookiah, M.R.K., Acharya, U.R., Chua, C.K., Lim, C.M., Ng, E.Y.K., Laude, A. (2013). Computer-aided diagnosis of diabetic retinopathy: A review. Computers in Biology and Medicine, 43(12): 2136-2155. https://doi.org/10.1016/j.compbiomed.2013.10.007
[10] Rohilla, V., Chakraborty, S., Kumar, R. (2022). Deep learning based feature extraction and a bidirectional hybrid optimized model for location based advertising. Multimedia Tools and Applications, 81: 16067-16095. https://doi.org/10.1007/s11042-022-12457-3
[11] Venkaiahppalaswamy, B., Reddy, P.P., Batha, S. (2023). Hybrid deep learning approaches for the detection of diabetic retinopathy using optimized wavelet based model. Biomedical Signal Processing and Control, 79: 104146. https://doi.org/10.1016/j.bspc.2022.104146
[12] Gunasekaran, K., Pitchai, R., Chaitanya, G.K., Selvaraj, D., Annie Sheryl, S., Almoallim, H.S., Tesemma, B.G. (2022). A deep learning framework for earlier prediction of diabetic retinopathy from fundus photographs. BioMed Research International, 2022: Article ID 3163496. https://doi.org/10.1155/2022/3163496
[13] Khan, A., Kulkarni, N., Kumar, A., Kamat, A. (2022). D-CNN and image processing based approach for diabetic retinopathy classification. In Applied Information Processing Systems: Proceedings of ICCET 2021, Lonere, India, pp. 283-291. https://doi.org/10.1007/978-981-16-2008-9_27
[14] Baba, S.M., Bala, I. (2022). Detection of diabetic retinopathy with retinal images using CNN. In 2022 6th International Conference on Intelligent Computing and Control Systems (ICICCS), Madurai, India, pp. 1074-1080. https://doi.org/10.1109/ICICCS53718.2022.9788368
[15] Latchoumi, T.P., Kumar, A.S.D., Raja, J.Y. (2022). Detection of diabetic retinopathy with ground-truth segmentation using fundus image. In 2022 7th International Conference on Communication and Electronics Systems (ICCES), Coimbatore, India, pp. 1770-1774. https://doi.org/10.1109/ICCES54183.2022.9835848
[16] Kobat, S.G., Baygin, N., Yusufoglu, E., Baygin, M., Barua, P.D., Dogan, S., Acharya, U.R. (2022). Automated diabetic retinopathy detection using horizontal and vertical patch division-based pre-trained DenseNET with digital fundus images. Diagnostics, 12(8): 1975. https://doi.org/10.3390/diagnostics12081975
[17] Yadav, M., Goel, R., Rajeswari, D. (2021). A deep learning based diabetic retinopathy detection from retinal images. In 2021 International Conference on Intelligent Technologies (CONIT), Hubli, India, pp. 1-5. https://doi.org/10.1109/CONIT51480.2021.9498502
[18] Math, L., Fatima, R. (2021). Adaptive machine learning classification for diabetic retinopathy. Multimedia Tools and Applications, 80(4): 5173-5186. https://doi.org/10.1007/s11042-020-09793-7
[19] Fousiya, T.T., Kv, A.M. (2022). Diabetic retinopathy classification based on segmented retinal vasculature of fundus images using attention U-NET. In 2022 IEEE 19th India Council International Conference (INDICON), Kochi, India, pp. 1-6. https://doi.org/10.1109/INDICON56171.2022.10039734
[20] Pamadi, A.M., Ravishankar, A., Nithya, P.A., Jahnavi, G., Kathavate, S. (2022). Diabetic retinopathy detection using mobilenetv2 architecture. In 2022 International Conference on Smart Technologies and Systems for Next Generation Computing (ICSTSN), Villupuram, India, pp. 1-5. https://doi.org/10.1109/ICSTSN53084.2022.9761289
[21] Patra, P., Singh, T. (2022). Diabetic retinopathy detection using an improved ResNet50-InceptionV3 structure. In 2022 13th International Conference on Computing Communication and Networking Technologies (ICCCNT), Kharagpur, India, pp. 1-6. https://doi.org/10.1109/ICCCNT54827.2022.9984253
[22] Karakaya, M., Aygun, R.S., Sallam, A.B. (2022). Collaborative deep learning for privacy preserving diabetic retinopathy detection. In 2022 44th Annual International Conference of the IEEE Engineering in Medicine & Biology Society (EMBC), Glasgow, Scotland, United Kingdom, pp. 2181-2184. https://doi.org/10.1109/EMBC48229.2022.9871617
[23] Hatode, P., Edinburgh, M.M., Jha, M. (2022). Evolution and testimony of deep learning algorithm for diabetic retinopathy detection. In 2022 5th International Conference on Advances in Science and Technology (ICAST), Mumbai, India, pp. 122-126. https://doi.org/10.1109/ICAST55766.2022.10039538.
[24] Kumar, A.V., Babu, A.S. (2022). Diabetic retinopathy detection using deep learning methodology. 2022 IEEE 3rd Global Conference for Advancement in Technology (GCAT), Bangalore, India, pp. https://doi.org/10.1109/GCAT55367.2022.9971891
[25] Wu, M., Lu, Y., Yang, W., Wong, S.Y. (2021). A study on arrhythmia via ECG signal classification using the convolutional neural network. Frontiers in Computational Neuroscience, 14: 564015. https://doi.org/10.3389/fncom.2020.564015
[26] Guerroum, M., Zegrari, M., Masmoudi, M., Berquedich, M., Elmahjoub, A.A. (2022). Machine learning technics for remaining useful life prediction using diagnosis data: a case study of a jaw crusher. International Journal of Emerging Technology and Advanced Engineering, 12(10): 122-135. https://doi.org/10.46338/ijetae1022_14
[27] Yamashita, R., Nishio, M., Do, R.K.G., Togashi, K. (2018). Convolutional neural networks: An overview and application in radiology. Insights Into Imaging, 9: 611-629. https://doi.org/10.1007/s13244-018-0639-9
[28] Khan, A.S., Augustine, P. (2019). Predictive analytics in cryptocurrency using neural networks: A comparative study. International Journal of Recent Technology and Engineering, 7(6): 425-429.
[29] Lin, M., Chen, Q., Yan, S. (2013). Network in network. arXiv preprint arXiv:1312.4400. https://doi.org/10.48550/arXiv.1312.4400
[30] Hassan, H.A., Yaakob, M., Ismail, S., Abd Rahman, J., Rusni, I.M., Zabidi, A., Shafie, S.M. (2020). Detection of proliferative diabetic retinopathy in fundus images using convolution neural network. In IOP Conference Series: Materials Science and Engineering, 769: 012029. https://doi.org/10.1088/1757-899X/769/1/012029
[31] Latha, D., Bell, T.B., Sheela, C.J.J. (2022). Red lesion in fundus image with hexagonal pattern feature and two-level segmentation. Multimedia Tools and Applications, 81(18): 26143-26161. https://doi.org/10.1007/s11042-022-12667-9
[32] Athalye, S.S., Vijay, G. (2022). Taylor series-based deep belief network for automatic classification of diabetic retinopathy using retinal fundus images. International Journal of Imaging Systems and Technology, 32(3): 882-901. https://doi.org/10.1002/ima.22691.
[33] Raj, M.A.H., Al Mamun, M., Faruk, M.F. (2020). CNN based diabetic retinopathy status prediction using fundus images. In 2020 IEEE Region 10 Symposium (TENSYMP), Dhaka, Bangladesh, pp. 190-193. https://doi.org/10.1109/TENSYMP50017.2020.9230974