Saisanthiya Dharmichand![]() | Supraja Perumal*
| Supraja Perumal*![]()
© 2023 IIETA. This article is published by IIETA and is licensed under the CC BY 4.0 license (http://creativecommons.org/licenses/by/4.0/).
OPEN ACCESS
In the recent past, significant strides have been made in the field of deep learning and data fusion, enabling computers to comprehend, identify, and analyse human emotions with remarkable precision. However, reliance on external biological features for emotion recognition can be misleading, as individuals may consciously or unconsciously mask their true emotions. Consequently, an objective and reliable approach is sought, one that draws on physiological markers for emotion recognition. This paper introduces a novel model, the Tripartite Tier Convolutional Neural Network (TTCNN), specifically designed to leverage deep learning methods for the extraction and classification of significant features in multimodal emotion recognition. Amongst various physiological features, this study prioritizes eye movement and Electroencephalogram (EEG) data due to their robust potential to reflect emotional states. The multimodal data-based feature extraction facilitated by the TTCNN model yields a comprehensive set of features, enhancing the effectiveness of emotion classification into categories such as disgust, fear, sadness, happiness, and neutrality. This innovative cognitive approach has been evaluated using two established datasets, SEED and DEAP. The performance of the TTCNN model demonstrates its efficacy, achieving an impressive 95.84% classification accuracy on the SEED dataset and 87.01% on the DEAP dataset. These results significantly outperform existing state-of-the-art methods, underscoring the TTCNN model's potential as a robust tool for human emotion recognition. This research contributes to the advancement of computer-aided emotion analysis, presenting a significant step forward in the field and opening up potential applications in diverse areas such as psychology, healthcare, and human-computer interaction.
tripartite tier convolutional neural network, classification, emotion recognition, cognitive approach, electroencephalogram, multimodal data
Emotions, by their nature, significantly influence interpersonal communication. They represent complex mental or behavioural states, signifying people's beliefs and attitudes [1]. While humans can naturally recognize emotions, machines find this task more challenging. Building systems that understand, interpret, and respond appropriately to human emotions establishes a more natural connection between robots and people. A physiological theory identifies six generally recognized emotions - joy, sadness, surprise, disgust, fear, and anger - based on inherent body responses. Emotions can dramatically change the interpretation of communication, making emotion recognition a growing field of interest across various domains, crucial for the enhancement of interactivity between humans and computers.
Emotions, as complex psycho-physiological processes, have intricate connections to both internal reactions and external behavior. While significant research exists on automatic identification systems based on facial or auditory features, the integration of these modalities has seen relatively less exploration. Previous studies, focusing primarily on brain or peripheral signals, have highlighted that a single modality cannot fully describe emotional states, nor provide complementary information to other modes [2].
Traditional approaches to emotion recognition include facial analysis, non-verbal communication, and voice analysis; however, these methods are susceptible to intentional deception. Physiological parameters, stemming from innate body responses are less prone to deceit. Techniques like EEG and functional Magnetic Resonance Imaging (fMRI) measure the association between cerebral blood flow and neuronal activity in the brain. For instance, when a specific brain region is active, blood flow to that area increases.
Single-channel analysis, a technique where EEG features are extracted from multiple brain regions individually within each EEG channel, is predominant in EEG-based emotion recognition research [3]. However, cognitive science and neuroimaging research demonstrate that the complex behavioral and physiological response of emotion involves circuits across various brain regions. Moreover, neuroscience and neuropsychiatry research indicate that individuals with cognitive impairment and psychophysiological disorders like mental retardation, mental illness, and chronic depression show reduced functional connectivity in the brain, as determined by fMRI and brain imaging spectroscopy. Furthermore, fMRI-based neuroimaging studies suggest that functional brain connectivity might reflect fingerprints in profiling personalities and an individual's attention span. These findings reinforce the connection between cognition and brain function connectivity.
Existing research in emotion recognition has primarily focused on either behavioral modeling or physiological modalities, but seldom the integration of the two. Behavioral modelling, including facial expressions and body language, offers valuable emotional cues but is often subjective and influenced by cultural and contextual factors. Physiological modalities like heart rate and skin conductance provide objective measures but may lack specificity when used in isolation. Bridging this research gap through the integration of behavioral and physiological modalities could lead to a more comprehensive, robust emotion recognition system. Such a system would have the potential to discern subtle emotional states, enhancing applications in mental health, human-computer interaction, and affective computing.
Emotion detection techniques are primarily categorized into two main types based on the modalities employed: internal physiological signals such as EEG and ECG, and external behavioral signals such as facial expressions and speech [3]. These internal and external signals possess their unique characteristics. While data collection for external behavioral signals is relatively straightforward, it may not offer the same accuracy as internal physiological signals. The latter are considered more reliable and objective when expressing emotions. Among different physiological modalities, Electroencephalography (EEG) stands out for its remarkable performance in recognizing human emotions, offering promising insights into neural mechanisms.
Eye-tracking data mainly reflects observable behavior, providing indirect insights into cognitive and thinking processes. Since behavior is the outcome of complex brain activities, interpreting eye-tracking data is inherently multifaceted and challenging. Successful eye-tracking research requires meticulous experimental design for accurate data interpretation. This may involve integrating interviews or retrospective tests to gain insights into cognitive processes. For instance, one study demonstrated that combining EEG and eye-tracking is effective in studying natural and attention-shifting phenomena [4, 5]. Another study reported that relying solely on EEG data for predicting self-regulation may not accurately discern emotional responses to affective stimuli [6]. Furthermore, Electrooculography (EOG) signals obtained through EEG networks can yield results as precise as conventional optical eye-tracking devices, simultaneously assessing neural activity during all types of eye movements [7]. Eye data is often considered the simplest and most effective modality due to its automatic reactions to psychological activity. Therefore, the integration of EEG data synchronized with eye-tracking can overcome the limitations of single-detection methods, offering enhanced value in emotion recognition.
Common physiological parameters monitored using current consumer sensors include heart rate, respiration rate, blood pressure, and temperature. Emotion classification often employs machine learning approaches such as Support Vector Machine (SVM), Linear and Nonlinear Algorithms, Decision Trees, and K-Nearest Neighbor (KNN). These techniques have varying degrees of accuracy. Recently, emotion classification has been explored using Deep Learning (DL) based methods, which combine Long-Short Term Memory (LSTM), Deep neural Long-Short Term Memory, and Convolutional Neural Networks (CNN) (CLSTM), BDAE, MESAE, and Deep Canonical Correlation Analysis (DCCA) [6]. DL-based methods offer the highest recognition rates, particularly when a large amount of correctly identified data is available. Multimodal emotion recognition methods accurately classify emotions by combining the predictive capacities of individual behavioral and physiological characteristics. However, these methods are more complex than unimodal emotion detection systems due to the requirement for concurrent processing of multiple input sources.
Prediction accuracy varies widely even among multimodal methods, necessitating robust methodologies. As a result, the use of multimodal signal fusion has gradually increased in emotion recognition [7]. The proposed system independently analyzes each model and combines the features to create a multimodal representation.
The rest of the paper is structured as follows: Section 2 surveys existing research on multimodal emotion recognition. Section 3 details the proposed emotion recognition method. Section 4 presents the experimental results and discussion, with the conclusion provided in Section 5.
Traditional emotion detection techniques primarily utilize external characteristics such as facial expressions, body gestures, and vocal tones. The collection of these signals does not require wearing sensors, thus they can be easily and inexpensively captured. The authors applied the Naive Bayes method to identify six distinct emotions: surprise, anger, contempt, fear, sadness, and neutrality [8]. Emotion detection accuracy, when comparing facial expressions of different individuals, stands at 64.3%. However, when evaluating the same individual, the accuracy rate escalates to 93.2%, illustrating that facial expressions can be leveraged effectively to identify emotions. However, these external signals are highly sensitive and can be easily influenced by the testers' subjective variables. The system fails to make an accurate evaluation when there is a conflict between the subject's actual emotions and external manifestations. Moreover, external manifestation represents only a subset of emotional expression, and does not fully encompass the breadth of human emotions [9]. The individual's central nervous system, which regulates physiological changes, can more objectively represent the individual's emotional state. Consequently, the use of physiological signals for emotion recognition is an emerging research trend in affective computing.
Over the years, emotion recognition experiments have been conducted using various signals such as EEG, Electromyogram (EMG), Galvanic Skin Responses (GSR), Electrooculogram (EOG), electrocardiogram (ECG), pulse rate, blood vessel resistance pulse, skin temperature, and facial expressions [10]. Thanks to the physiologically-based emotion detection technique, the data collected accurately reflect the participants' emotional states [11]. The novel emotion recognition method proposed in this paper categorizes emotions into three groups based on the signals used: EEG signals and eye movement data.
2.1 EEG signals
EEG-based emotion detection algorithms are typically categorized into supervised learning and unsupervised learning. In unsupervised learning, the sample data does not include any labels. Using a predetermined procedure, researchers automatically classify all samples and then assign subsequent labels. Unsupervised learning techniques such as K-means, fuzzy C-means (FCM), and self-organizing methods are commonly employed [12].
Researchers automatically classify all samples according to a predetermined procedure and then apply corresponding labels. Frequently utilized unsupervised learning methods include K-means, fuzzy C-means (FCM), and self-organization methods [13]. For each instance within the entire data set, we can calculate the critical connection matrices based on the five critical sub-networks in the corresponding bandwidths. If an edge is part of the critical subnetwork, its associated weight in the matrix remains untouched; otherwise, it is reduced to zero, removing that connection from the neural circuit [14]. The three topological metrics - strength, clustering coefficient, and eigenvector centrality - were obtained from the key connectivity matrix using the Brain Connectivity Toolbox [15].
The study [16] used heart rate data derived from ECG signals to perform valence-arousal emotion recognition. Ranjani and Supraja [17] doubled the accuracy of EEG-based emotion recognition by combining feature ranking based on mutual information and kernel classifiers. The study [18] developed a system for recognizing genuine feature emotions that can be continuously represented within the valence-arousal space, identifying discrete emotional states. The method for identifying emotions via Electroencephalography (EEG) proposed by Kulke et al. [5] is grounded on a systematic evaluation for feature extraction, feature selection, and classification models. Their findings revealed consistent neural patterns both within and across periods. EEG has shown potential as a modality for emotion recognition, demonstrating its ability to elucidate the neural mechanisms underlying emotion processing. Conventional methods for acquiring EEG data can be divided into frequency, temporal, and time-frequency domains. Raw EEG signals often contain considerable artifacts and noise, necessitating pre-processing for their elimination. Subsequently, different features are extracted for emotion classification. However, these studies were all conducted using a single channel, and did not consider the functional connectivity networks associated with different emotions. Functional connectivity patterns from brain networks indeed exist as specific connectivity patterns for emotional states in affective computing. Our network utilizes brain functional connectivity patterns derived from EEG features to classify emotional states such as happiness, sadness, neutrality, disgust, and fear.
2.2 Facial features
Emotion recognition should consider the context and not solely rely on external appearances, while overlooking the intrinsic characteristics and connotations of emotions. Eye movement features can yield a wealth of information about an individual's ocular activity [19]. They can guide systems to monitor users' subtle subconscious behaviors, offering crucial context for the users' current activities. Eye-tracking is a method for recording an individual's eye movements. Using this approach, one can determine the subject's gaze position at any given moment, as well as the trajectory of the eyes over a specific time period.
As proposed by Li et al. [20], pupil dilation responses can express emotional valence and reflect confidence in decision-making. The integration of differential entropy and pupil diameter parameters was able to discern negative, positive, and neutral emotions using EEG and eye measurement data. The present research employs complementary representations of eye movement data and EEG connectivity features for further investigation.
2.3 Multimodal emotion recognition
The multimodal combination model aims to recognize emotions by integrating physiological data. This approach evaluates the effectiveness of a Convolutional Neural Network (CNN) with Auto Encoder units for facial expression recognition. The combination of these two Deep Learning methodologies improves the classification performance by 34.6% [21]. In a study, it was found that 34.6% of individuals reported clinical depression, while the rest had anxiety or other mental illnesses. For negative emotions such as sadness and fear, the accuracy of Emotion Recognition (ER) decreased with age in large clinical samples of individuals with emotional disorders [22]. The emotion detection rate of the multimodal combination model surpasses that of the individual modal models [23].
Deep Neural Networks (DNNs) have been employed to address the problem of emotion recognition. A study [24] proposed combining DNNs with hypergraphs for image-based emotion recognition. In this approach, each node in the final fully connected layer was considered as a feature, forming a hyperedge in a hypergraph [17]. Another study utilized CNNs and Recurrent Neural Networks (RNNs) to identify categorical emotions in videos. Initially, a CNN was trained to recognize static emotional expressions. The features obtained from the CNN were then used to train an RNN to generate an emotion for the video. Emotion recognition using audio and visual modalities has shown promising results.
Some research proposed four distinct Deep Belief Network (DBN) architectures, one of which was a basic 2-layer DBN, while the others were variations of it. This paper suggests a multimodal emotion recognition method using a Temporal Topology Convolutional Neural Network (TTCNN) [25]. This approach aims to address the shortcomings of previous studies' single-modality and low accuracy.
2.4 Functional connectivity of the brain
Neuroscience and neuroimaging have long been used to delve deeper into brain-computer interaction and enhance our understanding of the brain. Brain connectivity can be categorized into three types: structural, functional, and effective [26]. These categories respectively deal with the potential directed influence among neural elements, statistical relationships between physically disparate areas of the brain, and the biophysical coupling of neurons or neural elements. It has been observed that certain psychophysiological illnesses and cognitive deficiencies are connected with the brain's functional connectivity.
In a study [27], strong EEG connectivity patterns were discovered in individuals with autism spectrum disorders while at rest. Another study [28] found that functional connectivity in schizophrenia is slower and less efficient. Adolescent sadness [22] has been associated with rigidly increased connections in the default mode network based on fMRI data. According to Whitton et al., increases in EEG-based brain networks could represent a neurobiological pattern for chronic illness in severe depression. However, while researchers have investigated the link between brain networks and emotions, it remains unclear whether distinct emotional states correspond to specific connectivity patterns.
Only a few pioneering studies on EEG-based emotion recognition have utilized multichannel EEG analysis. For instance, a study [11] used the phase-locking value as a measure of connectivity to differentiate between positive and negative emotions. Another research [29] employed correlation, coherence, and phase synchronization index as three measures of connectivity to characterize emotions. An exploration of three emotions using action features and functional connections was undertaken in literature [30]. From this literature [31], three connectivity matrices — Phase-locking value, correlation, and phase lag index — were described using a Convolutional Neural Network (CNN). However, these studies either overlooked or did not take into consideration the aspects of functional connectivity related to emotions.
Based on prior research on brain's functional connectivity patterns, this study aims to identify emotions found in the brain networks for each of the five emotions [22]. This research extends previous work to multimodal emotion recognition tasks with three classes (sadness, happiness, and neutrality), and five classes respectively.
Eye movement data and EEG signal data have to be pre-processed to identify the most relevant features.
3.1 EEG signal pre-processing
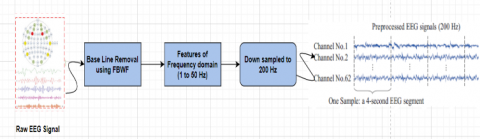
It might be challenging to filter and analyze emotion-relevant brain neural activity because the raw EEG data collected when testing for emotions is frequently high-resolution and tainted by artifacts shown in Figure 1. Application of a bandpass filter between 1 and 50 Hz and baseline correction was performed on the raw EEG data as part of pre-processing. To expedite the analysis, the EEG waves were then quantized to 200 Hz. To filter the EEG data, five frequency bandpass filters were used: delta (0.5–4 Hz), theta (4–8 Hz), alpha (8–12 Hz), beta (12–30 Hz), and gamma (30 Hz or more).
First, the EEG and eye movement data are collected and segmented into epochs, typically aligned with stimulus presentation. Baseline correction is applied to remove baseline drift, and filtering techniques may be used to isolate desired frequency components in EEG signals. Concurrently, eye movement data can be pre-processed with filtering or smoothing methods to reduce noise.
Next, connectivity metrics are computed to assess the interactions between EEG channels. For instance, spectral coherence, a common connectivity metric, quantifies the degree of synchronization between two EEG channels at specific frequency bands using the formula:
${Coh}(i, j, f)=\mid {Pxy}(i, j, k) 2-({Pxx}(i, f) * \mid {Pyy}(j, f))$ (1)
where, Coh(i,j,f) is the spectral coherence between channels i and j at frequency k, and Pxy(i,j,k), Pxy(i,f), and Pyy(j,f)) are the cross-spectral density and auto spectra densities.
After calculating connectivity metrics, relevant features, such as vectorized connectivity matrices or summary statistics, are extracted for each epoch, combining EEG and eye movement data into feature vectors. Labeling is crucial and should be based on the subject's emotional states or conditions, typically using subjective ratings or experimental task conditions. Subsequently, an LDA model is trained to maximize the separation between these labeled emotional states or conditions, with the LDA criterion function given as:
$J(w)=\left(w^T * S_{-} B * w\right) /\left(w^T * S_{-} \mathrm{W} * \mathrm{w}\right)$ (2)
where, S_B represents the between-class scatter matrix and S_W is the within-class scatter matrix. The feature vectors are then projected onto the discriminant subspace using the learned discriminant vectors. Classification is performed by applying a decision threshold on the transformed feature vectors for classifying the similar frequency bands of emotions.
3.2 Eye movement data pre-processing
In terms of eye movement data statistical and image-based features are to be retrieved. The eye movements were analyzed using eye-tracking glasses.
3.2.1 Statistical feature Extraction of eye movement data
Raw eye tracking has different types of eye movements along with certain noise and blinks. The lack of signal quality and subject-based variations are the major issues in identifying the exactness of the events. The events are Fixations, Saccades, Smooth, Pursuits, Post saccadic oscillations. Fixation indicates still or static focus on an object. Saccades are fast movements between fixation points. This is an essential feature as the brain doesn’t exactly focus on the image in the front. This event could lead to effective inference in knowing the various emotions under study. Post saccade oscillations can indicate nystagmus which is stimulated by stress and fatigue. Therefore, every event has more contributions to emotion identification. The below-mentioned Table 1 eye movement parameters were identified using Begaze Analysis, an analysis software [32].
Table 1. Statistical features of eye tracking data
|
Parameters for Eye Movement Data |
Features Extracted |
|
Diameter of Pupil |
Mean, Standard Deviation |
|
Duration of Fixation (ms) |
Mean, Standard Deviation |
|
Saccade |
Mean, Standard Deviation of duration(ms) and Amplitude |
|
Duration of Blink |
Mean, Standard Deviation |
Figure 1. Pre-processing of raw EEG signal
The diameter pupil being an important parameter for identifying emotional stimulus also causes the luminance reflex. Principal component analysis is used to reduce the dimensionality of the obtained features prioritizing the most important features. Principal components are chosen to eliminate the artifacts like luminance reflex.
3.3 Eye image based data pre-processing
Feature Selection from images widely utilizee Gabor filters, which are convolutional kernels with a bio-inspired design [5]. These filters have two crucial characteristics: location frequency selectivity and orientation. Gabor filter represents similarity to the human visual cortex that can effectively track the patterns in the eye movement data. A 2-D Gabor filter is a Linear discriminant technique generated by a complicated sinusoidal plane wave [31]:
$\psi_{f, \theta}=\frac{f^2}{\pi \gamma \eta} \exp \left(\frac{\alpha^2 x^{\prime 2}+\beta^2 y^{\prime 2}}{2 \sigma^2}\right) \exp \left(j 2 \pi f x^{\prime}+\emptyset\right)$ (1)
$x^{\prime}=x \cos \theta+y \cos \cos \theta$ (2)
$y^{\prime}=-x \sin \theta+y \cos \theta$ (3)
In this instance, f denotes the sine frequency, θ the orientation of the Gabor method, φ the phase offset, α and β the Gaussian sharpness, with the major and minor axes being parallel to and perpendicular to the wave, respectively. It can capture pixel dependencies with narrow spectral bands. The spatial aspect ratio is denoted by γ, whereas the Gaussian envelope's standard deviation is denoted by σ. The step-by-step process of feature extraction is given in the Figure 2:
1. Gabor Filter is a complex filter with the real and imaginary part acting as two filters. The complex data has real part which handles phase information of the eye signal. The imaginary part indicates the frequency spectrum of the obtained eye signal information.
2. The fixed images are subsequently downscaled to remove superfluous data.
3. The filter convolutes each riddle in the Gabor filter collection with the image.
4. The orientations should be obtained by Gabor filter bank. A Gabor filter bank is made up of Gabor filters of varying orientations and scales. There are seven Gabor filter banks with four scales each. Then, unit variance and normalization to zero means are used. The final feature vector for the image is created by combining the normalized feature vectors.
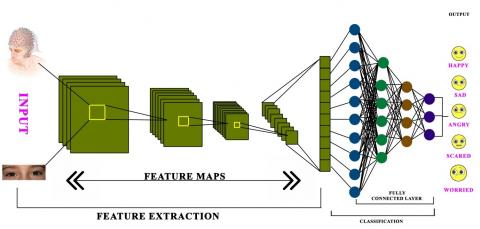
Since EEG signals may accurately describe changes in brain state; emotion detection using EEG signals is a popular research technique. For emotion identification, EEG data are supplemented with a facial expression signal. To create multi-modular emotion recognition, the EEG signals, and facial impression data have been merged using the TTCNN network and then the emotions are classified into five different emotions such as happy, sad, angry, scared, and worried. Recognizing emotions in many modes BDAE is utilized for model combination to investigate the stability of EEG and facial impression information expressing emotions across time. The integration of EEG and facial impression information enhanced the emotion detection model's accuracy. After training, the third BDAE layer (five-layer) is utilized to extract features, which are then sent to the TTCNN for administered picking-up preparation to obtain the feeling characterization model. As a result, the prototype will be better ability to differentiate between things of emotions in the two signals that the profound neural organization has retrieved. The pre-processed inputs are fed to the proposed TTCNN model for emotion recognition is shown in Figure 3.
Figure 2. Eye movement data pre-processing
3.4 Tripartite tier-convolutional neural network
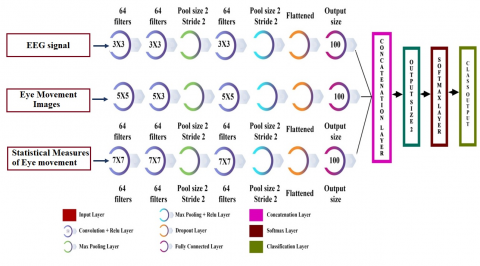
The main aim of this research is to combine the features of different modalities like Eye movement image data, Eye movement based statistical data and, EEG signal-based data. Combination of modalities helps in bringing more context to the emotions under study. The detailed architecture is given in the Figure 4:
Input Layers
There are three input layers in the network. The top tier uses the EEG signal as the input which collects the frequency variations based on the external stimuli to identify the various emotions. The middle tier uses the Eye movement-based image data. Features learnt will indicate the movement of eyes based on the emotions. The bottom tier will take statistical features of eye movement data.
Tier Blocks
Convolution, ReLu, max pooling, and dropout are only a few of the operations that each tier can carry out. Each tier has complete connectivity between all the tiers. The convolutional layer multiplies the input segment element by element before adding the results in a single output cell. Three different types of filters—3×3, 5×5, and 7×7—with various sizes are employed to get the best results while utilising TTCNN. As soon as the data is sent to the pooling layer, the number of attributes that were produced using the dataset is reduced.
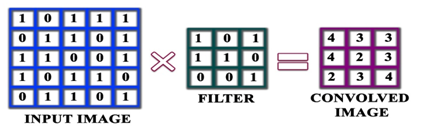
The input picture is taken in the TTCNN network's input layer. The convolution layer completes the matrix dot product of the dual input conditions. Consider an image matrix's h, w, and d dimensions. The formula for its dimensions is (h * w * d).
Figure 3. Proposed emotion recognition method
Figure 4. Tripartite tier-convolutional neural network
Figure 5. Convolutional layer
The filter's size would be represented as (hf * wf * d) if the filter's height, width, and depth were written as hf, wf, and d, respectively. The resultant convoluted sight or feature map can then be generated using preceding calculation.
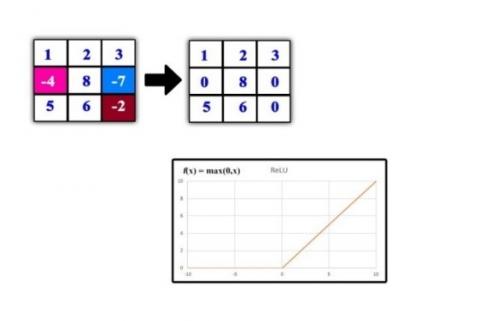
Convolutional filters are applied to the image horizontally as well as vertically in the layer known as convolutional, which calculates the dot product by including the bias term. The operation of the convolution layer is shown in Figure 5. Edge detection, picture blurring, image sharpening, and other processes employ convolved images. The ReLu layer is utilised for non-rectilinear function and to prevent negative values. The ReLu layer's operational mode is shown in Figure 6. The ReLu level output purpose could be explained as follows:
$f(v)=\max (0, v)$ (6)
where, v is a non-negative value.
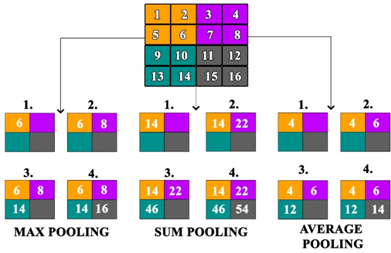
Every input element is placed through a threshold operation, and any element whose range is less than 0 can be set to 0 is considered to have that value. The four-dimensional extent of the convoluted feature is subsequently decreased by the pooling layer. It quickens calculation while limiting over-fitting. The different pooling operations are depicted in Figure 7.
Every single input element is subjected to a threshold operation, and if the range of any component is lower than 0, it is to be set to 0. The merging layer (pooling layer) is then used to shrink the four-dimensional extent of the convoluted feature. It accelerates computation and restricts over-fitting. In Figure 7, the various pooling operations are shown:
$f\left(z_i\right)=\frac{e^{z_i}}{\sum_{j=0}^k e^{z_j}}$ (7)
where, i,j=0,1,2,......k and z is the key value.
Concatenation Layers
The features from different modalities are concatenated to obtain the overall combined context of emotions like happy, sad, angry, scared and worried. These features are passed on to the dense layer for learning the embedding in the fully connected layer. This is represented in the Figure 8.
The main contribution of this work is the usage of different modalities and CNN is configured as Tripartite Tier Convolutional Neural Network. It helps in taking up the individual type of data and the proposed model concatenates the entire features for collective contribution. These yields better insights compared to existing state of art models in terms of emotion recognition.
Figure 6. ReLu layer
Figure 7. Pooling operation
Figure 8. Multimodal based classification
4.1 Experimental results and discussion
In this work, tripartite tiers were used to improve emotion recognition. The tripartite layers introduce the concept of multimodality. The multimodal data used in this work are EEG signals and eye movement data. The SEED-V and DEAP datasets were employed to measure the effectiveness of the proposed work. The datasets are analyzed and compared based on the performance factors from different perspectives that highlight the substantial ability of the proposed work using the tripartite tier system. A 5-fold cross-validation technique is used for both SEED-V and DEAP datasets. In this validation technique, the dataset is divided into five folds, one-fold will be a testing set and the remaining four will be the training set. The same folds iterate four more times by changing the testing folds.
The proposed methodology has been evaluated on the publicly available datasets: SEED [16] and DEAP [22]. Five classes (happy, sad, angry, scared, and worried) of emotion have been classified on the SEED dataset The first 9 tests and the last 6 tests, respectively, make up the training and test sets, according to literature [11]. The DEAP dataset includes viii-channel peripheral physiological inputs and 32-channel electroencephalogram (EEG) recordings from 32 people in the valence-arousal dimension. Each participant observed about 40 music videos that lasted one minute. The EEG signals have undergone pre-processing using a band-pass filter with a regularity range of 4 and 45 Hz [33]. Then, utilizing 32 channels in four frequency bands with a non-overlapping time frame of two seconds, the neural networks from the DEAP dataset were built. The peripheral physiological characteristic is 48-dimensional. Arousal level and valence level binary classification tasks were also completed using a ten times cross-validating technique [34]. This paper employs the strongest EEG functional connectivity network parameter, or strength [35], to further evaluate its discriminating capability in recognizing emotions on the SEED and DEAP datasets. On the SEED dataset, the strength feature has an accuracy of 80.17 7.12 percent in classifying three types of emotions, which is greater than the DE feature's accuracy of 78.5114.32% [11]. With scores of 73.424.67 and 76.104.49% in the DEAP dataset's two tasks for binary classification (arousal-level and valence-level), respectively, the strength feature performs well. These results beat the 68.28 and 66.73 percent results produced by using the capsule network, as well as the 62.0 and 57.6 percent [36] outcomes of the PSD feature. These results show that the three-class emotions of sadness, happiness, and neutrality as well as the five-class emotions of disgust, fear, sadness, and happiness as well as the valence-arousal dimension in the three-class emotion classification can be distinguished by the features of an operational network for the EEG. When correlation is used as the connection metric, strength outperforms both the most common PSD feature and the most recent DE feature, making it the top EEG functional connectivity network feature. Utilizing strength and correlation, the EEG functional connectivity network is evaluated [37].
Confusion matrices have been developed to evaluate the capabilities of each emotion in identifying each distinct EEG brain connectivity signature and eye movement data. This analysis includes EEG parameters including strength, which has 62 channels overall, and correlation connectivity. It has been discovered that both EEG and Pupil movement of eye data have the potential to be used in the classification of emotions such as happy, sad, angry, scared, and worried [38]. EEG connectivity has a strong influence on emotion identification, whereas eye movement data is particularly effective in detecting fear and sadness.
Figure 8 demonstrate that multimodal data fusion approaches have the potential to greatly improve classification measure for all emotions of five categories, in contrast to the emotional model with a single modality [6]. These results demonstrate that when it comes to identifying the five emotions, the EEG brain signal characteristic and eye pupil data for movement have complementary representation properties [12].
4.2 Experiment with SEED-V dataset
The SEED-V dataset represents five different emotional classes happy, sad, angry, scared, and worried. Table 2 offers the comparative analysis of category performance in the proposed method with different existing emotional recognition methods concerning the SEED-V dataset and the respective graphical representation has been illustrated in Figure 9. It infers that the classification performance values for DGCNN, BDAE, Bimodal-LSTM, and DCCA methods of 90.40±8.49, 91.01±8.91, 93.97±7.03, 93.94.58±6.16 respectively.
Table 2. On the SEED dataset, classification performance (%) of several studies in multimodal emotion recognition
|
Methodology |
Mean Accuracy (%) |
Std |
|
FLF |
83.70 |
- |
|
Fuzzy |
87.59 |
- |
|
DGCNN |
90.40 |
8.49 |
|
BDAE |
91.01 |
8.91 |
|
Bimodal-LSTM |
93.97 |
7.03 |
|
DCCA |
94.58 |
6.16 |
|
Proposed TT-CNN |
95.42 |
5.06 |
The suggested method uses eye movement data to detect three emotions—happiness, neutrality, and sadness achieves a higher classification accuracy of 95.42±5.06% [22]. These findings support the theory that combining EEG and eye movements can improve classification accuracy.
Figure 9. Graphical illustration of comparative analysis of Classification performance on SEED dataset
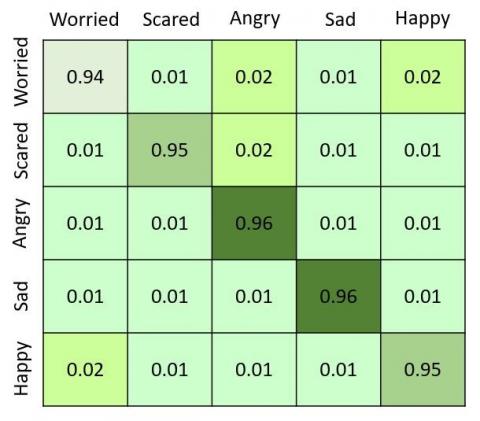
Figure 10. Confusion matrix of emotional classes
In Figure 10, the confusion matrix is given for the classification of emotional classes, and the corresponding confusion graph is in Figure 11. The Classes ‘Angry’ and ‘Sad’ are identified with the highest value of 0.96.
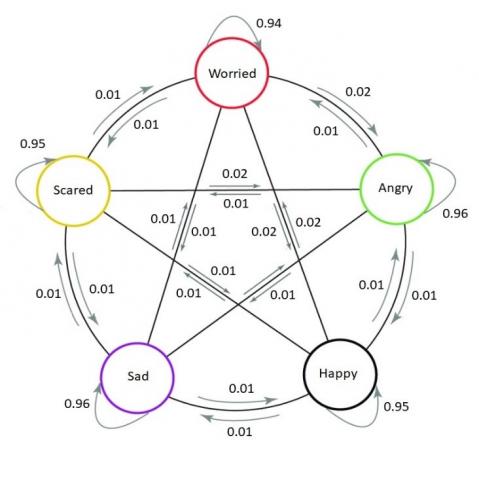
In Figure 11, the states are the emotional classes and the transitions represent the value. From the figures, it is understood that the majority of the emotions are identified correctly.
Figure 11. Confusion graph of emotional classes
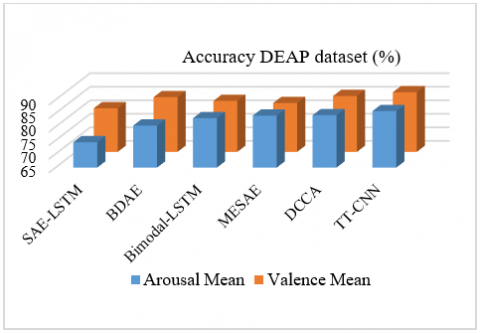
4.3 Experiment with DEAP dataset
The proposed method is analysed with the DEAP dataset and compared with the existing methods. This test is conducted on 32 subjects in which they watch 40-minute online videos and the videos are played to elicit the different emotional states of the subjects. Each subject takes 40 trials so in total there were 1280 trials. Each video clip is scaled from 1-9 for arousal and valence labels for the classification of the emotion recognition. Table 3 presents the comparative analysis of classification performance proposed method with different existing recognition methods concerning the DEAP dataset and the graphical representation has been illustrated in Figure 12. The foundation of existing recognition methods is the correlation of peripheral physiological traits with PSD [39] or DE [40] traits. The classification performance values for the BDAE, Bimodal-LSTM, and DCCA techniques were 80.50±73.39, 83.23±2.61, 84.33±2.25 for Arousal and, and 85.20±4.47, 83.82±5.01, 85.62±3.48 respectively. These numbers were computed using data from eye movements and the EEG connectivity feature. In the two binary classification tasks, the proposed technique achieves the highest classification accuracy: 87.01±3.18% for the valence level and 85.84 ±2.12% for the arousal level.
The discussion suggests that combining eye movement data with the EEG connectivity characteristic may improve the effectiveness of five-class emotion detection. The DCCA model might also discover that there is a greater emotional bond in the common environment. Additionally, the addition of eye movement data to the 18-channel EEG connectivity feature greatly improves classification performance.
Table 3. On the DEAP dataset, the classification performance (%) of several studies in multimodal emotion recognition
|
Methodology |
Arousal Mean Accuracy (%) |
Valence Mean Accuracy (%) |
Arousal Std |
Valence Std |
|
SAE_LSTM |
74.38 |
81.1 |
- |
- |
|
BADE |
80.5 |
85.2 |
3.39 |
4.47 |
|
Bimodal-LSTM |
83.23 |
83.82 |
2.61 |
5.01 |
|
MESAE |
84.18 |
83.04 |
- |
- |
|
DCCA |
84.33 |
85.62 |
2.25 |
3.48 |
|
Proposed TT-CNN |
85.84 |
87.01 |
2.12 |
3.18 |
Figure 12. Graphical illustration of comparative analysis of Classification performance on DEAP dataset
Comparing the strength feature with correlation as the connection measure, it is possible to obtain superior performance in identifying all emotions. Also, the feeling of happiness can be recognized quite well by the EEG characteristic, but it may also be readily mistaken by the emotions of sadness and anger, which is consistent with earlier findings [41].
Emotions appear in both internal and exterior bodily reactions. Multimodal signals offer complementary information that may be used to build a more powerful feeling detection network than unimodal methods. This paper proposed the TTCNN Scheme for recognizing human feelings using EEG and eye movement data. We show that integrating EEG and eye movement data may improve emotion identification accuracy compared to a single modality. We also assessed the strength of our suggested structure across existing models and the complementing features of EEG and ocular developments for emotion detection. Our suggested TT CNN Scheme architecture has been quantitatively evaluated. For the SEED dataset, classification accuracy is 95.42%, and on the DEAP dataset, it is 87.01%. In future, this model can be used to health care applications where the focus is more on emotions based study.
I would like to express my sincere gratitude to the members of the research team who contributed to the successful completion of this study. Their dedication, expertise, and commitment were instrumental in the realization of this research objective.
|
EEG |
Electroencephalogram |
|
|
CNN |
Convolutional Neural Network |
|
|
DCCA |
Deep Canonical Correlation Analysis |
|
|
EOG |
Electrooculogram |
|
|
ECG |
Electrocardiogram |
|
|
FCM |
Fuzzy C-Means |
|
|
GSR |
Galvanic Skin Responses |
|
|
LSTM |
Long-Short Term Memory |
|
|
SVM |
Support Vector Machine |
|
|
TTCNN |
Tripartite Tier Convolutional Neural Network |
|
[1] Thanapattheerakul, T., Mao, K., Amoranto, J., Chan, J.H. (2018). Emotion in a century: A review of emotion recognition. In Proceedings of the 10th International Conference on Advances in Information Technology, pp. 1-8. https://doi.org/10.1145/3291280.3291788
[2] Rahman, M.M., Sarkar, A.K., Hossain, M.A., Hossain, M.S., Islam, M.R., Hossain, M.B., Quinn, J.M.W., Moni, M.A. (2021). Recognition of human emotions using EEG signals: A review. Computers in Biology and Medicine, 136: 104696. https://doi.org/10.1016/j.compbiomed.2021.104696
[3] Karpagam, M., Jeyavathana, R.B., Chinnappan, S.K., Kanimozhi, K.V., Sambath, M. (2023). A novel face recognition model for fighting against human trafficking in surveillance videos and rescuing victims. Soft Computing, 27(18): 13165-13180. https://doi.org/10.1007/s00500-022-06931-1
[4] Dasdemir, Y., Yildirim, E., Yildirim, S. (2017). Analysis of functional brain connections for positive–negative emotions using phase locking value. Cognitive Neurodynamics, 11(6): 487-500. https://doi.org/10.1007/s11571-017-9447-z
[5] Kulke, L.V., Atkinson, J., Braddick, O. (2016). Neural differences between covert and overt attention studied using EEG with simultaneous remote eye tracking. Frontiers in Human Neuroscience, 10: 592. https://doi.org/10.3389/fnhum.2016.00592
[6] López-Gil, J.M., Virgili-Gomá, J., Gil, R., Guilera, T., Batalla, I., Soler-González, J., García, R. (2016). Method for improving EEG based emotion recognition by combining it with synchronized biometric and eye tracking technologies in a non-invasive and low cost way. Frontiers in Computational Neuroscience, 10: 85. https://doi.org/10.3389/fncom.2016.00085
[7] Bono, V., Biswas, D., Das, S., Maharatna, K. (2016). Classifying human emotional states using wireless EEG based ERP and functional connectivity measures. In 2016 IEEE-EMBS International Conference on Biomedical and Health Informatics (BHI), Las Vegas, NV, USA, pp. 200-203. https://doi.org/10.1109/BHI.2016.7455869
[8] Annapurani, K., Malathy, C., Sadiq, A.K. (2014). Performance analysis of various feature extraction techniques in ear biometrics. In: Sathiakumar, S., Awasthi, L., Masillamani, M., Sridhar, S. (eds) Proceedings of International Conference on Internet Computing and Information Communications. Advances in Intelligent Systems and Computing, New Delhi. https://doi.org/10.1007/978-81-322-1299-7_38
[9] Cheng, X., Wang, Y., Dai, S., Zhao, P., Liu, Q. (2019). Heart sound signals can be used for emotion recognition. Scientific Reports, 9(1): 6486. https://doi.org/10.1038/s41598-019-42826-2
[10] Goshvarpour, A., Goshvarpour, A. (2022). Innovative Poincare’s plot asymmetry descriptors for EEG emotion recognition. Cognitive Neurodynamics, 16(3): 545-559. https://doi.org/10.1007/s11571-021-09735-5
[11] Schirmer, A., Adolphs, R. (2017). Emotion perception from face, voice, and touch: Comparisons and convergence. Trends in Cognitive Sciences, 21(3): 216-228. https://doi.org/10.1016/j.tics.2017.01.001
[12] Zhang, Q., Chen, X., Zhan, Q., Yang, T., Xia, S. (2017). Respiration-based emotion recognition with deep learning. Computers in Industry, 92-93: 84-90. https://doi.org/10.1016/j.compind.2017.04.005
[13] Lu, Y., Zheng, W.L., Li, B., Lu, B.L. (2015). Combining eye movements and EEG to enhance emotion recognition. In Proceedings of the Twenty-Fourth International Joint Conference on Artificial Intelligence (IJCAI 2015), pp. 1170-1176.
[14] Saisanthiya, D., Supraja, P. (2023). Heterogeneous convolutional neural networks for motion recognition combined with multimodal figure bilinear bundling and mobile application recommendation. Global Periodical of Interactional Mobile Technologies (iJIM), 17(16): 129-142. https://doi.org/10.3991/ijim.v17i16.42735
[15] Thenmozhi, M., Saravanan, M., Kumar, K.P.M., Suseela, S., Deepan, S. (2020). Improving the prediction rate of unusual behaviors of animal in a poultry using deep learning technique. Soft Computing, 24: 14491-14502. https://doi.org/10.1007/s00500-020-04801-2
[16] Rubinov, M., Sporns, O. (2010). Complex network measures of brain connectivity: Uses and interpretations. Neuroimage, 52(3): 1059-1069. https://doi.org/10.1016/j.neuroimage.2009.10.003
[17] Ranjani, M., Supraja, P. (2021). Classifying the autism and epilepsy disorder based on EEG signal using deep convolutional neural network (DCNN). In 2021 International Conference on Advance Computing and Innovative Technologies in Engineering (ICACITE), Greater Noida, India, pp. 880-886. https://doi.org/10.1109/ICACITE51222.2021.9404634
[18] Atkinson, J., Campos, D. (2016). Improving BCI-based emotion recognition by combining EEG feature selection and kernel classifiers. Expert Systems with Applications, 47: 35-41. https://doi.org/10.1016/j.eswa.2015.10.049
[19] Qiu, J.L., Liu, W., Lu, B.L. (2018). Multi-view emotion recognition using deep canonical correlation analysis. In: Cheng, L., Leung, A., Ozawa, S. (eds) Neural Information Processing. ICONIP 2018. Lecture Notes in Computer Science(), vol 11305. Springer, Cham. https://doi.org/10.1007/978-3-030-04221-9_20
[20] Li, T.H., Liu, W., Zheng, W.L., Lu, B.L. (2019). Classification of five emotions from EEG and eye movement signals: Discrimination ability and stability over time. In 2019 9th International IEEE/EMBS Conference on Neural Engineering (NER), San Francisco, CA, USA, pp. 607-610. https://doi.org/10.1109/NER.2019.8716943
[21] Oliva, M., Anikin, A. (2018). Pupil dilation reflects the time course of emotion recognition in human vocalizations. Scientific Reports, 8(1): 4871. https://doi.org/10.1038/s41598-018-23265-x
[22] Hasani, B., Mahoor, M.H. (2017). Facial expression recognition using enhanced deep 3D convolutional neural networks. In 2017 IEEE Conference on Computer Vision and Pattern Recognition Workshops (CVPRW), Honolulu, HI, USA, pp. 2278-2288. https://doi.org/10.1109/CVPRW.2017.282
[23] Wu, X., Zheng, W.L., Li, Z., Lu, B.L. (2022). Investigating EEG-based functional connectivity patterns for multimodal emotion recognition. Journal of Neural Engineering, 19(1): 016012. https://doi.org/10.1088/1741-2552/ac49a7
[24] Soundariya, R.S., Renuga, R. (2017). Eye movement based emotion recognition using electrooculography. In 2017 Innovations in Power and Advanced Computing Technologies (i-PACT), Vellore, India, pp. 1-5. https://doi.org/10.1109/IPACT.2017.8245212
[25] Asghar, M.A., Khan, M.J., Fawad, Amin, Y., Rizwan, M., Rahman, M., Badnava, S., Mirjavadi, S.S. (2019). EEG-based multi-modal emotion recognition using bag of deep features: An optimal feature selection approach. Sensors, 19(23): 5218. https://doi.org/10.3390/s19235218
[26] Padma, A., Sivajothi, M., Sathik, M.M. (2021). A contemporary strategy for the recognition of glaucoma with tripartite tier convolutional neural network. Annals of the Romanian Society for Cell Biology, 25(5): 883-898.
[27] Saranya, G., Geetha, G., Safa, M., Meenakshi, K. (2020). Multi-label and multi-class retinal classification and comparative model of retinal diseases. International Journal of Advanced Science and Technology, 29(6): 2319-2329.
[28] Song, T., Zheng, W., Song, P., Cui, Z. (2018). EEG emotion recognition using dynamical graph convolutional neural networks. IEEE Transactions on Affective Computing, 11(3): 532-541. https://doi.org/10.1109/TAFFC.2018.2817622
[29] Xing, X., Li, Z., Xu, T., Shu, L., Hu, B., Xu, X. (2019). SAE+ LSTM: A new framework for emotion recognition from multi-channel EEG. Frontiers in Neurorobotics, 13: 37. https://doi.org/10.3389/fnbot.2019.00037
[30] Moon, S.E., Jang, S., Lee, J.S. (2018). Convolutional neural network approach for EEG-based emotion recognition using brain connectivity and its spatial information. In 2018 IEEE International Conference on Acoustics, Speech and Signal Processing (ICASSP), Calgary, AB, Canada, pp. 2556-2560. https://doi.org/10.1109/ICASSP.2018.8461315
[31] Fathima, A.A., Ajitha, S., Vaidehi, V., Hemalatha, M., Karthigaiveni, R., Kumar, R. (2015). Hybrid approach for face recognition combining Gabor wavelet and linear discriminant analysis. In 2015 IEEE International Conference on Computer Graphics, Vision and Information Security (CGVIS), Bhubaneswar, India, pp. 220-225. https://doi.org/10.1109/CGVIS.2015.7449925
[32] Singh, H., Tewari, U., Saisanthiya, D. (2023). Classification of arrhythmia using transfer learning and its applications in smart wearables. In 2023 World Conference on Communication & Computing (WCONF), RAIPUR, India, pp. 1-5. https://doi.org/10.1109/WCONF58270.2023.10235067
[33] Hassan, M.M., Hussein, H.I., Eesa, A.S., Mstafa, R.J. (2021). Face recognition based on Gabor feature extraction followed by FastICA and LDA. Computers, Materials and Continua, 68(2): 1637-1659. http://dx.doi.org/10.32604/cmc.2021.016467
[34] Tarnowski, P., Kołodziej, M., Majkowski, A., Rak, R.J. (2020). Eye-tracking analysis for emotion recognition. Computational Intelligence and Neuroscience, 2020: 2909267. https://doi.org/10.1155/2020/2909267
[35] Wu, D., Zhang, J., Zhao, Q. (2020). Multimodal fused emotion recognition about expression-EEG interaction and collaboration using deep learning. IEEE Access, 8: 133180-133189. https://doi.org/10.1109/ACCESS.2020.3010311
[36] Zhang, H. (2020). Expression-EEG based collaborative multimodal emotion recognition using deep autoencoder. IEEE Access, 8: 164130-164143. https://doi.org/10.1109/ACCESS.2020.3021994
[37] Ranganathan, H., Chakraborty, S., Panchanathan, S. (2016). Multimodal emotion recognition using deep learning architectures. In 2016 IEEE Winter Conference on Applications of Computer Vision (WACV), Lake Placid, NY, USA, pp. 1-9. https://doi.org/10.1109/WACV.2016.7477679
[38] Huang, Y., Yang, J., Liao, P., Pan, J. (2017). Fusion of facial expressions and EEG for multimodal emotion recognition. Computational Intelligence and Neuroscience, 2017: 2107451. https://doi.org/10.1155/2017/2107451
[39] Zheng, W.L., Liu, W., Lu, Y., Lu, B.L., Cichocki, A. (2018). Emotionmeter: A multimodal framework for recognizing human emotions. IEEE Transactions on Cybernetics, 49(3): 1110-1122. https://doi.org/10.1109/TCYB.2018.2797176
[40] Bahreini, K., Nadolski, R., Westera, W. (2016). Data fusion for real-time multimodal emotion recognition through webcams and microphones in E-learning. International Journal of Human–Computer Interaction, 32(5): 415-430. https://doi.org/10.1080/10447318.2016.1159799
[41] Nguyen, D., Nguyen, D.T., Zeng, R., Nguyen, T.T., Tran, S.N., Nguyen, T., Sridharan, S., Fookes, C. (2021). Deep auto-encoders with sequential learning for multimodal dimensional emotion recognition. IEEE Transactions on Multimedia, 24: 1313-1324. https://doi.org/10.1109/TMM.2021.3063612