Rajkumar D. Komati*![]() | Manoj S. Nagmode
| Manoj S. Nagmode![]()
© 2023 IIETA. This article is published by IIETA and is licensed under the CC BY 4.0 license (http://creativecommons.org/licenses/by/4.0/).
OPEN ACCESS
In the dynamic world we inhabit, countless time-varying processes occur, many of which can be recorded using conventional digital cameras. Often, these processes harbor subtle color and motion variations that remain imperceptible to the human eye in the resultant footage. These minute variations, however, may encapsulate crucial information pertinent to the process under observation. Amplifying these variations can unveil valuable insights, thereby facilitating process monitoring and analysis across a multitude of applications. Existing methodologies predominantly focus on amplifying the entire scene or frame of the video, disregarding its intended application. Such an approach demands significant computational time and resources. This paper introduces an innovative and efficient video processing technique, the Modified Eulerian video magnification (MEVM). The MEVM technique identifies and amplifies variations within the region of interest (ROI) in the input video, tailoring it to the specific application. This targeted approach notably reduces computation time and resources - by over 45% compared to conventional methods. Moreover, the amplified variations can be utilized to ascertain the vibration frequency of mechanical systems, such as car engine vibrations, with an accuracy exceeding 98%. The MEVM technique's potential applications span numerous fields, including healthcare, mechanical engineering, civil structures, security, and military. This novel technique offers a significant advancement in video processing, paving the way for more efficient and targeted analysis of time-varying processes.
Eulerian video magnification, motion amplification, region of interest, vibration frequency measurement
In the ever-evolving world, numerous time-varying processes unfold, many of which are readily captured using digital cameras including mobile phones. Within these processes, minute variations often exist, potentially carrying substantive information of interest. However, these variations often elude human visual perception in regular video footage. The amplification of these subtle changes facilitates monitoring and analysis across diverse applications.
Several existing methods such as Eulerian video magnification (EVM), Phase-Based Video Motion Processing (PBM), Riesz Pyramids for Fast Phase-Based Video Magnification (FPBM), and Enhanced Eulerian video magnification (E2VM) have been developed for video amplification. These methods, however, often process the entire video scene or frame without consideration of the specific application. Consequently, they demand significant computational resources and time.
The proposed Modified Eulerian video magnification (MEVM) method aims to reduce the computational burden by automatically identifying the region of interest (ROI) within the input video. This ROI-focused approach effectively reduces the computational time and enhances the quality of the resulting output video compared to existing methods. Furthermore, the amplification of motion variations enables the determination of vibration frequency in mechanical systems.
1.1 Applications of motion magnification techniques
Motion amplification in video can serve a variety of purposes, such as monitoring the vibrations of mechanical systems, or assessing the structural integrity of civil structures like bridges, buildings, and railroads. It can also aid in contactless vital sign monitoring in healthcare and law enforcement sectors.
An approach based on motion magnification (MM) is utilized for the protection and monitoring of Italian cultural heritage [1]. While the human visual system is adept at perceiving and interpreting motion [2], its spatio-temporal sensitivity is limited. However, many signals that fall within this capacity can carry substantial information. For instance, the human pulse rate can be extracted from minor changes in skin color as it varies with blood flow [3]. Similarly, motions with low spatial amplitude, which are difficult or impossible for humans to perceive, can be amplified to reveal mechanical behavior. To unveil these imperceptible motions in video, prior attempts have been made by Liu et al. [4], who analyzed and amplified subtle motions to visualize otherwise invisible deformations.
Video amplification technique can be employed for buildings, bridges, railroads and mechanical systems to monitor the vibrations of the structures [5-7], search and rescue operations, security applications, military applications, education, healthcare etc.
1.2 Overview of existing methods
Existing methods for motion amplification include Eulerian video magnification (EVM), Phase-Based Video Motion Processing (PBM), Riesz Pyramids for Fast Phase-Based Video Magnification (FPBM), and Enhanced Eulerian video magnification (E2VM).
EVM employs a combination of spatial [8] and temporal processing of videos to amplify subtle variations that reveal important aspects of the real world [9, 10]. PBM manipulates small motions in a complex value image pyramid, where phase changes correspond to motion and can be amplified to visualize imperceptible motions [11]. FPBM addresses the high cost and over-completeness of the complex steerable pyramid in phase-based video magnification with a compact image pyramid [12]. E2VM, on the other hand, uses post-processing techniques, leveraging EVM for motion analysis and applying image warping for motion amplification [13].
1.3 Limitations of existing methods
Despite their merits, these existing methods are not without limitations. All methods process the complete video scene irrespective of the application under consideration. This approach necessitates extensive computational time and resources. In many applications, it is not required to process the entire video scene. The focus should be directed towards a specific area of the scene where actual variations are taking place.
In manufacturing industries, for instance, vibration measurement is an essential part of machinery maintenance and performance testing [14]. Vibration monitoring can detect, localize, and identify defects in machines and is vital for avoiding failures in mechanical systems [15]. In the automobile industry, vehicle engine vibration measurement is a crucial method for testing and analyzing engine performance [16].
The primary aim of this work is to develop an efficient algorithm that requires less computational time to generate amplified output videos than the existing methods, with automatic selection of ROI for a given application using the proposed algorithm. The MEVM method is applied to two applications: enhancement of car engine vibration and measurement of vibration frequency, and a healthcare application.
The remainder of the paper is organized as follows: Section 2 introduces the proposed methodology for the MEVM technique applied to healthcare and mechanical system applications, Section 3 presents a discussion of the obtained results, and Section 4 focuses on the conclusion.
2.1 Block diagram of the proposed MEVM methodology
Figure 1 shows the block diagram of the methodology used to obtain the amplified or enhanced motion or variations of the input video. For given application the input video is captured. Based on the variations in the input video, ROI is automatically found using the auto thresholding and difference method. Then ROI is extracted from the input video and it is amplified. The video amplification is done using Eulerian video magnification (EVM). The amplified ROI is patched in the input video to produce the final output video. The final output video will contain the enhanced or amplified variations in the ROI region and the required analysis can be performed. The ROI processing approach will reduce the computation time to obtain the amplified output video which is used for analysis purposes.
The amplified motion variations in the output video enable to find the vibration frequency of mechanical system like car engine vibrations. Small or tiny vibrations of the mechanical system can be recorded using the camera. These vibrations need to be amplified or enhanced to visualize and frequency of vibration can be computed from the output video. The computed frequency value from the output video using the algorithm is compared with the values obtained from the physical measurement of the vibration frequency of the car engine using an accelerometer to verify the ground truth.
Figure 1. Block diagram of proposed MEVM methodology
Figure 2. Block diagram of proposed modified Eulerian video magnification (MEVM) framework
2.2 Modified Eulerian video magnification (MEVM) technique
We propose a MEVM technique that automatically detects the ROI in the input video and enhances subtle color or motion variations within it. MEVM technique reduces computation time by over 45% and reduces the computing hardware resources compared to existing methods.
In many real life videos, there are very small or tiny variations which are difficult to observe or perceive with naked eye. To visualize these variations, they need to be enhanced or amplified. For efficient enhancement of these subtle or imperceptible variations in the input video, the MEVM framework is proposed as shown in Figure 2. It takes the input video and automatically finds the ROI based on the variations. Then the ROI is extracted from the input video and applied to the EVM technique to amplify the variations. ROI is then decomposed into different spatial frequency bands using Laplacian pyramid. These bands applied to temporal band pass filter depending on the frequency band of interest for given application. These bands are then amplified by amplification factor and collapsed to reconstruct the output video. After the amplification, ROI is again patched into the original input video to generate the final output video consisting of amplified variations, which were not easily visible in the original input video.
2.2.1 Algorithm to automatically find ROI using MEVM technique
The input video can be captured using digital camera. After getting the input video, next step is to automatically find ROI. To find the ROI, auto thresholding and background subtraction method is used in which the difference between two successive frames is found out. The following algorithm is used to find ROI in the input video.
bw (x, y) = 1, if O (x, y) > Th, 0 if O (x, y) < Th.
Figure 3 shows the successive frames of the video considered to calculate the difference in frames to obtain variations in pixel values, which indicate the region in which variations or changes are taking place. There are different regions where variations can be present in the input video.
Figure 3. Video frames sequence
Figure 4. Biggest object from the video is found
As shown in Figure 4, in a given input video, multiple regions or objects (for illustration purpose, a triangular shape object is considered) may be having variations. These regions need to be found. When all objects are found in the video, the next step is to find the biggest object or region which has more area (based on the number of pixels) as shown in Figure 4. The biggest region or object of variation is referred as a ROI. ROI is amplified or enhanced using EVM technique. After ROI amplification, it is combined with the input video to generate a final output video in which amplified or enhanced variations can be seen in the ROI region.
2.3 MEVM technique applied in healthcare
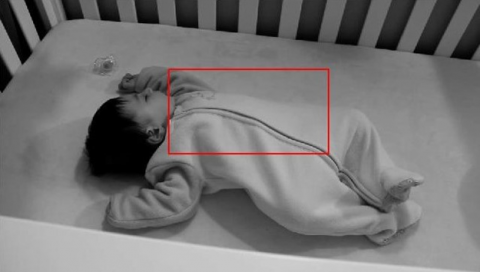
The proposed MEVM technique can be applied to healthcare applications such as baby monitoring. Figure 5 shows the input video of a sleeping baby. As baby breath, due to inhalation and exhalation, there is movement of the chest region. The movement of the chest region can be enhanced or amplified for visualization in the output video. Using the proposed MEVM, output video with enhanced or amplified movement in the chest region is generated for baby monitoring in the healthcare domain. The steps to obtain the enhanced or amplified output video using MEVM technique are as given below. Figure 6 shows the sample frame of baby video which is given as input to the MEVM technique.
Figure 5. Input video of the sleeping baby
Figure 6. Input baby video frame
In order to find the ROI in the input video, the difference between two successive frames is considered. As the baby breathes, because of the movement in the chest region there is more pixel variation across the zipper line of sweater of the baby. So, the difference is found across the zipper line in the successive frames of input video. Using 8-connectivity of the pixel, the continuous region in the difference image is found, which gives ROI in the input video. Depending on application, the variations can be in multiple regions in the input video, but the region which is having more area of variation is found using 8-connectivity of pixel. In the baby video the variations are across the zipper line which gives difference binary image as shown in Figure 7. The region that covers the zipper line is taken as ROI to enhance or amplify the variations. Figure 8 show ROI region marked in the input video to be extracted for the enhancement or amplification. Figure 9 shows the extracted region of the input video which is given to EVM technique to amplify the variations in the extracted region.
Figure 7. Difference image between successive frames
Figure 8. ROI region marked in the input video based on difference image
Figure 9. ROI extracted from input video
Figure 10. Spatially decomposed images from EVM technique
After applying ROI to the EVM technique, it decomposes it into different spatial bands using Laplacian pyramid as shown in Figure 10. These spatial bands are applied to a temporal band pass filter and these filtered bands are multiplied with an amplification factor to amplify the variations in the ROI as shown in Figure 11. Then these amplified spatial bands are collapsed to generate the ROI output video.
Figure 11. ROI with amplified variation
The amplified ROI is patched in the input video to generate the final output video consisting of enhanced or amplified variations in the ROI region without affecting the rest of the part of the input video. The final output video is shown in Figure 12 with enhanced or amplified variations across the zipper region.
Figure 12. Final baby output video sample frame
|
Input baby frame No 33 |
Input baby frame No 38 |
Input baby frame No 40 |
|
Output baby frame No 33 |
Output baby frame No 38 |
Output baby frame No 40 |
Figure 13. Input and output video frames of baby video
Figure 13 shows the input and output frames of the baby video. Frame 33, 38 and 40 are shown for representation. Baby video is amplified using MEVM technique. In the amplified output video, the movement of chest while baby breath is easily seen with the naked eyes which was difficult to see in the input video. When compared, the enhancement of the region across the zipper line in frame 40 of output video can be easily seen with respect to frame 40 of input video. When input video is played, the amplified motion in the chest region can be seen easily. By using MEVM methods, the computation time for the output video significantly reduces compared to other amplification methods. For the baby video, the computation time for full frame processing using EVM method is 258.60 sec and with the proposed MEVM method, it is reduced to 132.82 sec. With proposed MEVM method 125.78 sec less time is required, which gives 48.63% saving of computation time.
2.3.1 Comparison of different methods with MEVM
In order to evaluate the output video generated using MEVM technique, different quality performance metrics are used. The required details in the input video are enhanced using a new proposed MEVM technique. The performance parameters like mean squared error (MSE), peak signal-to-noise ratio (PSNR), Structural Similarity Index (SSIM), and Visual signal to noise ratio (VSNR) are calculated [17].
Table 1 shows the values of the parameters for different methods like EVM, PBM, FPBM, E2VM [18], and new proposed MEVM. In Table 1, different parameter values are shown with their ranks (highest rank as ‘1’ and lowest rank as ‘5’).
From the Table 1 it is observed that, the parameter values, PSNR, MSE, VSNR, and SSIM are significantly improved with the proposed MEVM technique compared to other existing methods. The PSNR value 38.5931 is the highest, MSE value 10.06596 is the lowest, VSNR value 38.45931 is the highest and SSIM value 0.971996 is highest for MEVM technique which is a significant improvement in quality over other existing methods.
Table 1. Comparison of quality parameter values for different methods for baby video
|
Sr. No. |
Parameters |
EVM |
PBM |
FPBM |
E2VM |
MEVM |
|
1 |
PSNR |
31.208 (4) |
32.892 (3) |
31.027 (5) |
34.911 (2) |
38.59315 (1) |
|
2 |
MSE |
49.199 (4) |
34.166 (2) |
51.198 (5) |
21.023 (2) |
10.06596 (1) |
|
3 |
VSNR |
18.682 (5) |
21.327 (3) |
21.268 (4) |
25.627 (2) |
38.45931 (1) |
|
4 |
SSIM |
0.8823 (5) |
0.9477 (4) |
0.9516 (3) |
0.9602 (2) |
0.971996 (1) |
2.4 MEVM technique applied in mechanical
The proposed MEVM technique can be used for mechanical systems for monitoring and maintenance purposes. MEVM technique can be used for vibration measurement of the mechanical system like car engine which can be used for testing or analysis purposes.
2.4.1 MEVM technique for car engine
In the testing of a new vehicle or for condition monitoring, the vibration measurement is essential. In the case of car when engine is started, engine crank shaft starts rotating. Vibrations are generated in the engine due to the cyclic firing of the cylinders of the engine. These vibrations are very small and need to be measured. These vibrations can be captured using the sensors attached to the engine in an idle state. But with MEVM technique contactless measurements can be made using the video of the car engine. Vibrations in the input video can be enhanced or amplified to visualize and measure the frequency of vibration for analysis purposes.
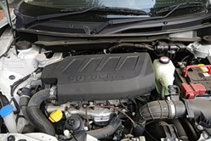
Figure 14 shows the sample frame of the input video recorded for the car engine in the idle state. The length of the video is 10 sec duration and the resolution of 720×480 with a frame rate equal to 30.36 fps. The new MEVM technique is applied to this input video.
In input video when the engine vibrates, it led to change in pixel values in the engine region. In order to find the ROI, the difference image is obtained using successive frames of the input video. After thresholding the binary image is obtained. The biggest object is found using 8-connectivity in the binary image as shown in Figure 15. After finding the biggest object in the video, the bounding box is obtained for that object, which is the required region of interest (ROI) in the input video.
The ROI is marked in the input frame as shown in Figure 16 with red boundaries and displayed on the screen.
Figure 14. Sample frame of input video
Figure 15. Biggest object or region of interest
Figure 16. ROI region marked (red box) in the input frame
Figure 17. Extracted ROI
Figure 18. Sample frame of the final output video
After identifying the region of interest in the input video, it is extracted from the input video. The extracted region is displayed as shown in Figure 17. After cropping the ROI from the input video, it is amplified using the EVM technique and the amplified region of interest combined with the original input video to generate the output video with the amplified variations in the ROI region. Figure 18 shows a sample frame of the final output video with the region of interest amplified. In the final output video, we can see the exaggerated variations in the ROI area. Amplified motion variations of the engine vibrations can be seen in the output video.
2.4.2 Generated input database videos for car engine
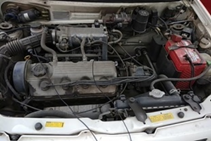
Input videos for the selected mechanical system application are generated for different car engines. The input video is taken with resolution 720×480, length 10 sec, and the frame rate 30 frames per second (fps). While measuring the frequency of vibration of the car engine with accelerometer, simultaneously video of the car engine is recorded to visualize the vibrations and to obtain the frequency using the proposed video processing MEVM technique. Video recording and measurements of frequency using accelerometer are done on various car engines. Figure 19 (a-n) shows the sample frame of different car engine videos. Table 2 shows the details of the 14 recorded videos of the different car engines. These videos are used as input for the proposed algorithm to efficiently enhance the subtle or imperceptible variations to visualize the engine vibration and compute the frequency of vibration of the car engine. From amplified video, frequency of engine vibration is measured, which is a contactless measurement of the mechanical system. An accelerometer is used to measure the frequency of vibration of the engine to verify the ground truth.
Table 2. List of generated input videos
|
Sr. No. |
Name of Car Video |
Resolution of Video |
Length of the Video (Sec.) |
Frame Rate (FPS) |
|
1 |
Swift Desire_1 |
720×480 |
10 |
30.37 |
|
2 |
Hyundai i20_1 |
720×480 |
10 |
30.42 |
|
3 |
Hyundai i10 |
720×480 |
10 |
30.42 |
|
4 |
Swift Desire_2 |
720×480 |
10 |
30.42 |
|
5 |
WagonR |
720×480 |
10 |
30.42 |
|
6 |
Maruti Suzuki Ertiga_1 |
720×480 |
10 |
30.42 |
|
7 |
Maruti Zen |
720×480 |
10 |
30.36 |
|
8 |
Maruti Swift |
720×480 |
10 |
30.38 |
|
9 |
Tata Manza |
720×480 |
10 |
30.39 |
|
10 |
Hyundai i20_2 |
720×480 |
10 |
30.38 |
|
11 |
Maruti Suzuki Ertiga_2 |
720×480 |
10 |
30.36 |
|
12 |
Chevrolet Spark |
720×480 |
10 |
30.39 |
|
13 |
Maruti Suzuki Ciaz |
720×480 |
10 |
30.42 |
|
14 |
Chevrolet Sail |
720×480 |
10 |
30.36 |
Table 3. Computation time required for different videos with and without ROI in the input video
|
Sr. No. |
Car Engine Input Video with Frame Size of 720×480 Pixels |
Length of Video (Sec) |
Computation Time Required for Full Video Amplification (Sec) |
Computation Time Required for Output with MEVM (Sec) |
Difference in Time (Sec) |
Percentage Time Reduced |
|
1 |
Swift Desire_1 |
10 |
170.82 |
124.14 |
46.68 |
27.33 |
|
2 |
Hyundai i20_1 |
10 |
208.93 |
132.17 |
76.76 |
36.74 |
|
3 |
Hyundai i10 |
10 |
208.50 |
109.48 |
99.03 |
47.49 |
|
4 |
Swift Desire_2 |
10 |
217.75 |
124.36 |
93.38 |
42.89 |
|
5 |
WagonR |
10 |
210.81 |
143.58 |
67.23 |
31.89 |
|
6 |
Maruti Suzuki Ertiga_1 |
10 |
211.35 |
169.48 |
41.87 |
19.81 |
|
7 |
Maruti Zen |
10 |
208.86 |
132.99 |
75.86 |
36.32 |
|
8 |
Maruti Swift |
10 |
209.05 |
110.36 |
98.68 |
47.21 |
|
9 |
Tata Manza |
10 |
209.91 |
187.21 |
22.70 |
10.82 |
|
10 |
Hyundai i20_2 |
10 |
258.81 |
149.46 |
109.35 |
42.25 |
|
11 |
Maruti Suzuki Ertiga_2 |
10 |
210.87 |
126.48 |
84.40 |
40.02 |
|
12 |
Chevrolet Spark |
10 |
216.29 |
151.97 |
64.32 |
29.74 |
|
13 |
Maruti Suzuki Ciaz |
10 |
238.91 |
139.36 |
99.56 |
41.67 |
|
14 |
Chevrolet Sail |
10 |
237.36 |
161.35 |
75.65 |
31.92 |
|
(a) Swift Desire_1 |
(b) Hyundai i20_1 |
|
(c) Hyundai i10 |
(d) Swift Desire2 |
|
(e) Wagon R |
(f) Maruti Suzuki Ertiga_1 |
|
(g) Maruti Zen |
(h) Maruti Swift |
|
(i) Tata Manza |
(j) Hyundai i20_2 |
|
(k) Maruti Suzuki Ertiga_2 |
(l) Chevrolet spark |
|
(m) Maruti Suzuki Ciaz |
(n) Chevrolet Sail |
Figure 19. (a-n) Sample frame of each video of different car engines as listed in Table 1
2.4.3 Computation time with MEVM technique
Table 3 shows the computation time required to generate the amplified output video with and without considering the MEVM technique in the input video. In Table 3, column number 4 shows the values of computation time required to generate an amplified output video with full video frame size. Column number 5 shows the computation time required to generate an amplified output video using MEVM technique. In column number 6, the difference in computation time between with and without MEVM technique for the input video is presented.
The last column in the Table 3 shows a percentage reduction of the time required to generate the amplified output using MEVM processing. By using MEVM technique to process the input videos, the computation time required to generate the amplified or enhanced output video significantly reduces. Figure 20 shows the computation time with and without considering the MEVM technique to amplify the input videos.
In Figure 20, the blue colour bars shows the computation time required to generate the amplified output videos without considering the ROI in the input video and the red colour bars shows the computation time required to generate the output video using MEVM technique. It is seen that, using MEVM technique the computation time for each vehicle video is less, compared to the time required to process the entire frame size of the video.
Figure 20. Computation time required with and without MEVM technique
2.4.4 Vibration measurement of mechanical system using MEVM technique
Video amplification technique is used to amplify the imperceptible or tiny variations in the image sequences. These variations can be used for the analysis of time-varying processes such as vibration measurement of the mechanical system like car engine as shown in Figure 21. For contactless measurement of frequency of vibrations of car engine, the video processing algorithm is implemented. For obtaining the video sequence of the car engine, the mobile camera is used. From the amplified output video sequences, the frequency of the vibration of the mechanical system can be obtained using MEVM technique. The computed frequency from the video is compared with the value obtained using industry standard accelerometer.
Figure 21. Input car engine video frame
Figure 22. Car engine vibration video recording setup
Figure 23. Accelerometers connected to the car engine
Figure 24. RTPro software screen showing the frequency of vibration
2.4.5 Accelerometer for frequency measurement of car engine
Most commonly, a ceramic piezoelectric sensor or accelerometer is used to measure vibration. An accelerometer sensor measures the dynamic acceleration of a physical structure in terms of voltage. The advantage of an accelerometer is linearity over a wide frequency range and a large dynamic range. From Brüel & Kjær, type 4513 range of accelerometers has a broad frequency range, high signal-to-noise ratio, and a sensitivity range from 1 to 50mV/ms-2 (10 to 500mV/g) is used. It can also be used in various environmental conditions [19].
2.4.6 Car engine vibration measurement setup
Figure 22 shows the setup to measure the frequency of vibration of the car engine, using an accelerometer, PHOTON+Dynamic Signal Analyzer, a laptop with RTPro software, and mobile camera. Two accelerometers (Accelerometer 1 and Accelerometer 2) are attached to the car engine as shown in Figure 23. When the engine started, vibrations are generated in the engine in idle condition.
The frequency of vibration will be different for each car engines based on RPM, the number of cylinders, and its working condition. Here, two accelerometers are placed on the car engine. The frequency of vibration is measured by each accelerometer separately. Car engine frequency can also be found theoretically using the values of RPM and the number of cylinders [20]. While measuring the vibration frequency using accelerometer, video of the car engine is recorded simultaneously.
2.4.7 RTPro signal analysis software
RTPro is the software used for recording the readings of acceleration versus time. In the setup two accelerometers are used for vibration measurement.
Figure 23 shows the position of the accelerometers on the car engine. Figure 24 shows the RTPro software screen in which FFT of both the accelerometers is displayed simultaneously. The software calculates the FFT (Fast Fourier Transform) and displays frequency on the screen. Figure 24 shows the frequency of vibration as 30.625Hz.
2.4.8 Method to find the frequency of vibration from the output video
In a given application, ROI is amplified using a new MEVM video amplification technique. From the ROI region of the output video, the small region is considered to find the difference between successive frames as shown in Figure 25. The difference is calculated between two successive frames within the small region and the number of times the non-zero difference result is counted for every second of the video. Then, the average of all counts is taken to calculate the frequency of vibration for the engine in the video. The number of times the difference is found within 1 second of the input video gives the frequency value.
Figure 25. Method to find the frequency
2.4.9 Algorithm to find the frequency of vibration
Table 4. Frequency values calculated for each car engine using sensor and video algorithm
|
Sr. No. |
Car Engine Input Video |
Frequency Value Measured Using Sensor (Hz) |
Frequency Value Using Video Algorithm (Hz) |
Difference Frequency (Hz) |
Accuracy % |
|
1 |
Swift Desire_1 |
30.00 |
28.71 |
1.29 |
95.70 |
|
2 |
Hyundai i20_1 |
28.75 |
29.77 |
1.02 |
96.45 |
|
3 |
Hyundai i10 |
26.12 |
20.88 |
5.24 |
79.94 |
|
4 |
Swift Desire_2 |
25.62 |
28.80 |
3.18 |
87.59 |
|
5 |
WagonR |
29.00 |
29.77 |
0.77 |
97.34 |
|
6 |
Maruti Suzuki Ertiga_1 |
26.62 |
29.66 |
3.04 |
88.58 |
|
7 |
Maruti Zen |
22.75 |
27.60 |
4.85 |
78.68 |
|
8 |
Maruti Swift |
30.00 |
29.44 |
0.56 |
98.13 |
|
9 |
Tata Manza |
28.50 |
29.10 |
0.60 |
97.89 |
|
10 |
Hyundai i20_2 |
28.50 |
26.44 |
2.06 |
92.77 |
|
11 |
Maruti Suzuki Ertiga_2 |
26.60 |
29.33 |
2.73 |
89.74 |
|
12 |
Chevrolet Spark |
24.50 |
29.33 |
4.83 |
80.29 |
|
13 |
Maruti Suzuki Ciaz |
23.75 |
29.33 |
5.58 |
76.51 |
|
14 |
Chevrolet Sail |
30.62 |
30.00 |
0.62 |
97.97 |
As per algorithm to find the frequency of vibration, first ROI is obtained from the amplified output video and the 15×15 region of ROI is considered for frequency calculation as shown in Figure 25. Table 4 shows the frequency values for each car with vibration sensor (in column 3) and using the algorithm (in column 4). The frequency measured using video processing algorithm is significantly close to 98.13% for the Maruti swift car (Row No.8). The frequency measurement using video processing algorithm shows significantly a closed match with sensors (ground truth).
2.4.10 Quality performance evaluation of MEVM method
In order to evaluate the mechanical system car engine generated output video, different quality performance parameters are used. The required details in the input video are enhanced using a new proposed MEVM method. The performance parameters like mean squared error (MSE), peak signal-to-noise ratio (PSNR), and the structural similarity index (SSIM) are calculated for the output videos [17]. The performance parameters are compared with full frame size amplification and MEVM amplification.
2.4.11 Mean squared error (MSE)
The mean squared error (MSE) for practical purposes allows comparison of the “true” pixel values of the original image to the degraded image. The MSE represents the average of the squares of the “errors” between the actual image and the noisy image. The error (Eq. (1)) is the amount by which the values of the original image differ from the degraded image.
$M S E=\frac{1}{m n} \sum_{i=1}^n \sum_{i=1}^m\|x(i, j)-y(i, j)\|^2$ (1)
x-original image.
y-degraded image.
m-number of rows of pixels of the image.
n-number of columns of pixels of the image.
Figure 26 shows the MSE values of the Hyundai i20_1 video. The average value of MSE obtained is 29.3958. Figure 26 presents the variations in the values for respective frames in the input and full amplified output video. Figure 27 shows the MSE value between input and output with MEVM processing, the average value of MSE obtained is 25.7057. From Figures 26 and 27, it is observed that the average value of MSE is less using MEVM than the full size frame processing of the input video.
Figure 26. MSE for Hyundai i20_1 video with full frame amplification
Figure 27. MSE for Hyundai i20_1 video with MEVM amplification
2.4.12 Peak signal to noise ratio (PSNR)
The higher the value of PSNR, the better is the image has been reconstructed to match the original image. The PSNR is calculated as follows (Eq. (2)).
${PSNR}(x, y)=10 \log _{10}\left(\frac{\operatorname{MAX}}{{MSE}(x, y)}\right)$ (2)
Figures 28 and 29 show the PSNR value for Hyundai i20_1 video without and with MEVM, respectively. Figure 28 shows the average PSNR value equal to 33.5238 and, Figure 29 shows the average PSNR value equal to 34.0979. The PSNR value increased with MEVM processing.
Figure 28. PSNR for hyundai i20_1 video with full frame amplification
Figure 29. PSNR for Hyundai i20_1 video with MEVM amplification
2.4.13 Structural similarity index measure (SSIM)
Image quality assessment techniques are based on quantifying the errors between a reference and a sample image. The Human visual perception system is highly capable of identifying structural information from a scene and hence identifying the differences between the information extracted from a reference and a sample scene. Hence, a metric that replicates this behaviour will perform better on tasks that involve differentiating between a sample and a reference image. Hence, the parameter Structural Similarity Index Matrix is used (Eq. (3)).
${SSIM}(x, y)=\frac{\left(2 \mu_x \mu_y+c 1\right)\left(2 \sigma_{x y}+c 2\right)}{\left(\mu_1^2+\mu_2^2+c 1\right)\left(\sigma_1^2+\sigma_2^2+c 2\right)}$ (3)
µx is the average of x;
µy is the average of y;
σx2 is the variance of x;
σy2 is the variance of y;
σxy is the covariance of x and y;
C1=(k1L)2, C2=(k2L)2 two variables to stabilize the division with weak denominator;
L dynamic range of the pixel values (typically this is 2#bits per pixel-1);
k1=0.01 and k2=0.02 by default.
Figure 30. SSIM for Hyundai i20_1 video with full frame amplification
Figure 31. SSIM for Hyundai i20_1 video with MEVM amplification
Figures 30 and 31 show the SSIM value for Hyundai i20_1 video without and with MEVM processing, respectively. Figure 30 shows an average SSIM value equal to 0.9583 and, Figure 31 shows an average SSIM value equal to 0.9663. It shows that the MEVM processing gives more similarity between input and the output video.
2.4.14 Quality performance parameter values
Table 5 shows the average values of the performance parameters for each car video. Figure 32 shows the comparison of the parameters MSE, PSNR, SSIM for the first 5 car videos using full frame size amplification and MEVM amplification. The Blue colour bars are representing the parameter values for video processing using full frame size. Red colour bars are representing the parameter values for the video processing with MEVM.
Table 5. Performance parameter values
|
Sr. No. |
Vehicle |
Parameter |
Full Frame Size Amplification (i.e. Without MEVM) |
With MEVM Amplification |
|
1. |
Swift Desire_1 |
MSE |
63.5693 |
36.0710 |
|
PSNR |
31.1484 |
32.6579 |
||
|
SSIM |
0.9602 |
0.9640 |
||
|
2. |
Hyundai i20_1 |
MSE |
29.3958 |
25.7057 |
|
PSNR |
33.5238 |
34.0979 |
||
|
SSIM |
0.9583 |
0.9663 |
||
|
3. |
Hyundai i10 |
MSE |
41.4151 |
24.7880 |
|
PSNR |
32.4868 |
34.2775 |
||
|
SSIM |
0.9659 |
0.9740 |
||
|
4. |
Swift Desire_2 |
MSE |
47.1924 |
26.1760 |
|
PSNR |
31.6978 |
34.0322 |
||
|
SSIM |
0.9435 |
0.9660 |
||
|
5. |
WagonR |
MSE |
29.4832 |
26.2772 |
|
PSNR |
33.5032 |
33.9982 |
||
|
SSIM |
0.9681 |
0.9739 |
||
|
6. |
Maruti Suzuki Ertiga_1 |
MSE |
21.8396 |
23.4230 |
|
PSNR |
33.3518 |
34.5414 |
||
|
SSIM |
0.9605 |
0.9625 |
||
|
7. |
Maruti Zen |
MSE |
26.9827 |
16.2653 |
|
PSNR |
33.9512 |
36.0695 |
||
|
SSIM |
0.9563 |
0.9667 |
||
|
8. |
Maruti Swift |
MSE |
38.6855 |
29.0442 |
|
PSNR |
32.5074 |
33.6236 |
||
|
SSIM |
0.9640 |
0.9697 |
||
|
9. |
Tata Manza |
MSE |
24.4091 |
20.3543 |
|
PSNR |
34.3377 |
35.1188 |
||
|
SSIM |
0.9577 |
0.9631 |
||
|
10. |
Hyundai i20_2 |
MSE |
27.2216 |
16.3283 |
|
PSNR |
33.8526 |
36.0363 |
||
|
SSIM |
0.9619 |
0.9731 |
||
|
11. |
Maruti Suzuki Ertiga_2 |
MSE |
27.1164 |
18.3478 |
|
PSNR |
34.0268 |
35.5448 |
||
|
SSIM |
0.9638 |
0.9764 |
||
|
12. |
Chevrolet Spark |
MSE |
27.1415 |
23.7561 |
|
PSNR |
33.9016 |
34.4526 |
||
|
SSIM |
0.9631 |
0.9677 |
||
|
13. |
Maruti Suzuki Ciaz |
MSE |
34.2659 |
27.7695 |
|
PSNR |
32.8478 |
33.7475 |
||
|
SSIM |
0.9646 |
0.9708 |
||
|
14. |
Chevrolet Sail |
MSE |
36.9245 |
28.656 |
|
PSNR |
33.1245 |
34.963 |
||
|
SSIM |
0.9624 |
0.9789 |
2.5 Hardware and software platforms used
In order to implement the proposed methodology, a hardware and software platform is used.
2.5.1 Hardware [3, 4]
2.5.2 Software
Figure 32. MSE, PSNR, SSIM parameters values for first 5 cars given in Table 5 with (red) MEVM and without (blue) MEVM amplification
The proposed method uses a new MEVM technique to amplify or enhance variations in the video for the analysis of time-varying processes in order to reduce the computation time and the hardware resources in terms of memory and the processors. The computation time can be reduced by automatically finding out the ROI in the input video and processing that ROI instead of processing the entire frame size of the video for the given application. The proposed MEVM method can be applied to the mechanical field, healthcare, surveillance, civil structures, search and rescue operations, military applications etc. In this paper, the proposed algorithm is applied to healthcare and mechanical field. In healthcare application, baby monitoring is considered in which breathing movements is amplified for visualization and monitoring purposes. In mechanical system application, vibrations of the car engine are amplified for visualization and the frequency of vibration of the car engine is computed.
3.1 Healthcare application
For the baby video, the computation time required to process full frame size using existing EVM method is 258.60 sec, whereas it reduced to 132.82 sec using proposed MEVM method. With proposed MEVM method 125.78 sec less time is required to generate final output video, which led to 48.63% saving of computation time. For baby monitoring application, the quality performance parameters obtained using the proposed MEVM are compared with the existing methods of video magnification techniques, which shows the significant improvement for MEVM technique. The PSNR value with MEVM technique is 38.59315. For other existing methods, EVM, PBM, FPBM, and E2VM are 31.208, 32.892, 31.027, and 34.911 respectively. As seen from the values of PSNR, MEVM technique gives the highest value than other existing methods. Similarly, for MSE values with MEVM technique is 10.06596 and with other existing methods, EVM, PBM, FPBM, and E2VM are 49.199, 34.166, 51.198, and 21.023 respectively. MEVM technique gives least MSE value which is desired value. The VSNR value with MEVM technique is 38.45931 and for other existing methods, EVM, PBM, FPBM, and E2VM are 18.682, 21.327, 21.268, and 25.627. VSNR value with MEVM technique is highest which desired value. The SSIM value with MEVM technique is 0.971996 and for other existing methods, EVM, PBM, FPBM, and E2VM are 0.8823, 0.9477, 0.9516, and 0.9602 respectively. SSIM value with MEVM technique is highest which desired value. The proposed new MEVM technique improves the quality of output video in terms of PSNR, MSE, VSNR, and SSIM values compared to other existing methods.
3.2 Mechanical system application
For mechanical system application, as seen from the results in Table 3, for Hyundai i10 car video (Sr. No. 3), the time required for processing the video with existing EVM technique which processes entire frame is 208.5 sec and with the proposed MEVM technique time required is 109.47 sec. The difference in time for processing with and without MEVM technique is 99.2 seconds, i.e., 47.49% less time is required to process the video with the proposed MEVM technique. Similar values for Maruti swift car video (Sr. No. 8) with existing EVM technique is 209.05 Sec. and with proposed MEVM technique is 110.36 Sec. The difference in time is 98.68 Sec. which 47.21% less time is required to generate amplified output video. Similarly for other videos MEVM technique requires significantly less computation time to generate amplified output video.
The amplified vibration motions in the output video enable to find the frequency of vibration of the car engine. The frequency of vibration for each car from the output video is found out using algorithm given in section 2.4.9. In order to verify the result of the proposed technique of contactless monitoring of mechanical systems like the car engine vibration, the frequency of vibration is found out using an accelerometer and compared with the values which are calculated using the video processing algorithm, both results show close match. As given in Table 4, for Maruti Suzuki car engine (Sr. No. 8), the frequency value from the video is 30Hz and with accelerometer is 29.44Hz. The difference is 0.56Hz. It shows 98.13% match between frequency obtained from video and the sensor. Similarly, for Cheverolet sail video (Sr. No. 14) Chevrolet Sail frequency value with sensor is 30.62Hz and with algorithm 30.00Hz. The difference is 0.62Hz, match is 97.97%. The frequency values measured using algorithm is significantly matching with the ground truth.
After processing the input videos with the proposed method, the performance parameters like MSE, PSNR, and SSIM are computed for video quality analysis. The performance parameters show the significant improvement with proposed MEVM technique. For mechanical application, as seen from Table 5, for Swift Desire_1 car video (Sr. No. 1) the values of MSE, PSNR, and SSIM are 63.5693, 31.1484, and 0.9602 respectively, with full size processing of the frames of the video i.e. existing EVM technique and the corresponding values of the video with proposed MEVM technique are 36.0710, 32.6579 and 0.9640 respectively. It shows that there is 43.26% reduction in the MSE, 4.85% increase in the PSNR, and 0.4% change in the SSIM which is the improvement in the quality of result videos. With the proposed new MEVM technique, the amplification or enhancement of imperceptible or subtle variations in the input video is done efficiently with reduced computation time and improved quality performance parameters.
The limitation of proposed MEVM technique is when the ROI occupies more area in the scene for given application, the computation time required is more because we need to process a greater number of pixels of the input video, we save less on the computation time. Also, we will get the less improvement in the quality performance parameters values for the given videos. In case of frequency measurement from the amplified video we considered the single frequency in the video. If the input video consists of regions with different frequencies, we need to find those regions and develop algorithm for frequency measurement of those regions.
The proposed MEVM method uses a new efficient video amplification technique based on automatic selection of region of interest (ROI) which amplifies imperceptible or tiny motions in normal video that represents useful information about time-varying processes with improved quality performance parameters such as PSNR, MSE, and SSIM. The main contribution of MEVM technique are as follows:
Using proposed MEVM technique for any given application the computation time and resources required in terms of processors and memory are saved significantly for amplification of tiny or subtle variations in the input video for visualization and monitoring purposes. Also, it improves the quality of the generated amplified output video. Based on MEVM technique we can find the frequency of vibration of mechanical system for monitoring and measurement purposes.
The proposed MEVM technique can be used in many applications, civil structure like, buildings, bridges, railroads, search and rescue operations, security applications, military applications, health care etc.
[1] Fioriti, V., Roselli, I., Cataldo, A., Forliti, S., Colucci, A., Baldini, M., Picca, A. (2022). Motion magnification applications for the protection of Italian cultural heritage assets. Sensors, 22(24): 9988. https://doi.org/10.3390/s22249988
[2] Wadhwa, N., Chen, J.G., Sellon, J.B., Wei, D.L., Rubinstein, M., Ghaffari, R., Freeman, D.M., Büyüköztürk, O., Wang, P., Sun, S.J., Kang, S.H., Bertoldi, K., Durand, F., Freeman, W.T. (2017). Motion microscopy for visualizing and quantifying small motions. Proceedings of the National Academy of Sciences, 114(44): 11639-11644. https://doi.org/10.1073/pnas.1703715114
[3] Verkruysse, W., Svaasand, L.O., Nelson, J.S. (2008). Remote plethysmographic imaging using ambient light. Optics Express, 16(26): 21434-21445. https://doi.org/10.1364/OE.16.021434
[4] Liu, C., Torralba, A., Freeman, W.T., Durand, F., Adelson, E.H. (2005). Motion magnification. ACM Transactions on Graphics (TOG), 24(3): 519-526. https://doi.org/10.1145/1073204.1073223
[5] Naser, A.F., Mohammed, H.A., Mohammed, A.A. (2021). Seismic design assessment of bridge piers location effect on the structural capacity of supports under earthquake action. International Journal of Safety and Security Engineering, 11(2): 143-153. https://doi.org/10.18280/ijsse.110203
[6] Alfaro Degan, G., Coltrinari, G., Lippiello, D. (2017). Analysis of ground-transducer coupling in monitoring vibration from railways: A case study. International Journal of Transport Development and Integration, 1(2): 290-300. https://doi.org/10.2495/TDI-V1-N2-290-300
[7] Huang, J.J. (2020). Vibration testing of a certain turbojet engine using the power spectrum analysis. Journal Européen des Systèmes Automatisés, 53(1): 87-93. https://doi.org/10.18280/jesa.530111
[8] Burt, P.J., Adelson, E.H. (1987). The Laplacian pyramid as a compact image code. In Readings in Computer Vision, 671-679. https://doi.org/10.1016/B978-0-08-051581-6.50065-9
[9] Wu, H.Y., Rubinstein, M., Shih, E., Guttag, J., Durand, F., Freeman, W. (2012). Eulerian video magnification for revealing subtle changes in the world. ACM Transactions on Graphics (TOG), 31(4): 1-8. https://doi.org/10.1145/2185520.2185561
[10] Wadhwa, N., Wu, H.Y., Davis, A., Rubinstein, M., Shih, E., Mysore, G.J., Chen, J.G., Büyüköztürk, O., Guttag, J.V., Freeman, W.T., Durand, F. (2016). Eulerian video magnification and analysis. Communications of the ACM, 60(1): 87-95. https://doi.org/10.1145/3015573
[11] Wadhwa, N., Rubinstein, M., Durand, F., Freeman, W.T. (2013). Phase-based video motion processing. ACM Transactions on Graphics (ToG), 32(4): 1-10. https://doi.org/10.1145/2461912.2461966
[12] Wadhwa, N., Rubinstein, M., Durand, F., Freeman, W.T. (2014). Riesz pyramids for fast phase-based video magnification. In 2014 IEEE International Conference on Computational Photography (ICCP), IEEE, Santa Clara, CA, USA, pp. 1-10. https://doi.org/10.1109/ICCPHOT.2014.6831820
[13] Liu, L., Lu, L., Luo, J.J., Zhang, J., Chen, X.H. (2014). Enhanced Eulerian video magnification. In 2014 7th International Congress on Image and Signal Processing, Dalian, China, pp. 50-54. https://doi.org/10.1109/CISP.2014.7003748
[14] Liu, F., Gleicher, M., Wang, J., Jin, H.L., Agarwala, A. (2011). Subspace video stabilization. ACM Transactions on Graphics (TOG), 30(1): 1-10. https://doi.org/10.1145/1899404.1899408
[15] Śmieja, M., Mamala, J., Prażnowski, K., Ciepliński, T., Szumilas, Ł. (2021). Motion magnification of vibration image in estimation of technical object condition-review. Sensors, 21(19): 6572. https://doi.org/10.3390/s21196572
[16] Chakraborty, M., Jha, R.K., Balas, V.E., Sur, S.N., Kandar, D. (2020). Trends in wireless communication and information security. Proceedings of EWCIS, 2020: 1. https://doi.org/10.1007/978-981-33-6393-9
[17] Wang, Z., Bovik, A.C., Sheikh, H.R., Simoncelli, E.P. (2004). Image quality assessment: from error visibility to structural similarity. IEEE Transactions on Image Processing, 13(4): 600-612. https://doi.org/10.1109/TIP.2003.819861
[18] Mohsen, M.S., Fakhri, A.B., Ahmed, N.M., Mahmood, M.F., Mohammed, S.L. (2021). Video magnification techniques: medical applications and comparison of methods. In IOP Conference Series: Materials Science and Engineering, IOP Publishing, 1105(1): 012074. https://doi.org/10.1088/1757-899X/1105/1/012074
[19] Type 4513 range of accelerometers Brüel & Kjær. https://www.bksv.com/media/doc/bp2065.pdf.
[20] Panda, K.C. (2016). Dealing with noise and vibration in automotive industry. Procedia Engineering, 144: 1167-1174. ttps://doi.org/10.1016/j.proeng.2016.05.092