Kehkashan Kanwal![]() | Muhammad Asif*
| Muhammad Asif*![]() | Syed Ghufran Khalid
| Syed Ghufran Khalid![]() | Sarwar Wasi
| Sarwar Wasi![]() | Farhana Zafar
| Farhana Zafar![]() | Iffat Kiran
| Iffat Kiran![]() | Saad Abdullah
| Saad Abdullah![]()
© 2023 IIETA. This article is published by IIETA and is licensed under the CC BY 4.0 license (http://creativecommons.org/licenses/by/4.0/).
OPEN ACCESS
Photoplethysmography (PPG) has emerged as an increasingly attractive signal for non-invasive physiological measurements, owing to its simplicity, cost-effectiveness, and broad applicability spanning cardiovascular to respiratory systems. The burgeoning interest in PPG signal processing has facilitated its extensive incorporation in wearable devices, thus stimulating active research in this field. The present study undertakes a comprehensive evaluation to discern the optimal index finger (right or left) for PPG data acquisition and subsequent filtration, appraised through the lens of the signal-to-noise ratio (SNR) of the filtered signal. An analysis conducted on signals contaminated with white Gaussian noise unveiled that the Savitzky-Golay filter (a polynomial filter) with a window size of three outperformed other window lengths, rendering the highest SNR. Among the Infinite Impulse Response (IIR) filters compared; the Chebyshev I filter emerged as superior. Interestingly, the right index finger consistently demonstrated a higher mean SNR across filters: 0.49% for the Savitzky-Golay filters, 4.32% for the Butterworth (order 6), 7.71% for the Chebyshev I (order 10), and 4.02% for the Chebyshev II (order 4), relative to the left index finger for PPG signals perturbed by white Gaussian noise. These findings provide an insightful perspective for future research and development in wearable devices, suggesting potential superiority of the right index finger for PPG signal acquisition and filtration.
photoplethysmography, PPG, Savitzky-Golay filter, FIR filters, IIR filters, index fingers
Recently, there has been a surge in demand for non-invasive, compact, energy-efficient, and portable devices capable of capturing vital signals from the human body. Photoplethysmography (PPG) has emerged as an uncomplicated, cost-effective technique that can extract valuable information without causing discomfort to the subject. Although the design and principle of a PPG sensor are straightforward, the PPG signal itself is multifaceted, consisting of a variety of components, each with its own biological function [1, 2]. Therefore, PPG has been extensively explored and utilized as a research subject in recent years, serving as a measurement tool for estimating heart rate, breathing rate, sleep apnea, blood pressure, blood glucose levels, and even as a diagnostic tool for physiological disorders such as cardiovascular diseases [3-13]. Significant strides have been made in developing effective methods of preprocessing and extracting features [14] from PPG signals due to their utility in a plethora of wearable devices [15, 16].
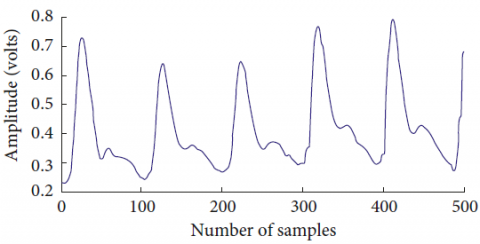
Photoplethysmography (PPG) employs an optical technique to detect changes in blood volume in the peripheral circulation. Both transmission and reflectance schemes are used to record the PPG waveform, with LEDs typically used as a light source, alongside a photodiode [17]. The pulsating component of a PPG signal, which is synchronous with the heartbeat, corresponds to changes in arterial blood volume. Conversely, the non-pulsating component reflects the basic blood volume, respiration, the sympathetic nervous system, and thermoregulation [18]. Figure 1 illustrates a typical PPG waveform obtained from a human subject's fingertip, as per the study by Liu et al. [19].
PPG can be recorded from various extremities and tissues such as fingers, toes, earlobes, forehead, and wrists [20]. Wrist-mounted devices like fitness bands and smartwatches have popularized heart rate monitoring [21, 22]. However, in a clinical environment, fingers and toes are often preferred for PPG measurements for adults [23, 24] and infants [25]. In the case of infants or preterm babies in the NICU, reflectance PPG (rPPG) presents a promising alternative [26, 27].
Given the abundance of research using PPG signals from various sites and modes of measurement, it is essential to determine if any specific site offers superior results for certain applications. For example, since the PPG captured from the forehead lacks the respiratory component [28], it may be more advantageous to use fingers, which carry respiratory information. Another point of consideration is the choice of fingers; although the index finger is generally used [29, 30], it is still unclear whether one index finger is superior to the other for specific applications.
Figure 1. Typical PPG signal obtained from the fingertip of a human subject [19]
Signal quality assessment of acquired PPG signals is another critical issue. With the growing demand for wearable sensor applications, research in this area has increased due to the unavoidable impact of motion and noise artifacts on PPG signals. Elgendi [31] assessed eight different signal quality indices for heat stress PPG data and identified the skewness index as the most suitable. However, it remains to be seen if this quality index remains the most suitable for PPG data measured from other sites or with another mode of measurement.
Finally, the choice of filters is an important aspect to consider. Filtering is a critical step for any noisy data, and for PPG signals, this process is simplified due to the established frequency range [32]. Researchers have developed and applied various smoothing, IIR, and FIR filters, with preference often leaning toward one type depending on the application. Nonetheless, there is no consensus on this preference to date.
Recently, numerous strategies have been employed to address the various noises associated with PPG signals. Several kinds of moving average filters have been applied, but it's crucial to maintain the characteristic shape of the PPG signal that typically tends to be smoothed out by a moving average filter [32]. For high-frequency noises and motion reduction, frequency filtering has proven effective [33]. Independent component analysis has been used to eliminate motion artifacts, although the extracted individual signal components are unordered and require further processing to restore them [34, 35].
There has been active research in PPG signal processing. For instance, Peng et al. [34] proposed Short Term Frequency Transforms (STFT) with a deep learning approach called CNN for PPG signal quality assessment. The proposed model achieved 98.3% accuracy in classifying good and bad quality PPG signals. Wójcikowski [36] used variants of the Long Short-Term Memory (LSTM) network to enhance the morphology of PPG signals for heart rate detection with wearable devices. Pankaj et al. [37] employed the Fourier Decomposition Method to suppress motion artifacts from noisy PPG signals, and the clean signal segments were then used for heart rate detection.
Liang et al. [38] implemented nine different filters of various orders with the aim not to remove noise but to accentuate systolic and diastolic waves in the PPG using the skewness quality index. They didn't use the Savitzkay-Golay filter. They found the Chebyshev II filter of order four most efficient for their application.
Recently, Kwon et al. [39] applied six different neural network-based noise reduction algorithms on PPG signals with five different types of noise. They tried to devise an integrated denoiser exclusively for denoising. Waugh et al. [40] proposed a cluster analysis-based noise reduction method to remove sporadic noises only. The primary idea of this method was to select similar pulses without noise to result in a clean signal. Kavitha et al. [41] utilized the wavelet shrinkage denoising method and proposed a method for selecting wavelet transform parameters for baseline wander and motion artifact.
Zhang [42] proposed a technique named Joint Sparse Spectrum Reconstruction (JOSS). JOSS estimates the spectra of the PPG signal and acceleration signals in a combined manner and removes the spectral crests of motion artifacts (MA). JOSS is specifically targeted towards MA. The method we propose below has been tested using white Gaussian noise, and the recorded signal has been intentionally kept free from MA. TROIKA is a framework consisting of signal decomposition for denoising, sparse signal reconstruction for spectrum reconstruction, and spectral peak tracking [43]. TROIKA has been proposed for wrist-type PPG signals during physical activity, and such signals are susceptible to MA. This framework has been proposed for heart rate estimation.
In contrast to previous studies that mainly focused on preprocessing and eliminating motion artifacts commonly found in PPG datasets, regardless of sensor placement, our research aims to compare clean and noisy signals from the same subjects to determine if any specific index finger is more suitable for recording PPG. This work serves as an initial data collection phase to establish a protocol for gathering PPG data from both adults and children using the provided recording device. This data will be used in a larger study.
In the present work, a PPG signal was recorded from a group of healthy individuals and processed. The PPG was recorded using an FDA-approved commercially available device from the index fingers of both hands that generate a good quality PPG signal. Then white Gaussian noise was introduced in the collected PPG signal to compare the effects of filtering the noisy data using the Savitzky-Golay Filter and three IIR filters: Butterworth, Chebyshev I, and Chebyshev II. These filters were designed and implemented using different MATLAB tools, and various filter properties were explored. The effect of filtering the PPG signal using the above-mentioned filters was explored, and Signal to Noise Ratio (SNR) was used as the PPG signal quality index for this work. The SNRs after filtering the signal from the right and left index fingers were compared. We concluded that the right index finger has a better mean SNR compared to the left index finger for PPG signals with white Gaussian noise for the given PPG dataset and recording system, therefore, we may prefer using the right index finger for further larger PPG data collection using the same recording system.
The presented work is organized as follows: In Section 2, data collection, data curation, pre-processing of the data, filter design, and implementation are discussed. In Section 3, the results are interpreted and discussed, and the conclusion and recommendations for the work are provided in Section 4.
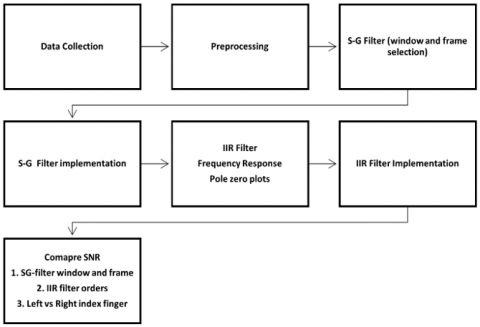
This study required physiological signals from human subjects. Ethical approval has been obtained from the ethical review board of Ziauddin University. For the study, 11 healthy individuals were recruited for data collection after signing an informed consent form. Figure 2 summarizes the workflow as discussed in this section and Figure 3 summarizes the methodology employed.
2.1 Data collection protocol
The data collection protocol used can be defined as follows:
2.2 Hardware and software
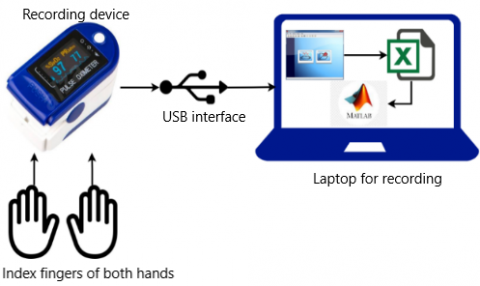
The PPG signal was recorded using CMS50D, a commercially available device that records the photo-plethysmogram. The device comes with compatible software called SpO2 Assistant with a sampling frequency of 58.6Hz. The software produces a detailed oximetry report, and the plethysmograph data points are saved in an Excel sheet. The Excel sheets were then read in MATLAB for processing after data curation.
Figure 2. Workflow for the presented work, the PPG signals recorded were preprocessed first, where segmentation was done, and then the noise was added, the Savitzky-Golay filter was used for smoothing the data essentially, three different IIR filters, namely, Butterworth, Chebyshev I, and Chebyshev II (various orders), were designed and implemented, for the Savitzky-Golay filter, different window and frame lengths were compared using the signal-to-noise ratio. IIR filters and their orders were also compared using SNR and frequency responses
Figure 3. PPG signal is recorded from the index fingers of both hands, the recording device is connected to a host computer via a USB interface where a reading software reads the PPG data and generates CSV format excel files for the data, the excel files are then read in MATLAB and processed
2.3 Preprocessing
The wave data saved in CSV format is read in MATLAB, and the data is segmented into 5 sec long sections. It has been done for both fingers separately. We then introduced white Gaussian noise of power 12 dB in all segments to analyze filtering effects.
2.4 Filter design
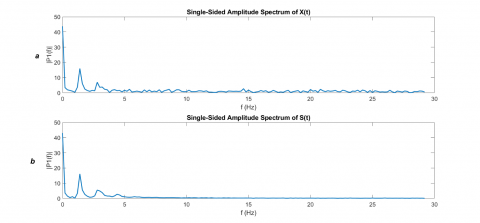
A Fast Fourier Transform (FFT) of the original signal for all subjects was taken to find the frequency spectrum and bandwidth of the signal as shown in Annex A1(b), then we took FFT of the noise-corrupted data that appeared to have random frequencies all over the frequency spectrum as shown in Annex A1(a).
2.4.1 Frequency response of designed filters
Using the cutoff frequencies obtained using frequency spectrum graphs presented above, Butterworth, Chebyshev I, and Chebyshev II bandpass filters have been designed for orders 4, 6, 8 and 10. The plot of frequency response magnitude in dB against normalized frequency for all orders is presented in Annex A2 (a) for the Butterworth filter. As the filter order increases, passband ripples start appearing due to a steeper roll-off. The magnitude in dB against actual frequency and phase response is shown in Annex A3 (a).
The plot of frequency response magnitude in dB against normalized frequency for all orders of the Chebyshev I filter has been presented in Annex A2 (b). The amplitude of ripples here is more than the amplitude of Butterworth and is more significantly present in the higher-order filter. Annex A3 (b) presents a plot of magnitude in dB and phase response against actual frequency. The frequency response magnitude becomes 0dB around 14Hz, slightly earlier than the Butterworth filters. Annex A2 (b) also shows the phase response of the Chebyshev I filter.
The plot of frequency response magnitude in dB against normalized frequency for all orders of the Chebyshev II filter has been presented in Annex A2 (c). The amplitude and number of ripples here are more than the amplitude of Butterworth and Chebyshev I and are more significantly present in higher orders. Annex A3 (c) presents plots of magnitude in dB and phase response against actual frequency. The frequency response magnitude becomes 0dB around 5Hz for all orders first, however, increases again and above 0dB for higher orders.
2.4.2 Pole-zero plots
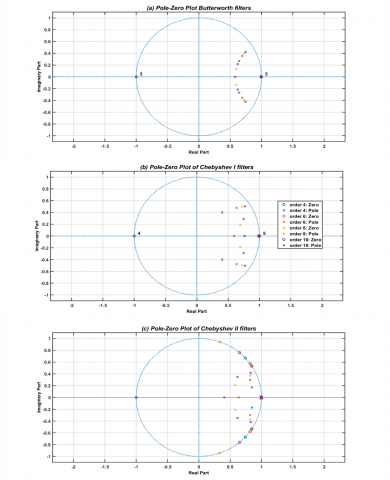
Since designed Butterworth, Chebyshev I, and Chebyshev II are IIR filters, the pole-zero plots of the filters and selected parameters were made to ensure the stability of these filters. In Annex A4 (a), (b), and (c), pole-zero plots of Butterworth, Chebyshev I, and Chebyshev II filters have been plotted respectively. It can be seen that all the zeroes are on the unit circle. For Butterworth and Chebyshev, I, the location of zeroes does not change with changing the order of the filter. For the Chebyshev II filter, however, the zero location moves away from the x-axis as the filter order increases. The designed filters are stable since all the poles are inside the unit circle on a complex plane.
2.5 Filter implementation for IIR filters and Savitzky-Golay filter
SNR was calculated on corrupted PPG signal for each recording segment for all collected data, and the mean for each recording was calculated. Then filters were applied, and SNR and mean SNR were calculated again. Lastly, a ratio of SNR before the filter to average SNR means after the filter was calculated.
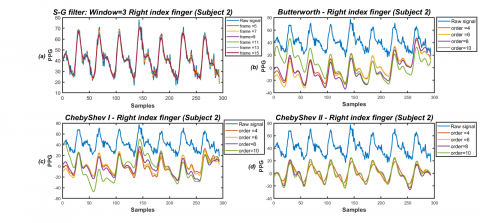
Annex A5 shows the plots of the segment of corrupted PPG samples (shown in blue on all four graphs). The top right graph in Annex A5 (a) shows an implementation of the Savitzky-Golay filter for window=3. The graph shows the effects of smoothing increase as the frame length is increased however increasing the frame length also decreases the maximum and minimum amplitude of the signal. Hence the most optimal window and frame length were found to be 3 and 13 respectively to ensure maximum smoothing without altering the magnitude. For the Savitzky-Golay filter, we first tried various window lengths and frame lengths to find the frame and window lengths for the most optimized results in terms of signal morphology, smoothing, and SNR. All these combinations were used for both sets of finger recordings of PPG, mean values of SNR for each case were calculated for corrupted signal, and then SNR was calculated after the filter was applied.
The segments have been processed using the Butterworth filter in Annex A5 (b), Chebyshev I in Annex A5(c), and Chebyshev II in Annex A5 (d). The filtered graphs of order four (shown in red), order six (shown in yellow), order eight (shown in purple), and order ten (shown in green) for all these filters. The greater the order, the more prominent the dichroitic notch becomes in the case of the Butterworth and Chebyshev II filter. As the order is increased, the overall morphology of the signal is improved and the fiducial points of the PPG signal i.e., onset, systolic peak, diastolic peak etc. becomes more distinct and can be easily marked for further processing and feature extraction.
Annex B1 lists values of raw SNR and filtered (S-G filter) mean SNR for the right index finger and Annex B2 lists the ratio of filtered mean SNR with SNR of corrupted signal, calcu-lated for given window and frame length of right index finger data. The filter applied is Sa-vitzky-Golay. Mean SNR provides an efficient way to assess the effects of the filter in im-proving the SNR of the signal because of filtration. In Annex A6 (a), we plotted the mean filter SNR against frame length for all windows, i.e., window 3 (blue), window 5 (orange), and window 7 (grey) for the right index finger. It is observed that the maximum mean SNR for filtered PPG is associated with Windows 3 for all frames, and SNR increases with an increase in the length of the frame for the Savitzky-Golay filter. Annex A6 (b) represents the graph of the ratio of filtered mean SNR for the Savitzky-Golay filter to raw mean SNR against frame length for all windows for the right index finger. Maximum SNR ratios are associated with Windows three for all frame lengths and SNR ratios. Therefore, if better SNR is required with a smoothing filter like Savitzky, then window three should be used. It should be noted in Annex A5 (d) that as the frame increases, the wave's amplitude starts clipping, as can be seen with frame=15 (shown in maroon). Therefore window=3, frame=13 seems a good choice to have maximum SNR without clipping the amplitude of the PPG waveform. For each subject, the mean SNR after filtering has been compared with raw signal SNR, taking the ratio between them. Then, the mean SNR for all subjects was calculated for each frame and window selection.
Annex B3 represents values of corrupted signal SNR and filtered mean SNR and Annex B4 lists the ratio of filtered mean SNR with SNR of corrupted signal, calculated for the given window and frame length of left index finger data of all subjects. Here Savitzky-Golay filter is used, which is a smoothing filter. In Annex A6 (c), we plotted mean filter SNR against frame length for all windows, i.e., window 3 (blue), window 5 (orange), and window 7 (grey) for left index finger PPG. It is observed that the maximum mean SNR for filtered PPG is associated with Windows 3 for all frames, and SNR increases with an increase in the length of the frame for the Savitzky-Golay filter. Annex A6 (d) represents the graph of the filtered mean SNR for the Savitzky-Golay filter to raw mean SNR against frame length for all windows for the left index finger. Maximum SNR ratios are associated with Windows three for all frame lengths and SNR ratios.
Now, a comparison between Annex A6 (a) and Annex A6 (c) shows a small difference between the SNR of the filtered signal taken from the right and left index finger, respectively. There-fore, it can be concluded that with a smoothing filter used for the preprocessing signal with white Gaussian noise, the SNRs change slightly; however right finger may be preferred to record the signal.
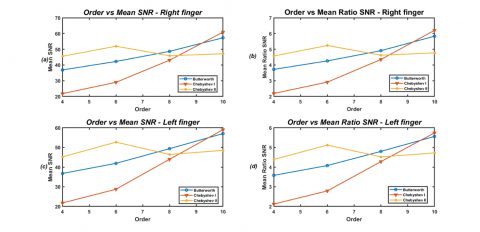
Annex B5 to B8 list the mean SNR values for the PPG signal recorded from the right index finger, and filtered with Butterworth, Chebyshev I, and Chebyshev II filters with filter order ranging from 4 to 10. It can be seen from these tables that the mean SNR ratio for all right-hand finger data processed using Butterworth, Chebyshev I, and Chebyshev II filters are slightly higher than the SNR ratios for left-hand finger for all filter orders. Annex A7 (a) and Annex A7 (c), represent for these filters that SNR for right index fingers is slightly better than SNR for left index fingers. It can be seen from these tables that the mean SNR ratio for all right-hand finger data processed using Butterworth, Chebyshev I, and Chebyshev II filters are slightly higher than the SNR ratios for left-hand finger for all filter orders. This analysis suggests that the difference remains small with an increase in filter order. It suggests right index finger can be preferred for a given device for signal recording. For orders 4 and 6, the SNR for Cheby-shev II is greater than Butterworth and Chebyshev I; however, for higher orders, the SNR of Butterworth is more. Chebyshev, I have the lowest SNR for all cases except for filter order 10, which has the highest SNR. In Annex A7 (a), the mean filtered SNR for Butterworth (Blue), Chebyshev I (Orange), and Chebyshev II (grey) was plotted against the order of the filter. The graph shows a de-creasing trend of SNR for Chebyshev II and an increasing trend for Butterworth, and Cheby-shev I. Chebyshev I order=10 has the largest SNR for the right index finger.
In Annex A7 (b) the ratio of filtered SNR with raw signal SNR has been plotted against the filter order for the three discussed filters. As explained, the increasing trend for Butter-worth and Chebyshev I and decreasing trend for Chebyshev II is evident. The maximum ratio is associated with Chebyshev I filter at order=10.
The last four tables from Annex B9 to Annex B12 represent mean filtered SNR values from the left index finger. The data has been filtered using Butterworth, Chebyshev I, and Chebyshev II filters and the order varied from 4 to 10. Then Ratio of SNR is calculated as the ratio of mean filtered SNR to raw SNR. It can be seen from these tables that the mean SNR ratio for all right-hand finger data processed using Butterworth, Chebyshev I, and Chebyshev II filters are slightly higher than the SNR ratios for left-hand finger for all filter orders. In Annex A7 (c) and Annex A7 (d), the mean SNR after the filter and the ratio of this SNR with raw signal SNR using the mentioned three filters have been plotted against the order of the filter, respectively for the left index finger. For the Chebyshev II filter, the mean SNR decreases with an increase in filter order whereas, for the other two, it increases with increasing filter order. The maximum SNR is associated with the Chebyshev filter of order 10. The SNR of Chebyshev I is less for all other orders, however.
Annex B 13 shows the percentage difference in value between the mean SNR of the right-index finger and left-hand index finger. For all filters and filter settings, the right index finger has a higher value of mean SNR. The percentage difference is calculated as:
$D=(R-L) /((R+L) / 2) * 100$ (1)
where,
D=Percentage Difference.
R=Mean ratio SNR for right index finger.
L=Mean Ratio SNR for left index finger.
The proposed study has been done with a limited dataset at this stage with one kind of added noise only. However, we have established numerically with the given recording system it may be more appropriate to use the right index finger in the data collection protocol for establishing a larger PPG dataset. Among the averaging or smoothing filters, we have chosen the Savitzky-Golay filters while from the IIR filters, Butterworth, Chebyshev I, and Chebyshev II have been considered. For assessing the signal quality index only, the signal-to-noise ratio has been considered.
In the given work, an assessment has been made to analyze the signal quality of PPG recorded from the index fingers of both hands. Apart from IIR filters, we have employed the Savitzky-Golay filter for smoothing after corrupting the signal with white Gaussian noise. The S-G filter is an excellent smoothing filter for the white Gaussian noise and can be considered when a good quality PPG sensor has been used. We found that the maximum SNR in the case of this filter is associated with a window length of 3 for our data. The SNR of PPG from the right hand is slightly better than the left index finger; however, the difference is small when the S-G filter is used. In the case of IIR filters, Chebyshev I outperformed Butterworth and Chebyshev II for higher orders. For Chebyshev II, SNR decreases as the filter order is increased. Like the Savitzky-Golay filter, the SNR for the right index finger is higher for IIR filters.
In previous studies, Přibil et al. [44] compared two different measurement sites fingers and ears to develop a PPG sensor to work in the magnetic field. We have compared the most common sites i.e., index fingers and attempted to establish if it is better to use any of them for PPG data collection. Tarvirdizadeh et al. [45] used statistical methods such as linear correlation using the Pearson correlation coefficient and paired t-test between features extracted from PPG signal recorded from different fingers of the right and left hand. Their experiment design greatly varies from the work discussed above and they did not find any salient difference among the features obtained, however, we have established that in the preprocessing step, before extraction of features, the signal recorded from the right index finger has better signal to noise ratio than the one recorded using the left index finger.
In the future, high-frequency noises and movement artifacts can be introduced while re-cording the PPG signal and compared to find the optimal filter and finger for data collection. We also intend to analyze other datasets by adding similar kinds of noise and filtering techniques for the sake of comparison. We also propose adding more subjects to future studies.
The authors would like to thank Ms. Tabarka Rajab, and Dr. Saad Jawaid Khan and Mr. Muhammad Rizwan for their constant support during this work.
Annex A
Annex A1. (a) The single-sided amplitude spectrum of the corrupted signal of right-hand side data of subject 11, the corrupted signal exists on frequency scales of 0-30Hz, the graph has been generated by taking the FFT of the noise-corrupted signal; (b) the single-sided amplitude spectrum of the original signal of right-hand side data of subject 2, the original signal has a frequency spectrum of 0-5Hz approx, this graph has been calculated after taking the FFT of the original signal, the amplitude spectrum against the frequency of every subject was employed to get the cutoff frequencies for the IIR bandpass filters, we have designed and applied butterworth, chebyshev I, and chebyshev II filters with filter order multiples of 2, i.e., order=4, 6, 8 and 10
Annex A2. (a) Frequency response magnitude in dB plotted against normalized frequency for all orders of butterworth filter, the higher the filter order more ripples are observed, butterworth’s fourth order does not have any ripples and seems a better choice; (b) frequency response magnitude in dB plotted against normalized frequency for all orders of chebyshev I filter, the higher the filter order more ripples are observed; (c) frequency response magnitude in dB plotted against normalized frequency for all orders of chebyshev II filter, the ripples are present in the passband, a peculiar characteristic of chebyshev filters
Annex A3. (a) Frequency response magnitude in dB plotted against actual frequency for butterworth filters, the magnitude starts decreasing at the higher cutoff frequency of 5Hz, the magnitude reaches 0dB after 15Hz, it can be seen for all filter orders that a considerable range of unwanted frequencies passes through the pass band, the phase (in radians) is plotted against the actual frequency for butterworth filters; (b) magnitude in dB plotted against actual frequency for chebyshev I filter, the magnitude starts decreasing at the higher cutoff frequency of 5Hz, the magnitude reaches 0dB before 15Hz, the phase (in radians) plotted against the actual frequency for chebyshev I filters; (c) frequency response of chebyshev II magnitude in dB plotted against actual frequency, the magnitude starts decreasing before the higher cutoff frequency of 5Hz, many ripples are present in the passband, the phase (in radians) plotted against the actual frequency for chebyshev II filters
Annex A4. (a) Pole-zero plot of butterworth filter orders 4, 6, 8, and 10, the poles are inside the unit circle; hence the system is stable; (b) pole-zero plot of chebyshev I filter, the poles are all inside the unit circle; hence, the system is stable, and (c) pole-zero plot of chebyshev II filter, the poles are inside the unit circle, so the system is stable
Annex A5. (a) Savitzky-golay filter applied on PPG segment from the right index finger of subject 2 for widow=3, and all frames were plotted, it smooths the data, preserves the PPG signal’s systolic and diastolic peaks, and retains the diachronic notch; (b) butterworth filter applied on PPG segment from the left index finger of subject 6, the filter has efficiently removed noise; however, some extra ripples are still present at some points, more evident with a higher-order filter (order 10-green waveform), the signal in blue has noise; (c) chebyshev I filter was applied on the PPG segment from the left index finger of subject 6, noise has been efficiently removed by the filter and has more ripples than butterworth, the waveform in blue represents the noisy signal, the rest of the waveforms are filtered chebyshev I filter of different orders as shown in the legend, the amplitude of the PPG waveform changes with filter order; (d) chebyshev II filter was applied on the PPG segment from the right index finger of subject 6, the filter has efficiently removed noise, the blue waveform shows the noisy signal, the other waveforms are signal filtered using chebyshev II of orders 4, 6, 8, and 10, the amplitude of PPG varies slightly with filter order
Annex A6. (a) The frame lengths plotted against mean SNR values (mean SNR of all subjects for each frame) of the savitzky-golay filter for each window length, the PPG recording was taken from the right index finger; (b) the frame lengths are plotted against mean SNR ratio values (SNR of all subjects for each frame divided by corrupted signal SNR and then mean taken for all individuals) of the savitzky-golay filter for each window length, the PPG recording was taken from the right index finger; (c) the frame lengths are plotted against the mean SNR values (mean SNR of all subjects for each frame) of the savitzky-golay filter for each window length, the PPG recording was taken from the left index finger; (d) the frame lengths are plotted against mean SNR ratio values (SNR of all subjects for each frame divided by raw signal SNR and then mean taken for all individuals) of the savitzky-golay filter for each window length, the PPG recording was taken from the left index finger
Annex A7. (a) The filter lengths plotted against mean SNR values (mean SNR of all subjects for each frame for butterworth, chebyshev I, and chebyshev II filters, respectively, the PPG recording was taken from the right index finger; (b) the order of filters plotted against mean ratio SNR (SNR of all subjects for each frame divided by raw signal SNR and then mean taken for all individuals) for each frame for butterworth, chebyshev I, and chebyshev II filters, respectively, the PPG recording was taken from the right index finger; (c) the order of filters plotted against mean SNR values (mean SNR of all subjects for each frame for butterworth, chebyshev I, and chebyshev II filters, respectively, the PPG recording was taken from the left index finger; (d) the order of filters plotted against mean ratio SNR (SNR of all subjects for each frame divided by raw signal SNR and then mean taken for all individuals) for each frame for butterworth, chebyshev I, and chebyshev II filters, respectively, the PPG recordings are from the left index finger
Annex B
Annex B1. Raw and savitzky-golay filtered SNR values for various window and frame lengths for all the PPG recordings from the subjects’ right index fingers, raw SNR values in the top row are obtained as the mean SNR of a noise-corrupted signal before filtering, then S-G filters are applied over a fixed window length for an ascending order of frame length, for each subject’s PPG recording, a mean of filtered SNR has been calculated as shown in each row under savitzky-golay filter SNR-right finger data, finally, the mean SNR of all subjects has been calculated for each window and frame length and presented under the column mean SNR
|
Subject ID |
1 |
2 |
3 |
4 |
5 |
6 |
7 |
8 |
9 |
10 |
11 |
Mean SNR |
|
|
SNR RAW |
11.40 |
8.68 |
9.34 |
8.19 |
9.97 |
9.13 |
10.95 |
10.57 |
12.23 |
12.02 |
8.23 |
10.07 |
|
|
Savitzky-Golay Filter SNR-Right finger Data |
|||||||||||||
|
window=3 |
f=5 |
17.71 |
14.48 |
15.02 |
14.40 |
14.06 |
15.63 |
16.54 |
16.79 |
18.17 |
18.99 |
15.19 |
16.09 |
|
f=7 |
21.35 |
17.63 |
17.75 |
17.75 |
15.91 |
19.42 |
19.49 |
20.25 |
21.46 |
23.07 |
19.26 |
19.39 |
|
|
f=9 |
24.26 |
20.22 |
19.72 |
20.06 |
17.52 |
22.48 |
22.19 |
23.20 |
24.60 |
25.63 |
22.61 |
22.04 |
|
|
f=11 |
26.87 |
22.90 |
21.48 |
22.27 |
19.83 |
25.13 |
24.99 |
26.20 |
28.11 |
27.91 |
25.75 |
24.68 |
|
|
f=13 |
27.66 |
24.08 |
22.08 |
23.76 |
20.61 |
26.12 |
26.45 |
27.40 |
28.61 |
29.27 |
27.17 |
25.75 |
|
|
f=15 |
28.92 |
25.18 |
22.58 |
30.78 |
21.41 |
27.70 |
27.95 |
28.90 |
29.67 |
30.47 |
28.85 |
27.49 |
|
|
window=5 |
f=7 |
16.51 |
13.40 |
14.00 |
13.22 |
13.39 |
14.38 |
15.55 |
15.64 |
17.11 |
17.59 |
13.85 |
14.97 |
|
f=9 |
19.13 |
15.72 |
16.20 |
15.76 |
14.74 |
17.08 |
17.60 |
18.12 |
18.88 |
20.71 |
16.75 |
17.34 |
|
|
f=11 |
22.12 |
18.26 |
18.35 |
18.48 |
16.14 |
20.24 |
19.86 |
20.92 |
21.97 |
24.17 |
20.07 |
20.05 |
|
|
f=13 |
24.48 |
20.23 |
19.90 |
20.14 |
17.29 |
20.23 |
21.79 |
23.15 |
24.29 |
26.08 |
22.65 |
21.84 |
|
|
f=15 |
26.63 |
22.14 |
21.10 |
21.68 |
18.60 |
24.66 |
23.97 |
25.16 |
27.00 |
27.58 |
24.95 |
23.95 |
|
|
window=7 |
f=9 |
15.84 |
12.78 |
13.42 |
12.55 |
12.98 |
13.69 |
14.94 |
14.96 |
16.47 |
16.85 |
13.10 |
14.33 |
|
f=11 |
17.36 |
14.87 |
15.43 |
14.88 |
14.21 |
16.08 |
16.74 |
17.20 |
18.49 |
19.66 |
15.70 |
16.42 |
|
|
f=13 |
20.55 |
16.93 |
17.31 |
17.16 |
15.35 |
17.02 |
18.58 |
19.42 |
20.48 |
22.63 |
18.34 |
18.52 |
|
|
f=15 |
22.30 |
18.36 |
18.46 |
18.65 |
16.11 |
20.42 |
19.86 |
20.99 |
21.94 |
20.53 |
20.21 |
19.80 |
|
Annex B2. The ratio of SNR is calculated for each subject after the filter has been applied, the mean ratio SNR is the average SNR of all subjects taken for each frame divided by raw SNR, for each subject’s PPG recording, a ratio of mean filtered SNR to noise-corrupted raw SNR has been calculated as shown in each row, finally, the mean ratio SNR of all subjects has been calculated for each window and frame length and presented under the column mean ratio SNR
|
Subject ID |
1 |
2 |
3 |
4 |
5 |
6 |
7 |
8 |
9 |
10 |
11 |
Mean Ratio SNR |
|
|
Window=3 |
f=5 |
1.55 |
1.67 |
1.61 |
1.76 |
1.41 |
1.71 |
1.51 |
1.59 |
1.49 |
1.58 |
1.85 |
1.61 |
|
f=7 |
1.87 |
2.03 |
1.90 |
2.17 |
1.60 |
2.13 |
1.78 |
1.92 |
1.75 |
1.92 |
2.34 |
1.95 |
|
|
f=9 |
2.13 |
2.33 |
2.11 |
2.45 |
1.76 |
2.46 |
2.03 |
2.20 |
2.01 |
2.13 |
2.75 |
2.21 |
|
|
f=11 |
2.36 |
2.64 |
2.30 |
2.72 |
1.99 |
2.75 |
2.28 |
2.48 |
2.30 |
2.32 |
3.13 |
2.48 |
|
|
f=13 |
2.43 |
2.77 |
2.36 |
2.90 |
2.07 |
2.86 |
2.42 |
2.59 |
2.34 |
2.43 |
3.30 |
2.59 |
|
|
f=15 |
2.54 |
2.90 |
2.42 |
3.76 |
2.15 |
3.03 |
2.55 |
2.73 |
2.43 |
2.53 |
3.50 |
2.78 |
|
|
Window=5 |
f=7 |
1.45 |
1.54 |
1.50 |
1.61 |
1.34 |
1.57 |
1.42 |
1.48 |
1.40 |
1.46 |
1.68 |
1.50 |
|
f=9 |
1.68 |
1.81 |
1.73 |
1.92 |
1.48 |
1.87 |
1.61 |
1.71 |
1.54 |
1.72 |
2.03 |
1.74 |
|
|
f=11 |
1.94 |
2.10 |
1.96 |
2.26 |
1.62 |
2.22 |
1.81 |
1.98 |
1.80 |
2.01 |
2.44 |
2.01 |
|
|
f=13 |
2.15 |
2.33 |
2.13 |
2.46 |
1.73 |
2.22 |
1.99 |
2.19 |
1.99 |
2.17 |
2.75 |
2.19 |
|
|
f=15 |
2.34 |
2.55 |
2.26 |
2.65 |
1.87 |
2.70 |
2.19 |
2.38 |
2.21 |
2.29 |
3.03 |
2.41 |
|
|
Window=7 |
f=9 |
1.39 |
1.47 |
1.44 |
1.53 |
1.30 |
1.50 |
1.36 |
1.42 |
1.35 |
1.40 |
1.59 |
1.43 |
|
f=11 |
1.52 |
1.71 |
1.65 |
1.82 |
1.43 |
1.76 |
1.53 |
1.63 |
1.51 |
1.64 |
1.91 |
1.65 |
|
|
f=13 |
1.80 |
1.95 |
1.85 |
2.10 |
1.54 |
1.86 |
1.70 |
1.84 |
1.67 |
1.88 |
2.23 |
1.86 |
|
|
f=15 |
1.96 |
2.12 |
1.98 |
2.28 |
1.62 |
2.24 |
1.81 |
1.99 |
1.79 |
1.71 |
2.46 |
1.99 |
|
|
Mean |
1.94 |
2.13 |
1.95 |
2.29 |
1.66 |
2.19 |
1.87 |
2.01 |
1.84 |
1.96 |
2.47 |
2.03 |
|
Annex B3. SNR values for various window and frame lengths for all the PPG recordings from left index fingers, raw SNR values in the top row are obtained as the mean SNR of the noise-corrupted signal before filtering, then S-G filters are applied over a fixed window length for an ascending order of frame length, for each subject’s PPG recording, a mean of filtered SNR has been calculated as shown in each row under savitzky-golay filter SNR-left finger data, finally, the mean SNR of all subjects has been calculated for each window and frame length and presented under the column mean SNR
|
Subject ID |
1 |
2 |
3 |
4 |
5 |
6 |
7 |
8 |
9 |
10 |
11 |
Mean |
|
|
SNR RAW |
9.74 |
8.98 |
10.65 |
10.78 |
10.74 |
9.50 |
9.43 |
9.60 |
11.49 |
10.71 |
11.26 |
10.26 |
|
|
Savitzky-Golay Filter SNR-Left finger Data |
|||||||||||||
|
window=3 |
f=5 |
16.81 |
15.38 |
16.71 |
17.81 |
15.59 |
14.85 |
15.06 |
15.32 |
17.61 |
16.81 |
18.16 |
16.37 |
|
f=7 |
20.95 |
19.11 |
19.95 |
21.99 |
18.00 |
17.85 |
17.90 |
18.44 |
21.08 |
19.82 |
22.23 |
19.76 |
|
|
f=9 |
24.15 |
21.94 |
22.33 |
25.42 |
20.28 |
20.34 |
20.66 |
20.96 |
24.14 |
21.69 |
25.56 |
22.50 |
|
|
f=11 |
27.02 |
24.62 |
24.47 |
28.46 |
22.80 |
22.74 |
24.40 |
23.23 |
27.25 |
23.60 |
28.49 |
25.19 |
|
|
f=13 |
28.25 |
25.65 |
25.40 |
29.47 |
24.60 |
23.82 |
25.79 |
24.25 |
28.46 |
24.93 |
29.22 |
26.35 |
|
|
f=15 |
29.74 |
26.90 |
26.03 |
25.30 |
26.32 |
25.12 |
27.26 |
25.49 |
29.78 |
26.25 |
30.86 |
27.19 |
|
|
window=5 |
f=7 |
15.44 |
14.17 |
15.57 |
16.46 |
14.76 |
13.86 |
14.77 |
14.28 |
16.49 |
15.69 |
16.84 |
15.30 |
|
f=9 |
18.45 |
16.82 |
18.05 |
19.43 |
16.45 |
15.94 |
16.84 |
16.50 |
19.36 |
18.10 |
19.76 |
17.79 |
|
|
f=11 |
21.88 |
19.88 |
20.68 |
22.90 |
18.28 |
18.40 |
19.15 |
18.95 |
21.68 |
20.41 |
23.05 |
20.48 |
|
|
f=13 |
24.31 |
22.13 |
22.47 |
25.69 |
19.79 |
22.66 |
21.08 |
20.89 |
23.98 |
21.72 |
25.64 |
22.76 |
|
|
f=15 |
26.54 |
24.21 |
24.15 |
27.88 |
21.51 |
22.05 |
23.29 |
25.16 |
26.51 |
22.89 |
27.94 |
24.74 |
|
|
window=7 |
f=9 |
14.68 |
13.49 |
14.94 |
15.72 |
14.25 |
13.30 |
14.15 |
13.68 |
15.84 |
15.06 |
16.09 |
14.65 |
|
f=11 |
18.17 |
15.84 |
17.18 |
18.37 |
15.74 |
15.16 |
15.99 |
17.20 |
17.96 |
17.31 |
18.66 |
17.05 |
|
|
f=13 |
20.12 |
18.22 |
19.38 |
21.07 |
17.25 |
18.56 |
17.86 |
19.42 |
20.07 |
19.40 |
21.34 |
19.33 |
|
|
f=15 |
22.08 |
19.89 |
20.83 |
23.12 |
18.24 |
18.36 |
19.14 |
20.99 |
21.64 |
24.47 |
23.20 |
21.09 |
|
Annex B4. The ratio of filtered SNR with SNR of the raw filter was calculated for all individuals for the left index finger data, the mean ratio SNR is the average SNR of all subjects taken for each frame, for each subject’s PPG recording, a ratio of mean filtered SNR to noise-corrupted raw SNR has been calculated as shown in each row, finally, the mean ratio SNR of all subjects has been calculated for each window and frame length and presented under the column mean ratio SNR
|
Subject ID |
1 |
2 |
3 |
4 |
5 |
6 |
7 |
8 |
9 |
10 |
11 |
Mean Ratio SNR |
|
|
Window=3 |
f=5 |
1.73 |
1.71 |
1.57 |
1.65 |
1.45 |
1.56 |
1.60 |
1.60 |
1.53 |
1.57 |
1.61 |
1.60 |
|
f=7 |
2.15 |
2.13 |
1.87 |
2.04 |
1.68 |
1.88 |
1.90 |
1.92 |
1.83 |
1.85 |
1.97 |
1.93 |
|
|
f=9 |
2.48 |
2.44 |
2.10 |
2.36 |
1.89 |
2.14 |
2.19 |
2.18 |
2.10 |
2.03 |
2.27 |
2.20 |
|
|
f=11 |
2.77 |
2.74 |
2.30 |
2.64 |
2.12 |
2.39 |
2.59 |
2.42 |
2.37 |
2.20 |
2.53 |
2.46 |
|
|
f=13 |
2.90 |
2.86 |
2.39 |
2.73 |
2.29 |
2.51 |
2.73 |
2.53 |
2.48 |
2.33 |
2.59 |
2.58 |
|
|
f=15 |
3.05 |
3.00 |
2.44 |
2.35 |
2.45 |
2.64 |
2.89 |
2.66 |
2.59 |
2.45 |
2.74 |
2.66 |
|
|
Window=5 |
f=7 |
1.58 |
1.58 |
1.46 |
1.53 |
1.37 |
1.46 |
1.57 |
1.49 |
1.44 |
1.46 |
1.50 |
1.49 |
|
f=9 |
1.89 |
1.87 |
1.69 |
1.80 |
1.53 |
1.68 |
1.79 |
1.72 |
1.68 |
1.69 |
1.75 |
1.74 |
|
|
f=11 |
2.25 |
2.21 |
1.94 |
2.12 |
1.70 |
1.94 |
2.03 |
1.97 |
1.89 |
1.91 |
2.05 |
2.00 |
|
|
f=13 |
2.50 |
2.46 |
2.11 |
2.38 |
1.84 |
2.38 |
2.24 |
2.18 |
2.09 |
2.03 |
2.28 |
2.23 |
|
|
f=15 |
2.72 |
2.70 |
2.27 |
2.59 |
2.00 |
2.32 |
2.47 |
2.62 |
2.31 |
2.14 |
2.48 |
2.42 |
|
|
Window=7 |
f=9 |
1.51 |
1.50 |
1.40 |
1.46 |
1.33 |
1.40 |
1.50 |
1.42 |
1.38 |
1.41 |
1.43 |
1.43 |
|
f=11 |
1.87 |
1.76 |
1.61 |
1.70 |
1.47 |
1.60 |
1.70 |
1.79 |
1.56 |
1.62 |
1.66 |
1.67 |
|
|
f=13 |
2.07 |
2.03 |
1.82 |
1.95 |
1.61 |
1.95 |
1.89 |
2.02 |
1.75 |
1.81 |
1.89 |
1.89 |
|
|
f=15 |
2.27 |
2.22 |
1.96 |
2.14 |
1.70 |
1.93 |
2.03 |
2.19 |
1.88 |
2.29 |
2.06 |
2.06 |
|
|
Mean |
1.94 |
2.25 |
2.21 |
1.93 |
2.10 |
1.76 |
1.99 |
2.07 |
2.05 |
1.93 |
1.92 |
2.02 |
|
Annex B5. SNR values for butterworth, chebyshev I, and chebyshev II filter for all cases of the right hand when filter order is set to four, for each subject, the mean SNR of the noise-corrupted PPG has been calculated and presented as SNR before the filter in the table, for order 4 of each IIR filter, the mean SNR after the filter has been calculated and presented as SNR after the filter, the ratio of mean SNR after the filter to SNR before the filter has been calculated for each filter and presented as the mean ratio SNR in the table below, finally, in the last row, the mean of these mean SNR before, and after the filter and mean ratio, SNR has been calculated for all subjects
|
Right Finger Order 4 |
|||||||
|
ID |
SNR before filter |
SNR after filter |
Mean Ratio SNR |
||||
|
Butter |
cheby1 |
cheby2 |
Butter |
cheby1 |
cheby2 |
||
|
ID_1 |
11.40 |
39.11 |
21.98 |
44.10 |
3.43 |
1.93 |
3.87 |
|
ID_2 |
8.68 |
34.55 |
18.09 |
39.37 |
3.98 |
2.08 |
4.53 |
|
ID_3 |
9.34 |
36.13 |
20.86 |
37.48 |
3.87 |
2.23 |
4.01 |
|
ID_4 |
8.19 |
35.15 |
22.04 |
40.89 |
4.29 |
2.69 |
4.99 |
|
ID_5 |
9.97 |
28.53 |
17.01 |
50.11 |
2.86 |
1.71 |
5.02 |
|
ID_6 |
9.13 |
39.50 |
22.60 |
47.44 |
4.32 |
2.47 |
5.19 |
|
ID_7 |
10.95 |
32.24 |
21.94 |
49.49 |
2.94 |
2.00 |
4.52 |
|
ID_8 |
10.58 |
36.55 |
23.80 |
46.06 |
3.46 |
2.25 |
4.35 |
|
ID_9 |
12.23 |
35.87 |
23.92 |
52.90 |
2.93 |
1.96 |
4.32 |
|
1D_10 |
12.02 |
48.52 |
27.25 |
47.77 |
4.04 |
2.27 |
3.98 |
|
ID_11 |
8.23 |
39.20 |
20.34 |
45.19 |
4.76 |
2.47 |
5.49 |
|
10.07 |
36.85 |
21.80 |
45.53 |
3.72 |
2.19 |
4.57 |
|
Annex B6. SNR values for butterworth, chebyshev I, and chebyshev II filter for all cases of the right hand when filter order is set to six, for each subject, the mean SNR of the noise-corrupted PPG has been calculated and presented as SNR before the filter in the table, for order 6 of each IIR filter, the mean SNR after the filter has been calculated and presented as SNR after the filter, the ratio of mean SNR after the filter to SNR before the filter has been calculated for each filter and presented as the mean ratio SNR in the table below, finally, in the last row, the mean of these mean SNR before, and after the filter and mean ratio, SNR has been calculated for all subjects
|
Right Finger Order 6 |
|||||||
|
ID |
SNR before filter |
SNR after filter |
Ratio SNR |
||||
|
Butter |
cheby1 |
cheby2 |
Butter |
cheby1 |
cheby2 |
||
|
ID_1 |
11.40 |
46.68 |
31.21 |
54.69 |
4.10 |
2.74 |
4.80 |
|
ID_2 |
8.68 |
40.96 |
26.57 |
48.72 |
4.72 |
3.06 |
5.61 |
|
ID_3 |
9.34 |
38.85 |
27.01 |
49.18 |
4.16 |
2.89 |
5.27 |
|
ID_4 |
8.19 |
40.86 |
30.05 |
46.29 |
4.99 |
3.67 |
5.65 |
|
ID_5 |
9.97 |
26.70 |
20.78 |
43.47 |
2.68 |
2.08 |
4.36 |
|
ID_6 |
9.13 |
48.13 |
29.76 |
55.75 |
5.27 |
3.26 |
6.10 |
|
ID_7 |
10.95 |
36.14 |
29.03 |
49.92 |
3.30 |
2.65 |
4.56 |
|
ID_8 |
10.58 |
41.38 |
28.37 |
54.66 |
3.91 |
2.68 |
5.17 |
|
ID_9 |
12.23 |
40.73 |
30.97 |
52.58 |
3.33 |
2.53 |
4.30 |
|
1D_10 |
12.02 |
59.68 |
39.25 |
59.89 |
4.97 |
3.27 |
4.98 |
|
ID_11 |
8.23 |
44.53 |
25.87 |
56.17 |
5.41 |
3.14 |
6.83 |
|
10.07 |
42.24 |
28.99 |
51.94 |
4.26 |
2.91 |
5.24 |
|
Annex B7. SNR values for butterworth, chebyshev I, and chebyshev II filter for all cases of the right hand when filter order is set to eight, for each subject, the mean SNR of the noise-corrupted PPG has been calculated and presented as SNR before the filter in the table, for order 8 of each IIR filter, the mean SNR after the filter has been calculated and presented as SNR after the filter, the ratio of mean SNR after the filter to SNR before the filter has been calculated for each filter and presented as the mean ratio SNR in the table below, finally, in the last row, the mean of these mean SNR before, and after the filter and mean ratio, SNR has been calculated for all subjects
|
Right Finger Order 8 |
|||||||
|
ID |
SNR before filter |
SNR after filter |
Ratio SNR |
||||
|
Butter |
cheby1 |
cheby2 |
Butter |
cheby1 |
cheby2 |
||
|
ID_1 |
11.40 |
55.49 |
48.64 |
49.08 |
4.87 |
4.27 |
4.31 |
|
ID_2 |
8.68 |
46.15 |
38.94 |
44.14 |
5.32 |
4.48 |
5.08 |
|
ID_3 |
9.34 |
46.33 |
44.52 |
45.52 |
4.96 |
4.77 |
4.88 |
|
ID_4 |
8.19 |
45.12 |
42.90 |
39.83 |
5.51 |
5.24 |
4.86 |
|
ID_5 |
9.97 |
34.05 |
27.29 |
38.33 |
3.41 |
2.74 |
3.84 |
|
ID_6 |
9.13 |
59.46 |
52.61 |
49.52 |
6.51 |
5.76 |
5.42 |
|
ID_7 |
10.95 |
40.56 |
37.43 |
43.33 |
3.70 |
3.42 |
3.96 |
|
ID_8 |
10.58 |
48.66 |
37.46 |
48.73 |
4.60 |
3.54 |
4.61 |
|
ID_9 |
12.23 |
42.21 |
35.33 |
45.28 |
3.45 |
2.89 |
3.70 |
|
1D_10 |
12.02 |
66.13 |
63.47 |
53.36 |
5.50 |
5.28 |
4.44 |
|
ID_11 |
8.23 |
51.13 |
44.85 |
47.32 |
6.21 |
5.45 |
5.75 |
|
10.07 |
48.66 |
43.04 |
45.86 |
4.91 |
4.35 |
4.62 |
|
Annex B8. SNR values for butterworth, chebyshev I, and chebyshev II filter for all cases of the right hand when filter order is set 10, for each subject, the mean SNR of the raw noise corrupted PPG has been calculated and presented as SNR before the filter in the table, for order 10 of each IIR filter, the mean SNR after the filter has been calculated and presented as SNR after the filter, the ratio of mean SNR after the filter to SNR before the filter has been calculated for each filter and presented as the mean ratio SNR in the table below, finally, in the last row, the mean of these mean SNR before, and after the filter and mean ratio, SNR has been calculated for all subjects
|
Right Finger Order 10 |
|||||||
|
ID |
SNR before filter |
SNR after filter |
Ratio SNR |
||||
|
Butter |
cheby1 |
cheby2 |
Butter |
cheby1 |
cheby2 |
||
|
ID_1 |
11.40 |
64.21 |
69.82 |
50.46 |
5.63 |
6.13 |
4.43 |
|
ID_2 |
8.68 |
60.46 |
52.78 |
44.01 |
6.96 |
6.08 |
5.07 |
|
ID_3 |
9.34 |
60.58 |
69.09 |
47.92 |
6.49 |
7.40 |
5.13 |
|
ID_4 |
8.19 |
60.35 |
60.69 |
40.83 |
7.37 |
7.41 |
4.99 |
|
ID_5 |
9.97 |
42.25 |
40.55 |
40.56 |
4.24 |
4.07 |
4.07 |
|
ID_6 |
9.13 |
66.88 |
75.83 |
49.73 |
7.32 |
8.30 |
5.44 |
|
ID_7 |
10.95 |
44.89 |
47.51 |
43.34 |
4.10 |
4.34 |
3.96 |
|
ID_8 |
10.58 |
48.69 |
55.19 |
47.08 |
4.73 |
5.36 |
4.57 |
|
ID_9 |
12.23 |
50.67 |
47.26 |
47.29 |
4.14 |
3.86 |
3.87 |
|
1D_10 |
12.02 |
72.43 |
79.66 |
55.37 |
6.03 |
6.63 |
4.61 |
|
ID_11 |
8.23 |
58.77 |
71.35 |
52.12 |
7.14 |
8.67 |
6.33 |
|
10.07 |
57.29 |
60.89 |
47.15 |
5.83 |
6.20 |
4.77 |
|
Annex B9. SNR values for butterworth, chebyshev I, and chebyshev II filter for all cases of the left hand when filter order is set 4, for each subject, the mean SNR of the noise-corrupted PPG has been calculated and presented as SNR before the filter in the table, for order 4 of each IIR filter, the mean SNR after the filter has been calculated and presented as SNR after the filter, the ratio of mean SNR after the filter to SNR before the filter has been calculated for each filter and presented as the mean ratio SNR in the table below, finally, in the last row, the mean of these mean SNR before, and after the filter and mean ratio, SNR has been calculated for all subjects
|
Left Finger Order 4 |
|||||||
|
ID |
SNR before filter |
SNR after filter |
Ratio SNR |
||||
|
Butter |
cheby1 |
cheby2 |
Butter |
cheby1 |
cheby2 |
||
|
ID_1 |
9.74 |
39.10 |
22.16 |
44.68 |
4.02 |
2.28 |
4.59 |
|
ID_2 |
8.98 |
39.66 |
21.79 |
44.39 |
4.42 |
2.43 |
4.95 |
|
ID_3 |
10.65 |
36.48 |
22.21 |
40.82 |
3.43 |
2.09 |
3.83 |
|
ID_4 |
10.78 |
39.76 |
21.34 |
45.11 |
3.69 |
1.98 |
4.18 |
|
ID_5 |
10.74 |
32.87 |
19.17 |
49.86 |
3.06 |
1.79 |
4.64 |
|
ID_6 |
9.50 |
35.53 |
20.14 |
43.61 |
3.74 |
2.12 |
4.59 |
|
ID_7 |
10.13 |
31.38 |
20.96 |
48.25 |
3.10 |
2.07 |
4.76 |
|
ID_8 |
9.60 |
35.45 |
21.57 |
43.88 |
3.69 |
2.25 |
4.57 |
|
ID_9 |
11.49 |
36.57 |
23.26 |
51.67 |
3.18 |
2.02 |
4.50 |
|
1D_10 |
10.71 |
37.72 |
22.36 |
40.40 |
3.52 |
2.09 |
3.77 |
|
ID_11 |
11.26 |
40.00 |
24.47 |
44.53 |
3.55 |
2.17 |
3.95 |
|
10.32 |
36.77 |
21.77 |
45.20 |
3.58 |
2.12 |
4.39 |
|
Annex B10. SNR values for butterworth, chebyshev I, and chebyshev II filter for all cases of the left hand when filter order is set 6, for each subject, the mean SNR of the noise-corrupted PPG has been calculated and presented as SNR before the filter in the table, for order 6 of each IIR filter, the mean SNR after the filter has been calculated and presented as SNR after the filter, the ratio of mean SNR after the filter to SNR before the filter has been calculated for each filter and presented as the mean ratio SNR in the table below, finally, in the last row, the mean of these mean SNR before, and after the filter and mean ratio, SNR has been calculated for all subjects
|
Left Finger Order 6 |
|||||||
|
ID |
SNR before filter |
SNR after filter |
Ratio SNR |
||||
|
Butter |
cheby1 |
cheby2 |
Butter |
cheby1 |
cheby2 |
||
|
ID_1 |
9.74 |
44.54 |
26.65 |
56.52 |
4.57 |
2.74 |
5.80 |
|
ID_2 |
8.98 |
44.86 |
28.32 |
51.43 |
5.00 |
3.16 |
5.73 |
|
ID_3 |
10.65 |
44.41 |
31.88 |
50.93 |
4.17 |
2.99 |
4.78 |
|
ID_4 |
10.78 |
48.40 |
32.83 |
56.98 |
4.49 |
3.05 |
5.28 |
|
ID_5 |
10.74 |
36.12 |
23.87 |
48.16 |
3.36 |
2.22 |
4.48 |
|
ID_6 |
9.50 |
39.45 |
23.41 |
51.14 |
4.15 |
2.46 |
5.38 |
|
ID_7 |
10.13 |
34.94 |
26.60 |
49.40 |
3.45 |
2.63 |
4.88 |
|
ID_8 |
9.60 |
39.94 |
26.97 |
50.93 |
4.16 |
2.81 |
5.30 |
|
ID_9 |
11.49 |
41.05 |
33.85 |
52.47 |
3.57 |
2.95 |
4.57 |
|
1D_10 |
10.71 |
42.97 |
32.09 |
52.60 |
4.01 |
2.99 |
4.91 |
|
ID_11 |
11.26 |
44.27 |
29.87 |
59.07 |
3.93 |
2.65 |
5.25 |
|
10.32 |
41.91 |
28.76 |
52.69 |
4.08 |
2.79 |
5.12 |
|
Annex B11. SNR values for butterworth, chebyshev I, and chebyshev II filter for all cases of the left hand when filter order is set 8, for each subject, the mean SNR of the noise-corrupted PPG has been calculated and presented as SNR before the filter in the table, for order 8 of each IIR filter, the mean SNR after the filter has been calculated and presented as SNR after the filter, the ratio of mean SNR after the filter to SNR before the filter has been calculated for each filter and presented as the mean ratio SNR in the table below, finally, in the last row, the mean of these mean SNR before, and after the filter and mean ratio, SNR has been calculated for all subjects
|
Left Finger Order 8 |
|||||||
|
ID |
SNR before filter |
SNR after filter |
Ratio SNR |
||||
|
Butter |
cheby1 |
cheby2 |
Butter |
cheby1 |
cheby2 |
||
|
ID_1 |
9.74 |
56.36 |
53.02 |
51.16 |
5.79 |
5.44 |
5.25 |
|
ID_2 |
8.98 |
49.25 |
41.19 |
48.28 |
5.49 |
4.59 |
5.38 |
|
ID_3 |
10.65 |
53.96 |
51.46 |
47.52 |
5.07 |
4.83 |
4.46 |
|
ID_4 |
10.78 |
52.53 |
46.84 |
47.72 |
4.87 |
4.34 |
4.43 |
|
ID_5 |
10.74 |
40.10 |
33.90 |
41.61 |
3.73 |
3.16 |
3.88 |
|
ID_6 |
9.50 |
48.58 |
46.49 |
42.67 |
5.11 |
4.90 |
4.49 |
|
ID_7 |
10.13 |
38.40 |
32.07 |
40.08 |
3.79 |
3.17 |
3.96 |
|
ID_8 |
9.60 |
44.46 |
37.46 |
42.72 |
4.63 |
3.90 |
4.45 |
|
ID_9 |
11.49 |
48.28 |
44.33 |
46.28 |
4.20 |
3.86 |
4.03 |
|
1D_10 |
10.71 |
53.52 |
49.33 |
48.62 |
5.00 |
4.60 |
4.54 |
|
ID_11 |
11.26 |
57.59 |
47.71 |
54.10 |
5.11 |
4.24 |
4.80 |
|
10.32 |
49.37 |
43.98 |
46.43 |
4.80 |
4.28 |
4.52 |
|
Annex B12. SNR values for butterworth, chebyshev I, and chebyshev II filter for all cases of the left hand when filter order is set to 10, for each subject, the mean SNR of the noise-corrupted PPG has been calculated and presented as SNR before the filter in the table, for order 10 of each IIR filter, the mean SNR after the filter has been calculated and presented as SNR after the filter, the ratio of mean SNR after the filter to SNR before the filter has been calculated for each filter and presented as the mean ratio SNR in the table below, finally, in the last row, the mean of these mean SNR before, and after the filter and mean ratio, SNR has been calculated for all subjects
|
Left Finger Order 10 |
|||||||
|
ID |
SNR before filter |
SNR after filter |
Ratio SNR |
||||
|
Butter |
cheby1 |
cheby2 |
Butter |
cheby1 |
cheby2 |
||
|
ID_1 |
9.74 |
62.63 |
70.61 |
52.01 |
6.43 |
7.25 |
5.34 |
|
ID_2 |
8.98 |
62.39 |
59.52 |
52.68 |
6.95 |
6.63 |
5.87 |
|
ID_3 |
10.65 |
58.58 |
63.78 |
46.91 |
5.50 |
5.99 |
4.41 |
|
ID_4 |
10.78 |
63.91 |
69.56 |
49.46 |
5.93 |
6.45 |
4.59 |
|
ID_5 |
10.74 |
50.72 |
46.94 |
45.22 |
4.72 |
4.37 |
4.21 |
|
ID_6 |
9.50 |
53.74 |
57.23 |
44.37 |
5.66 |
6.03 |
4.67 |
|
ID_7 |
10.13 |
45.55 |
37.08 |
41.75 |
4.50 |
3.66 |
4.12 |
|
ID_8 |
9.60 |
54.85 |
54.17 |
46.02 |
5.71 |
5.64 |
4.79 |
|
ID_9 |
11.49 |
53.32 |
53.08 |
51.20 |
4.64 |
4.62 |
4.46 |
|
1D_10 |
10.71 |
60.98 |
69.66 |
49.77 |
5.69 |
6.50 |
4.64 |
|
ID_11 |
11.26 |
60.87 |
67.66 |
54.21 |
5.41 |
6.01 |
4.81 |
|
10.32 |
57.05 |
59.03 |
48.51 |
5.56 |
5.74 |
4.72 |
|
Annex B13. Percentage difference of value between mean SNR of the right hand and mean SNR of the left hand, it is calculated by taking the absolute difference of value divided by the mean of the values and the ratio multiplied by 100, the table shows each mean SNR
|
Filter |
Order |
Mean Ratio SNR |
Percentage Difference (D) |
|
|
Right Hand (R) |
Left Hand (L) |
|||
|
S-G |
Mean for all frames & windows |
2.03 |
2.04 |
0.49% |
|
Butterworth |
4 |
3.72 |
3.58 |
3.84% |
|
6 |
4.26 |
4.08 |
4.32% |
|
|
8 |
4.91 |
4.8 |
2.27% |
|
|
10 |
5.83 |
5.56 |
4.74% |
|
|
Chebyshev I |
4 |
2.19 |
2.12 |
3.25% |
|
6 |
2.91 |
2.79 |
4.21% |
|
|
8 |
4.35 |
4.28 |
1.62% |
|
|
10 |
6.2 |
5.74 |
7.71% |
|
|
Chebyshev II |
4 |
4.57 |
4.39 |
4.02% |
|
6 |
5.24 |
5.12 |
2.32% |
|
|
8 |
4.62 |
4.52 |
2.19% |
|
|
10 |
4.77 |
4.72 |
1.05% |
|
[1] Tamura, T. (2019). Current progress of photoplethysmography and SPO2 for health monitoring. Biomedical Engineering Letters, 9(1): 21-36. https://doi.org/10.1007/s13534-019-00097-w
[2] Castaneda, D., Esparza, A., Ghamari, M., Soltanpur, C., Nazeran, H. (2018). A review on wearable photoplethysmography sensors and their potential future applications in health care. International Journal of Biosensors & Bioelectronics, 4(4): 195-202. https://doi.org/10.15406/ijbsbe.2018.04.00125
[3] Slapničar, G., Luštrek, M., Marinko, M. (2018). Continuous blood pressure estimation from PPG signal. Informatica, 42(1): 33-42.
[4] Nath, R.K., Thapliyal, H., Caban-Holt, A. (2018). Towards photoplethysmogram based non-invasive blood pressure classification. In 2018 IEEE International Symposium on Smart Electronic Systems (iSES) (Formerly iNiS), IEEE, 37-39. https://doi.org/10.1109/iSES.2018.00018
[5] De La Sierra, A. (2016). Ambulatory blood pressure monitoring is a useful tool for all patients. Hipertensión y Riesgo Vascular, 34(1): 45-49. https://doi.org/10.1016/j.hipert.2016.06.004
[6] Li, Y., Gao, H., Ma, Y. (2017). Evaluation of pulse oximeter derived photoplethysmographic signals for obstructive sleep apnea diagnosis. Medicine, 96(18): e6755. https://doi.org/10.1097/MD.0000000000006755
[7] Park, J.U., Lee, H.K., Lee, J., Urtnasan, E., Kim, H., Lee, K.J. (2015). Automatic classification of apnea/hypopnea events through sleep/wake states and severity of SDB from a pulse oximeter. Physiological Measurement, 36(9): 2009. https://doi.org/10.1088/0967-3334/36/9/2009
[8] Moreno, E.M., Lujan, M.J.A., Rusinol, M.T., Fernandez, P.J., Manrique, P.N., Trivino, C.A., Miquel, M.P., Rodríguez, M.A., Burguillos, M.J.G. (2016). Type 2 diabetes screening test by means of a pulse oximeter. IEEE Transactions on Biomedical Engineering, 64(2): 341-351. https://doi.org/10.1109/TBME.2016.2554661
[9] Casal, R., Di Persia, L.E., Schlotthauer, G. (2019). Sleep-wake stages classification using heart rate signals from pulse oximetry. Heliyon, 5(10): e02529. https://doi.org/10.1016/j.heliyon.2019.e02529
[10] Alqaraawi, A., Alwosheel, A., Alasaad, A. (2016). Heart rate variability estimation in photoplethysmography signals using Bayesian learning approach. Healthcare Technology Letters, 3(2): 136-142. https://doi.org/10.1049/htl.2016.0006
[11] Tafreshi, A.S., Klamroth-Marganska, V., Nussbaumer, S., Riener, R. (2015). Real-time closed-loop control of human heart rate and blood pressure. IEEE Transactions on Biomedical Engineering, 62(5): 1434-1442. https://doi.org/10.1109/TBME.2015.2391234
[12] Mahri, N., Gan, K.B., Meswari, R., Jaafar, M.H., Mohd. Ali, M.A. (2017). Utilization of second derivative photoplethysmographic features for myocardial infarction classification. Journal of Medical Engineering & Technology, 41(4): 298-308. https://doi.org/10.1080/03091902.2017.1299229
[13] Gao, S.C., Wittek, P., Zhao, L., Jiang, W.J. (2016). Data-driven estimation of blood pressure using photoplethysmographic signals. In 2016 38th Annual International Conference of the IEEE Engineering in Medicine and Biology Society (EMBC), IEEE, 766-769. https://doi.org/10.1109/EMBC.2016.7590814
[14] Abdullah, S., Hafid, A., Folke, M., Lindén, M., Kristoffersson, A. (2023). A novel fiducial point extraction algorithm to detect C and D points from the acceleration photoplethysmogram (cnd). Electronics, 12(5): 1174. https://doi.org/10.3390/electronics12051174
[15] Allen, J. (2007). Photoplethysmography and its application in clinical physiological measurement. Physiological Measurement, 28(3): R1. https://doi.org/10.1088/0967-3334/28/3/R01
[16] Subasi, A. (2019). Biomedical signals. Practical Guide for Biomedical Signals Analysis Using Machine Learning Techniques, 27-87. https://doi.org/10.1016/B978-0-12-817444-9.00002-7
[17] Meglinski, I. (2015). Biophotonics for medical applications. Elsevier. https://doi.org/10.1016/C2013-0-16335-0
[18] Utami, N., Setiawan, A.W., Zakaria, H., Mengko, T.R., Mengko, R. (2013). Extracting blood flow parameters from photoplethysmograph signals: a review. In 2013 3rd International Conference on Instrumentation, Communications, Information Technology and Biomedical Engineering (ICICI-BME), IEEE, 403-407. https://doi.org/10.1109/ICICI-BME.2013.6698535
[19] Liu, D., Görges, M., Jenkins, S.A. (2012). University of queensland vital signs dataset: development of an accessible repository of anesthesia patient monitoring data for research. Anesthesia & Analgesia, 114(3): 584-589. https://doi.org/10.1213/ANE.0b013e318241f7c0
[20] Nitzan, M., Khanokh, B., Slovik, Y. (2001). The difference in pulse transit time to the toe and finger measured by photoplethysmography. Physiological Measurement, 23(1): 85. https://doi.org/10.1088/0967-3334/23/1/308
[21] Harju, J., Tarniceriu, A., Parak, J., Vehkaoja, A., Yli-Hankala, A., Korhonen, I. (2018). Monitoring of heart rate and inter-beat intervals with wrist plethysmography in patients with atrial fibrillation. Physiological Measurement, 39(6): 065007. https://doi.org/10.1088/1361-6579/aac9a9
[22] Hoog Antink, C., Mai, Y., Peltokangas, M., Leonhardt, S., Oksala, N., Vehkaoja, A. (2021). Accuracy of heart rate variability estimated with reflective wrist-PPG in elderly vascular patients. Scientific Reports, 11(1): 8123. https://doi.org/10.1038/s41598-021-87489-0
[23] Nardelli, M., Vanello, N., Galperti, G., Greco, A., Scilingo, E.P. (2020). Assessing the quality of heart rate variability estimated from wrist and finger ppg: a novel approach based on cross-mapping method. Sensors, 20(11): 3156. https://doi.org/10.3390/s20113156
[24] Sun, S., Bezemer, R., Long, X., Muehlsteff, J., Aarts, R.M. (2016). Systolic blood pressure estimation using PPG and ECG during physical exercise. Physiological Measurement, 37(12): 2154. https://doi.org/10.1088/0967-3334/37/12/2154
[25] Zuzarte, I., Indic, P., Sternad, D., Paydarfar, D. (2019). Quantifying movement in preterm infants using photoplethysmography. Annals of Biomedical Engineering, 47: 646-658. https://doi.org/10.1007/s10439-018-02135-7
[26] Nagy, Á., Földesy, P., Jánoki, I., Terbe, D., Siket, M., Szabó, M., Varga, J., Zarándy, Á. (2021). Continuous camera-based premature-infant monitoring algorithms for NICU. Applied Sciences, 11(16): 7215. https://doi.org/10.3390/app11167215
[27] Alonzo, C.J., Nagraj, V.P., Zschaebitz, J.V., Lake, D.E., Moorman, J.R., Spaeder, M.C. (2018). Heart rate ranges in premature neonates using high resolution physiologic data. Journal of Perinatology, 38(9): 1242-1245. https://doi.org/10.1038/s41372-018-0156-1
[28] Hernando, A., Pelaez, M.D., Lozano, M.T., Aiger, M., Gil, E., Lázaro, J. (2017). Finger and forehead PPG signal comparison for respiratory rate estimation based on pulse amplitude variability. In 2017 25th European Signal Processing Conference (EUSIPCO), IEEE, pp. 2076-2080. https://doi.org/10.23919/EUSIPCO.2017.8081575
[29] Sun, S.X., Peeters, W.H., Bezemer, R., Long, X., Paulussen, I., Aarts, R.M., Noordergraaf, G.J. (2019). Finger and forehead photoplethysmography-derived pulse-pressure variation and the benefits of baseline correction. Journal of Clinical Monitoring and Computing, 33: 65-75. https://doi.org/10.1007/s10877-018-0140-5
[30] Liang, Y.B., Chen, Z.C., Liu, G.Y., Elgendi, M. (2018). A new, short-recorded photoplethysmogram dataset for blood pressure monitoring in China. Scientific Data, 5(1): 1-7. https://doi.org/10.1038/sdata.2018.20
[31] Elgendi, M. (2016). Optimal signal quality index for photoplethysmogram signals. Bioengineering, 3(4): 21. https://doi.org/10.3390/bioengineering3040021
[32] Park, J., Seok, H.S., Kim, S.S., Shin, H. (2022). Photoplethysmogram analysis and applications: an integrative review. Frontiers in Physiology, 12: 808451. https://doi.org/10.3389/fphys.2021.808451
[33] Allen, J., Murray, A. (2004). Effects of filtering on multisite photoplethysmography pulse waveform characteristics. In Computers in Cardiology, IEEE, 2004: 485-488. https://doi.org/10.1109/CIC.2004.1442980
[34] Peng, F.L., Zhang, Z.B., Gou, X.M., Liu, H.Y., Wang, W.D. (2014). Motion artifact removal from photoplethysmographic signals by combining temporally constrained independent component analysis and adaptive filter. Biomedical Engineering Online, 13(1): 1-14. https://doi.org/10.1186/1475-925X-13-50
[35] Cvetkovic, D., Übeyli, E.D., Cosic, I. (2008). Wavelet transform feature extraction from human PPG, ECG, and EEG signal responses to ELF PEMF exposures: a pilot study. Digital Signal Processing, 18(5): 861-874. https://doi.org/10.1016/j.dsp.2007.05.009
[36] Wójcikowski, M. (2021). Real-time ppg signal conditioning with long short-term memory (LSTM) network for wearable devices. Sensors, 22(1): 164. https://doi.org/10.3390/s22010164
[37] Pankaj, Kumar, A., Komaragiri, R., Kumar, M. (2022). Reference signal less fourier analysis based motion artifact removal algorithm for wearable photoplethysmography devices to estimate heart rate during physical exercises. Computers in Biology and Medicine, 141: 105081. https://doi.org/10.1016/j.compbiomed.2021.105081
[38] Liang, Y.B., Elgendi, M., Chen, Z.C., Ward, R. (2018). An optimal filter for short photoplethysmogram signals. Scientific Data, 5(1): 1-12. https://doi.org/10.1038/sdata.2018.76
[39] Kwon, J.H., Kim, S.E., Kim, N.H., Lee, E.C., Lee, J.H. (2022). Preeminently robust neural ppg denoiser. Sensors, 22(6): 2082. https://doi.org/10.3390/s22062082
[40] Waugh, W., Allen, J., Wightman, J., Sims, A.J., Beale, T.A.W. (2018). Novel signal noise reduction method through cluster analysis, applied to photoplethysmography. Computational and Mathematical Methods in Medicine, 2018. https://doi.org/10.1155/2018/6812404
[41] Kavitha, K., Vasuki, S., Karthikeyan, B. (2021). PPG signal denoising using a new method for the selection of optimal wavelet transform parameters. Journal of University of Shanghai for Science and Technology, 23(10): 687-699.
[42] Zhang, Z.L. (2015). Photoplethysmography-based heart rate monitoring in physical activities via joint sparse spectrum reconstruction. IEEE Transactions on Biomedical Engineering, 62(8): 1902-1910. https://doi.org/10.1109/TBME.2015.2406332
[43] Zhang, Z.L., Pi, Z.Y., Liu, B.Y. (2014). TROIKA: a general framework for heart rate monitoring using wrist-type photoplethysmographic signals during intensive physical exercise. IEEE Transactions on Biomedical Engineering, 62(2): 522-531. https://doi.org/10.1109/TBME.2014.2359372
[44] Přibil, J., Přibilová, A., Frollo, I. (2020). Comparative measurement of the PPG signal on different human body positions by sensors working in reflection and transmission modes. Engineering Proceedings, 2(1): 69. https://doi.org/10.3390/ecsa-7-08204
[45] Tarvirdizadeh, B., Golgouneh, A., Khodabakhshi, E., Tajdari, F. (2017). An assessment of a similarity between the right and left hand photoplethysmography signals, using time and frequency features of heart-rate-variability signal. In 2017 IEEE 4th International Conference on Knowledge-Based Engineering and Innovation (KBEI), IEEE, pp. 0588-0594. https://doi.org/10.1109/KBEI.2017.8324868