Chiman Haydar Salh*![]() | Abbas M. Ali
| Abbas M. Ali![]()
© 2023 IIETA. This article is published by IIETA and is licensed under the CC BY 4.0 license (http://creativecommons.org/licenses/by/4.0/).
OPEN ACCESS
As one of the most prevalent and lethal diseases afflicting women today, breast cancer detection remains a pivotal area of focus. Although mammogram images, exploited in Computer-Aided Design (CAD) systems, provide an early detection avenue, their reliability for accurate recognition of tumor density types and sizes, particularly in type C and D breasts, is questionable. To address this challenge, a novel approach for tumor identification, categorization, and size estimation in various breast types is put forth in this study. In the proposed model, features are extracted from a mammographic image analysis dataset using a pre-trained Convolutional Neural Network (CNN) architecture for left-right comparison, followed by the deployment of ResNet152V2 for distinguishing between the four mammogram types (A, B, C, and D). Subsequently, normal, and abnormal breasts are differentiated within the mammogram images. The final step employs a Mask Region-Based Convolutional Neural Network (Mask R-CNN) to discern malignant from benign tumors and to estimate tumor size. The experimental outcomes demonstrate an impressive 100% overall accuracy in type comparison using ResNet152V2, thereby substantiating its viability as a model for mammogram type detection and classification. This study thus provides a compelling argument for the application of ResNet152V2 in the context of breast cancer detection and diagnosis.
Mask R-CNN, ResNet152V2, mammogram, CNN, breast tumor
Cancer, due to its late discovery, is regarded as one of the most genetically destructive and life-threatening diseases known today. The diagnosis can be determined by examining the patient's medical records, observing the signs and symptoms exhibited, or through advanced imaging techniques. Among these, imaging has been recognized as the most precise method for accurate diagnosis. Machine learning plays a crucial role in this process, presenting vital information to medical professionals, thereby enabling them to draw informed conclusions [1].
Mammograms are specialized x-rays used for examining breast tissue. They are performed using a device equipped with two plates that are specifically designed for this purpose. This device differs from standard x-ray machines as it utilizes lower levels of radiation. Mammography has the potential to facilitate the early detection of breast cancer, often before any symptom indicative of the disease is identified by medical professionals. This allows for the diagnosis of breast cancer in its earliest, and most treatable, stages. X-ray tests are instrumental in medical treatment procedures [2].
Cancer is characterized by the abnormal proliferation of cells within the body, with the potential to metastasize throughout. Often referred to as malignancy, over a hundred types of cancer have been identified, including notably breast cancer. Symptoms of cancer are diverse and largely depend on the specific type of cancer, leading to significant challenges in detection and diagnosis. This issue has impeded early treatment, which is critical for patient survival. Cancer treatment typically involves surgery, radiation, and chemotherapy [3].
The limitations of mammography have led to the adoption of Computer-Aided Detection (CAD) in the field. This technology assists radiologists in interpreting images more accurately by providing a reliable, computerized second opinion, which mitigates the risk of human error. The effectiveness and reliability of CAD led to its approval by the US Food and Drug Administration in 1998. It is now widely utilized in medical institutions and treatment centers globally. Current studies are investigating the effectiveness of using CAD for breast cancer image screening and evaluating its impact on radiologist performance [4].
Radiologists have significantly benefited from the integration of computer technology in their diagnostic procedures, enhancing the accuracy of patient diagnoses. The approval of computer programs for use in the medical field has notably improved radiologists' capacity to conduct diagnostic screenings, particularly in identifying anomalies in the breasts of female patients. This computer-assisted approach, known as Computer-Aided Detection (CAD), utilizes specialized software that can detect abnormalities within the body and assist radiologists in interpreting images, thereby reducing the likelihood of false-negative results that could potentially jeopardize patient health [5].
CAD has proven invaluable in the medical field by facilitating early detection of breast cancer and reducing instances of oversight by radiologists. Moreover, it alleviates the workload of radiologists compared to relying on human observers for second opinions in disease detection. This technology has ushered in efficient, reliable, and carefully monitored work systems. Algorithms developed for CAD identify features that are of interest to radiologists. For instance, in breast cancer screening, CAD algorithms are designed to detect speculated and non-speculated masses, microcalcifications, and distortions. The CAD system typically identifies features corresponding to the algorithm, after which the radiologist interprets the results to guide patient examinations. Occasionally, false CAD marks may occur, in which case the radiologist can address the issue either by issuing a false interpretive negative report or by conducting further evaluations. CAD algorithms utilize digitized data and analyze images in a digital format [6].
However, the method is not without its drawbacks. It can be time-consuming for radiologists to interpret the images accurately, and complex physical features leading to tissue overlap in x-ray projections can affect the images analyzed. The accuracy of mammography is contingent on various factors, including breast density, the radiologist's knowledge and expertise, and the structure of the breast. It is noteworthy that 70% of missed breast cancer detections in second readings are a result of inadequate interpretation of results, while 30% are due to overlooked lesions [7].
The overarching goal of this research is to bolster the early detection and diagnosis of breast cancer through mammogram-based strategies. Early screening, classification, and segmentation of breast cancer can substantially contribute to the broader application of Computer-Aided Detection (CAD). Utilizing deep learning in the primary detection and classification of breast cancer stands as a potent weapon in the fight against this disease [8].
Three of the most frequently employed methods for diagnosing and distinguishing breast cancer patients are MRI, CT scans, and mammography, among various other available techniques. A key limitation of existing CAD systems lies in their lengthy detection times, which restrict their application in real-world hospital or laboratory settings. Despite achieving real-time detection, some CADs compromise on accuracy [9]. In contrast, the Convolutional Neural Network (CNN) has demonstrated its superior capacity to deliver a notable improvement in the results obtained, when compared to other traditional methods [10].
The remarkable advancements in deep learning models have supplanted the process of manual feature creation. Instead, a deep learning-based model automatically learns and identifies essential features that are most relevant to our case, enabling the detection of necessary tumors [11]. An additional advantage of deep learning models over traditional ones is their ability to learn at multiple levels of representation. Consequently, deep models can learn a broad spectrum of data representations, beginning with raw data and progressing through higher levels of abstraction to achieve an optimal representation, thereby completing the learning process [12, 13].
The proposed system is composed of three methods. First, our system utilizes the Convolutional Neural Network (CNN) method for right and left mammograms after appropriately resizing and reshaping them to detect masses. The second method examines the varying types of image density in the mammography dataset and determines the dissimilarity between normal and malignant breast cancer using ResNet152V2. The third method encompasses differentiating between several abnormal mammogram types and deploying a comprehensive detection and categorization model based on Mask R-CNN to identify both benign and malignant tumors, as well as to pinpoint the size of the tumor region.
A significant advantage of using Mask R-CNN in this study is its ability to execute precise tumor detection and instance segmentation concurrently. This feature is particularly beneficial in the given context where delineating the exact boundaries of tumors within an image is vital for diagnosis and treatment planning. By predicting segmentation masks along with object bounding boxes, Mask R-CNN can provide more granular information about the location and extent of tumors in an image.
This research distinguishes itself from previous studies through the following notable contributions:
The paper is structured as follows: Initially, related research concerning the developed CADs responsible for classifying and detecting breast cancer is presented. This is followed by an introduction to the specifics of the targeted 2-path detection of abnormal tumors in the breast and the mass categorization phase, and a detailed overview of the proposed approach architecture. Lastly, we present all the experiments conducted to validate the effectiveness of the proposed approach and to compare it with other recent advancements in the field of breast cancer localization.
Table 1. Compared to previous research that used mammography images to diagnose breast cancer
|
Paper Title |
Datasets |
Algorithms |
Results |
|
A Deep Learning Framework to classify Breast Density with Noisy Labels Regularization [14] |
DDM-Spain |
Confusion Matrix-CNN model |
85% |
|
Fully automated breast density segmentation and classification using deep learning [15] |
INbreast dataset |
(GAN, CNN) |
98.7% |
|
Combining VGG16, Mask R-CNN, and Inception V3 to identify the benign and malignant of breast microcalcification clusters [16] |
DICOM data |
VGG16, Mask R-CNN |
93.3%, 95.5% |
|
Detection and classification the breast tumors using Mask R-CNN on sonograms [17] |
ultrasound |
Mask R-CNN |
85% |
|
Classification and Segmentation of Breast Tumor Using Mask R-CNN on Mammograms [18] |
CBIS-DDSM |
Mask R-CNN |
85% |
One of the most popular diseases among women is breast cancer. For the doctor to diagnose breast cancer, patients typically need to undergo mammography screening and MRI breast cancer imaging.
Numerous individuals are using deep learning in their papers for segmentation or classification due to the advancement of deep learning techniques in many domains. As a result, deep learning technology is used in this paper to find clusters of malignant and benign in the mammography images. It is thought that it will assist doctors in diagnosing patients more quickly, providing them with the most effective course of treatment. Table 1 lists some literature reviews about this technique.
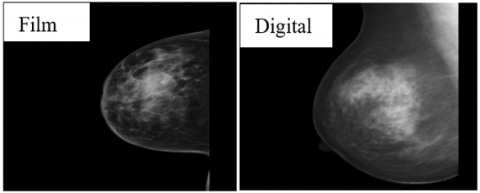
The techniques of the types of mammography include film-screen mammography and digital mammography. Digital mammography is also referred to as full-field digital mammography (FFDM). They are different though they use the same techniques, as the film screen mammography images are in form of photographic films while in digital mammography, digital files are recorded in a computer show Figure 1 and have been worked on type digital mammography in this research [19]. Two images are included for each patient in the dataset, which has 510 images from 255 patients, 133 of whom have cancer and 117 of whom just have lumps. They have gathered breast cancer image from Erbil hospital (Zheen) and range in age from 25 to 70, this hospital contains special part for breast cancer test using mammography images and regularly visited by the patients. Based on our permission given from the hospital and cooperation from Dr. And Dr the dataset has been constructed. The (RadiAnt DICOM Viewer) application, a medical program utilized in all hospitals, has scaled the data in all datasets. Each image is 512 by 512 pixels in size and color image, which is thought to be the ideal size for displaying cancer images based on other rates that have been researched.
Figure 1. Digital mammography with screen-film mammography
The project was to compare breast density divided into four categories. The mammograms were classified into four categories by two experienced radiologists presented from lowest to highest amounts of fibro glandular tissue composition. Category A: Almost entirely fatty (least amount of fibro glandular tissue) about 10% of women are like this. Category B: Scattered fibro glandular tissue about 40% of women are like this. Category C: Heterogeneously dense about 40% of women are like this. Category D: Extremely dense (most amounts of fibro glandular tissue) about 10% of women are like this shown in Table 2. In types, C and D the doctor has a problem for to specify the location of the tumors because of the highest density in this image. In this case, the patient should take an MRI image because they compared clinical breast examination, mammography, US, and MRI have found that MRI is the most accurate method for detecting tumor response and a residual tumor, with a sensitivity of 86-92%, specificity of 60-86%, and accuracy of 90%.
Table 2. Breast density types and density percentage is percentage-based, where each category comprises a range of percentages
|
Breast Types |
Density Percentage |
Breast Density |
|
Type A (fatty breast) |
<25% |
10% |
|
Type B (Scattered fibro glandular) |
<50% |
40% |
|
Type C (Heterogeneously dense) |
>50% |
40% |
|
Type D (Extremely dense) |
>75% |
10 |
Deep learning has been extensively used in image analysis for several clinical applications. However, most studies [19, 20] are focused on disease detection and diagnosis by analyzing images acquired at a one-time point during patient care [21].
Lately, many promising deep-learning computer vision models-particularly Convolutional Neural Networks (CNN), transfer learning techniques, and deep learning-based object detection models-showed notable increases in the performance of CAD systems. For CAD systems, several algorithms based on deep learning models have been suggested. DL introduced a CAD tool for mass detection, segmentation, and classification of mammographic images with minimal user intervention [22, 23].
4.1 Convolutional neural network (CNN)
The CNN learning approach effectively trains several layers [24]. This technique is effective and frequently applied in various computer vision applications. The convolutional layer, the pooling layer, and the fully connected layer are the three main layers that make up the CNN network. Each layer completes a variety of duties [25]. Multiple 2D matrices are taken into consideration for the convolutional layer's input and output while classifying images. The use of an equal number of input and output matrices is not constrained. To extract the input image's regional attributes, local feature extraction is used [26, 27]. The main objective of the learning technique here is to achieve a few kernel matrices in this work, the first inception of the Convolutional Neural Network is the type of deep learning technique. After resizing and reshaping the image it means the action of preprocessing has been proposed CNN is modelled to separate the right and left breast cancer images. This process is performed with various layers of the convolution approach to make a simple new model for CNN it was composed of six layers and it has a high accuracy of 99.3% shown in Figure 2.
Figure 2. Convolutional neural network architecture one layer
Figure 3. ResNet152V2 architecture
4.2 ResNet152V2
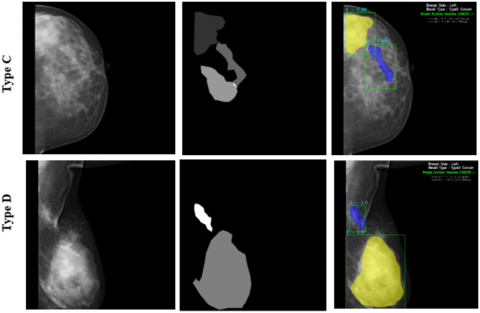
Figure 4. Breast density samples are four types
Figure 5. Comparison between normal and abnormal and the type of breast
ResNet152V2 is a deep CNN architecture that was just introduced. Architecture has recently experienced widespread success in medical imaging applications [28]. ResNet bypasses a few convolution levels at once by using residual blocks with skip connections between layers. This architecture has been found effective for providing a compact representation of input images and improving the classification task performance because it hastened the convergence of a greater number of deep layers. The ResNet features a few standard architectures that denote the number of deep layers, such as ResNet-50, ResNet-101, and ResNet-152. As an alternative, ResNet architecture offered a better ResNetV2 in which the final ReLU was eliminated to open the shortcut path utilizing a straightforward identity connection [29, 30]. In this work, the method used was ResNet152V2 architectures for comparison between four types of density (A, B, C, and D) of mammograms according to the density seen in mammography and detection between normal and abnormal shown in Figures 3, 4, and 5.
4.3 Mask R-CNN
Since the Mask R-CNN is an expansion and improvement over the Faster R-CNN, it is the most advanced neural network and is utilized mostly for instance segmentation. Mask R-CNN is typically used for some form of object detection, but as it can be generalized over a variety of datasets, as indicated in their initial research, it is also an ideal choice for the majority of medical image analysis-based research [31]. Faster R-CNN was once used for drawing bounding boxes and also categorizing the input image, Mask R-CNN is an expanded version of Faster R-CNN [32] with the advent of Mask R-CNN, which takes the complete architecture of a Faster R-CNN and adds another branch concurrently with the current branch used for object mask prediction [33]. Mask R-CNN may be applied to a large number of other datasets and is simple to train. One technique for object recognition and segmentation is Mask R-CNN. It can construct a bounding box for the target object as well as further mark and categorize whether the pixels in the bounding box belong to the object or not, allowing for the identification of the object, marking of the object's boundary, and detection of critical spots [34]. To identify various things in an image and create a bounding box that separates malignant from benign ones, this study uses Mask R-CNN for object detection shown in Figure 6. The area of the mammography where the malignant tumor is concentrated is referred to as an ROI in this context. After determining the tumor’s size, the Radiant program must be used to determine the sizes shown in Figure 7. The ROI (region of interest) for each mammography is specific to the mammogram shown in Figure 8.
Figure 6. Mask R-CNN architecture
Figure 7. Example breast cancer detection using Mask R-CNN
Figure 8. Example of applying mammogram (a) breast mammogram image; (b) the Mask R-CNN in the dataset is used to find the (region of interest)
The early identification of breast cancer has made it possible to treat it when it is still in its early stages. A commercial computer-aided detection (CAD) system was examined in breast cancer research using an independent, multicenter dataset, and the results showed that the system detects a higher proportion of breast tumors that present as masses [35]. In the past, detection, classification, and segmentation have all been applied to mammograms, MRIs, and other cancer screening methods like those mentioned above. To produce results that were equivalent to or even better than those of the past while giving us a competitive advantage, it was important to create a creative strategy that was both more effective and time-saving [36]. The main goal of this study is to create a model that can effectively detect tumors between normal, malignant, and benign and also classify types of the breast from mammograms image. The proposed architecture is composed of three main phases. In the beginning, collected the dataset as mentioned above, and then the dataset was passed into three sections.
5.1 Data augmentation algorithm (DAA)
Large datasets are preferable for DL models when they are applied. When training with very little data, overfitting can be avoided by using one of the most common techniques for expanding the dataset: data augmentation. In this work, a set of transformations can be used to add to the training data. DAA is used to enhance the amount of input data. transformed vertically. An input image will result in two images in this manner the intricate data augmentation algorithm is shown in Table 3.
Table 3. Data augmentation algorithm
|
Algorithm |
|
import os import cv2 import NumPy as np DIR=os.listdir(dir) Print (DIR) directory="./Desktop/flip" for img in DIR: path image=os. path.join(dir, img) print (path image) image=cv2.imread (path image) # image=cv2.cvtColor (image, cv2.COLOR_BGR2GRAY) image=cv2.flip (image, 1) os.chdir (directory) cv2.imwrite("flip-"+img, image) |
5.2 Data resizing
Redundancy in the input data must be removed at this step because it just increases the computational complexity of the network without significantly enhancing the outcome. This is made possible with the aid of Python/keras preprocessing library. After experimenting with several image dimensions, we've settled on an image dimension of 512 by 512, which reduces the size of the image dimensions by 48×48. keeping image readability while utilizing computational complexity effectively.
5.3 Data reshaping
Figure 9. The detailed proposed model for mammograms
This stage is used to customize the input layer of ResNet-152V2 to accommodate the input shape for our preprocessed dataset (ImgWidth=48, ImgHeight=48, NoChannels=1). This is achieved with the help of Python/keras preprocessing library.
The three main phases of the model start after the finished dataset. The first stage is using CNN to compare right mammography and left mammography. The second stage uses ResNet-152V2 for different types (A, B, C, and D) of breast mammography images and the difference between normal and abnormal. The third and final is using Mask R-CNN for classification between normal, malignant, and benign, and also been working on extracting the size of the area of the tumor. Every 790 pixels of an image is equal to 1 cm as radiology doctors used to find the area size by using (Radiant DICOM Viewer) program on the base of every 790 pixels of the image is equal to 1cm as has been mentioned, then used Mask R-CNN to detect ROI and size the area of tumor of it for each image ss illustrated in Eq. (1) shows the flowchart of our proposed system is in Figure 9.
$Area \,\,\, tumor=\frac{ { area \, Mask }}{790 \, { pixel }}$ (1)
These work experiments were run on python. Python best programming language for deep learning, data science, and machine learning, and used anaconda is a distribution of the Python and R programming languages for scientific computing. Tensor flow version=1.15.0, is a free and open-source software library for machine learning. It can be used across a range of tasks but has a particular focus on training and inference of deep neural networks. Keras version=2.2.5, is an open-source software library that provides a Python interface for artificial neural networks. Keras acts as an interface for the TensorFlow library. OpenCV (Open Source Computer Vision Library) is a library of programming functions mainly aimed at real-time computer vision. PyCharm is an integrated development environment (IDE) used in computer programming, specifically for the Python language Table 4 shows the hyperparameters for the TensorFlow-based Mask R-CNN framework.
Table 4. Tensor flow-based Mask R-CNN
|
BATCH_SIZE |
1 |
|
DETECTION_MAX_INSTANCES |
100 |
|
DETECTION_MIN_CONFIDENCE |
0.9 |
|
GPU_COUNT |
1 |
|
IMAGES_PER_GPU |
2 |
|
LEARNING_RATE |
0.001 |
|
NUM_CLASSES |
3 |
|
STEPS_PER_EPOCH |
100 |
|
WEIGHT_DECAY |
0.0001 |
|
VALIDATION_STEPS |
50 |
|
USE_MINI_MASK |
True |
Python 3 and a GPU were used to execute the experiments in this paper. The Keras package was used to implement the improved Mask R-CNN. The data set was split into three sections: an 80% training set for model optimization results, a 10%, testing data set (unseen data) for model assessment and recording testing results, and a 10% validation dataset for model optimization. First, Using the mammography images and fine positioning images that the doctor provided, has been will learn the clusters of calcification points, separate clusters and non-clusters, and train the CNN model. Then submit the breast image classification results to the right and left professional doctors, who will manually mark the clusters before the system uses the ResNet152V2 model to extract the features of the clusters. difference between the types of breast density and normal or abnormal mammography images, the backdrop outside the breast must then be removed. Finally, the model is used to Mask R-CNN to classify the benign or malignant clusters and find tumors size. They have been adapted to some parameters of the optimized Mask R-CNN for each experimental batch size=1 and epochs=50. The results and the testing of each experiment will be discussed in detail.
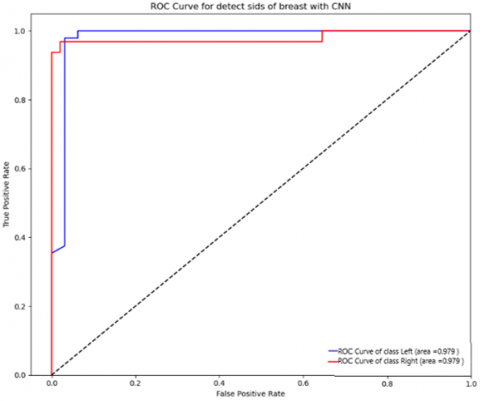
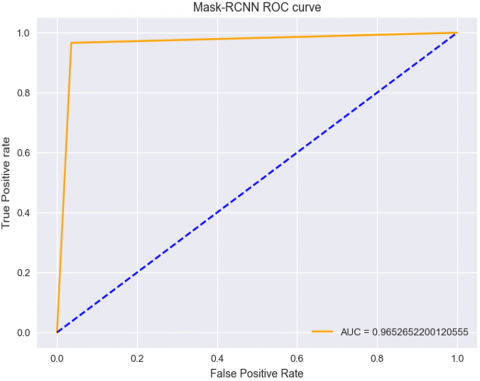
In this work, first, features have been selected from the dataset has been collected in the hospital. After that, three feature-selection algorithms namely, CNN, ResNet152V2, and Mask R-CNN. In general, the system consists of three models for breast mammogram images. A convolutional neural network cluster calcification is shown in Table 5, that CNN has a 0.98 per cent accuracy rate for right and left, and Table 6 shows the Breast density type classification performance using the ResNet152V2 algorithm with a 0.98% per cent accuracy rate. Then, Table 7 follows depicts the breast cancer detection performance of Mask R-CNN has a 0.97% per cent accuracy rate. The accuracy, specificity, and sensitivity of our suggested approaches are also around 0.98%, 0.99%, and 97%, respectively. Figure 10 depicts the FPR and TPR outcome obtained using the CNN detector on the test dataset. Figures 11 and 12 show that the ResNet152V2 classifier is on the test dataset. This demonstrates the validity of our study. As illustrated in Eq. (2) to Eq. (6), the models are evaluated using four methods: accuracy (AC), precision (PR), sensitivity (SE), and F-Score (FS), specificity (SP), where TP indicates true positive, TN indicates true negative, FP indicates false positive, and FN indicates false negative.
Figure 10. Mean receiver operating characteristic (ROC) analysis results on the entire data set, including comparisons between right and left breast by using CNN, roc curve of class left=0.979 and roc curve of class right=0.979 and area under the curve (AUC)=0.979 the total training time was 2.26 second
$\mathrm{SE}=\frac{T P}{T P+F N}$ (2)
$\mathrm{PR}=\frac{T P}{T P+F P}$ (3)
$\mathrm{SP}=\frac{T N}{T N+F P}$ (4)
$\mathrm{F}-$ Score $=\frac{2 \times { Percision } \times { Sensitivity }}{ { Percision }+ { Sensitivity }}$ (5)
$\mathrm{AC}=\frac{T P+T N}{T P+T N+F P+F N}$ (6)
Table 5. Breast cancer classification performance of CNN for right and left
|
Method |
Sensitivity |
Precision |
Specificity |
F-Score |
Accuracy |
|
Right |
0.983 |
0.974 |
0.973 |
0.973 |
0.985 |
|
Left |
0.973 |
0.986 |
0.983 |
0.976 |
0.973 |
Table 6. Breast density type classification performance ResNet152V2
|
Method |
Sensitivity |
Precision |
Specificity |
F-Score |
Accuracy |
|
|
Type A |
Abnormal |
0.963 |
1.000 |
1.000 |
0.981 |
0.981 |
|
Normal |
1.000 |
1.000 |
1.000 |
1.000 |
1.000 |
|
|
Type B |
Abnormal |
0.885 |
1.000 |
0.85 |
0.939 |
0.939 |
|
Normal |
1.000 |
0.893 |
0.96 |
0.943 |
0.943 |
|
|
Type C |
Abnormal |
1.000 |
0.840 |
0.96 |
0.913 |
0.913 |
|
Normal |
1.000 |
0.960 |
0.97 |
0.980 |
0.980 |
|
|
Type D |
Abnormal |
1.000 |
1.000 |
1.000 |
1.000 |
1.000 |
|
Normal |
1.000 |
0.957 |
0.96 |
0.978 |
0.978 |
|
Table 7. Breast cancer classification performance of Mask R-CNN
|
Mask R-CNN |
Sensitivity |
Precision |
Specificity |
F-Score |
Accuracy |
|
Malignant |
0.966 |
0.987 |
0.964 |
0.976 |
0.965 |
|
Benign |
0.964 |
0.920 |
0.966 |
0.941 |
0.965 |
Figure 11. Area under the curve (area=1.000) by using ResNet152V2
Figure 12. Mean receiver operating characteristic (ROC) analysis results on the entire data set, including the types of breasts and distinguishing between normal and abnormal on a mammogram image. ROC curve of class type A (normal and abnormal)=1.000, type B (normal and abnormal)=0.999, type C (normal and abnormal)=0.998, type D (normal and abnormal)=1.000 the total training time was 0.01 second
Figures 13 and 14 depict the Precision-Recall outcome obtained from the use of the mask RCNN detector on the test dataset. The Mask RCNN model has demonstrated exceptional performance in accurately detecting and classifying various types and sizes of breast cancer tumors. The precision confidence of the model exceeded 96%, as depicted in the figures presented.
Figure 15 shows the plot for the accuracy metric comparing the training accuracy and testing accuracy results attained during the training procedure. The figure shows that both accuracy curves are rising steadily as training progresses with a higher ceiling level for training accuracy, which for ResNet152V2 was only reached after 40 epochs. After 70 epochs, an average testing accuracy of 97.5% of the total testing accuracy was recorded, with the train and validation accuracy levels varying between 98% and 99.8%.
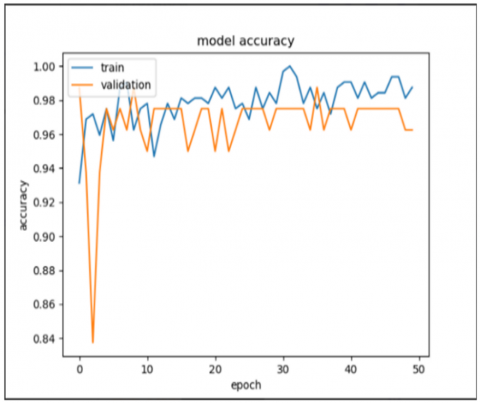
Additionally, Figure 16 shows the accuracy of CNN as determined during the training and validation procedure. Both accuracy curves are rising progressively as training progresses with a higher ceiling level for training accuracy, which for CNN was only reached after 10 epochs. After 100 epochs, the average testing accuracy was 99% of the total testing accuracy while the train and validation accuracy level fluctuated between 98% and 99.8%. Table 8 shows the distribution of each type of breast image in the training, validation, and test sets. The total of 414 images in the training set, 43 images in the validation set, and 43 images in the test set.
Figure 13. The precision-recall curve of Mask R-CNN at learning rate=0.969 in the training set the total training time was 5.54 seconds
Figure 14. Area under the curve (area=0.965) by using Mask R-CNN
Figure 15. Training/validation accuracies vs. number of epochs (ResNet152V2)
Figure 16. Training/validation accuracies vs. number of epochs (CNN)
Figure 17. Examples, breast density type to cancer area detection based on the algorithms
Table 8. Distribution of each type of breast image in training, validation and test set
|
|
Type A |
Type B |
Type C |
Type D |
|
Training |
120 |
100 |
111 |
83 |
|
Validation |
10 |
10 |
11 |
12 |
|
Test |
10 |
10 |
11 |
12 |
Figure 17 shows that in the given dataset, each row corresponds to a specific density category, while each column represents the resulting image output using a particular preprocessing technique. The initial column depicted the original images, while the second and third columns depicted the images subsequent to the application of adjustments to the region of interest (ROI) and density type, as well as the tumor image, through the utilization of Mask R-CNN.
8.1 Comparative performance analysis
Table 9. Phase-comparison between the suggested approach with other previously released breast mass detection and categorization approaches
|
Authors |
Methodology |
Dataset |
Proposed Method |
Accuracy |
|
Raza et al. [18] |
Mask R-CNN |
DICOM data |
cancerous tumors for classification and segmentation |
85% |
|
Hsieh et al. [16] |
VGG 16, Mask R-CNN, Inception V3 |
DICOM data |
Tumor classification and segmentation |
87%, 89% and 90% |
|
Chiao et al. [17] |
Mask R-CNN |
Collected the primary ultrasound images with biopsy histological and diagnostic reports from China |
The method provides a comprehensive and noninvasive way to detect and classify breast lesions. |
85% |
|
Soltani et al. [37] |
Mask R-CNN |
INbreast dataset |
automatic breast mass segmentation method based on the Mask R-CNN model of deep learning using detection 2 |
95.8% |
|
Our proposed |
CNN, ResNet152V2, Mask R-CNN |
Collected the primary mammogram images diagnostic report from Erbil |
breast cancer detection, classification, segmentation, size of the tumor, and types of breast |
99.3% 100% and 98% |
Table 10. Accuracy of different breast density types classifications in terms of their best results
|
Authors |
Model |
No. of Image |
No. of Density |
Accuracy |
|
Mohamed et al. [38] |
Deep Learning |
925 |
BI-RADS II and BI-RADS III |
94% |
|
Dubrovina et al. [39] |
Deep Learning |
40 |
4 Classes |
80% |
|
Gandomkar et al. [40] |
Deep Learning |
3813 |
Dense and Fatty |
92% |
|
Saffari et al. [15] |
Deep Learning |
410 |
4 Classes |
98.75% |
|
Lopez-Almazan et al. [14] |
Deep Learning |
892 |
BI-RADS 1 and BI-RADS 4 |
85% |
|
Our proposed ResNet152V2 |
Deep Learning |
510 |
Breast Type (A, B, C, and D) |
100% |
Comparison of results of breast cancer mammogram detection algorithms based on a collected dataset in Erbil hospital. With the help of radiologists, doctor data is utilized in the research and has high accuracy where all the medical image data is on the selected subjects. Breast cancer could be seen in every mammogram, but the locations, kinds, and forms of the lesions vary. All samples were split into training sets, test sets, and validation sets at random. Comparison of the models based on the algorithms employed and the utilized Mask R-CNN. Table 9 presents the findings for comparison with those of the other studies.
The proposed work's routine has been compared to the investigation's current condition, and Table 10 compares the planned work to earlier studies that have been published. Based on the use of several methods in the DL model, comparison of breast type density, the overall number of cases taken into consideration for the experiment, accuracy, and coefficient, a comparative study has been carried out.
This paper presented a comprehensive methodology for the optimal diagnosis of breast cancer by mammography. The methodology of this research goes through three stages as described above the first stage used CNN to comparative between right and left breasts the result showed 99.3% after that the second stage used ResNet152V2 for the difference between types of breasts have four types and compare between normal and abnormal breast cancer the result showed 100% finally, the third stage is if the breast cancer was abnormal it goes the Mask R-CNN for comparing between malignant and benign the result was 98%. Another work used Mask R-CNN for the area of tumor size.
In the opinion of these two radiology doctors who have seen the model, they have checked they support that is better than others.
This algorithm can be improved further to offer a far more sophisticated solution for locating and eliminating cancer cells in the detected area by making a few additional developments as technology advances in the future, and can be implemented for another cases of cancer like lung cancer.
At the end of this work, this research was supported by two radiology doctors at Erbil Hospital by name (Dr. Sawen Khasrow Dizay, and Lana R.A. Pshtiwan). The authors would like to express their deep gratitude to the two doctors.
[1] Sarwar Kamal, M., Dey, N., Ashour, A.S. (2017). Large scale medical data mining for accurate diagnosis: A blueprint. Handbook of Large-Scale Distributed Computing in Smart Healthcare, 157-176. https://doi.org/10.1007/978-3-319-58280-1_7
[2] Sheba, K.U., Gladston Raj, S. (2018). An approach for automatic lesion detection in mammograms. Cogent Engineering, 5(1): 1444320. https://doi.org/10.1080/23311916.2018.1444320
[3] Cramer, H., Lauche, R., Klose, P., Lange, S., Langhorst, J., Dobos, G.J. (2017). Yoga for improving health‐related quality of life, mental health and cancer‐related symptoms in women diagnosed with breast cancer. Cochrane Database of Systematic Reviews, (1). https://doi.org/10.1002/14651858.CD010802.pub2
[4] Sekou, T.B., Hidane, M., Olivier, J., Cardot, H. (2019). From patch to image segmentation using fully convolutional networks--application to retinal images. arXiv Preprint arXiv: 1904.03892. https://doi.org/10.48550/arXiv.1904.03892
[5] Rodríguez-Ruiz, A., Krupinski, E., Mordang, J.J., Schilling, K., Heywang-Köbrunner, S.H., Sechopoulos, I., Mann, R.M. (2019). Detection of breast cancer with mammography: Effect of an artificial intelligence support system. Radiology, 290(2): 305-314. https://doi.org/10.1148/radiol.2018181371
[6] Tan, Y.J., Sim, K.S., Ting, F.F. (2017). Breast cancer detection using convolutional neural networks for mammogram imaging system. In 2017 International Conference on Robotics, Automation and Sciences (ICORAS), IEEE, 1-5. https://doi.org/10.1109/ICORAS.2017.8308076
[7] Jung, H., Kim, B., Lee, I., Yoo, M., Lee, J., Ham, S., Woo, O., Kang, J. (2018). Detection of masses in mammograms using a one-stage object detector based on a deep convolutional neural network. PloS One, 13(9): e0203355. https://doi.org/10.1371/journal.pone.0203355
[8] Roslidar, R., Rahman, A., Muharar, R., Syahputra, M.R., Arnia, F., Syukri, M., Pradhan, B., Munadi, K. (2020). A review on recent progress in thermal imaging and deep learning approaches for breast cancer detection. IEEE Access, 8: 116176-116194. https://doi.org/10.1109/ACCESS.2020.3004056
[9] Hamed, G., Marey, M., Amin, S., Tolba, M. (2021). Comparative study and analysis of recent computer aided diagnosis systems for masses detection in mammograms. International Journal of Intelligent Computing and Information Sciences, 21(1): 33-48. https://doi.org/10.21608/IJICIS.2021.56425.1050
[10] Fatima, N., Liu, L., Hong, S., Ahmed, H. (2020). Prediction of breast cancer, comparative review of machine learning techniques, and their analysis. IEEE Access, 8: 150360-150376. https://doi.org/10.1109/ACCESS.2020.3016715
[11] Khoshnaw, K.H.K., Shwany, Z.A.A., Mustafa, T., Ismail, S.K. (2022). Mobile recommender system based on smart city graph. Indonesian Journal of Electrical Engineering Computer Science, 25(3): 1771-1776. https://doi.org/10.11591/ijeecs.v25.i3
[12] Hirra, I., Ahmad, M., Hussain, A., Ashraf, M.U., Saeed, I.A., Qadri, S.F., Alghamdi, A.M., Alfakeeh, A.S. (2021). Breast cancer classification from histopathological images using patch-based deep learning modeling. IEEE Access, 9: 24273-24287. https://doi.org/10.1109/ACCESS.2021.3056516
[13] Yassin, N.I.R., Omran, S., El Houby, E.M.F., Allam, H. (2018). Machine learning techniques for breast cancer computer aided diagnosis using different image modalities: A systematic review. Computer Methods and Programs in Biomedicine, 156: 25-45. https://doi.org/10.1016/j.cmpb.2017.12.012
[14] Lopez-Almazan, H., Pérez-Benito, F.J., Larroza, A., Perez-Cortes, J.C., Pollan, M., Perez-Gomez, B., Trejo, D.S., Casals, M., Llobet, R. (2022). A deep learning framework to classify breast density with noisy labels regularization. Computer Methods and Programs in Biomedicine, 221: 106885. https://doi.org/10.1016/j.cmpb.2022.106885
[15] Saffari, N., Rashwan, H.A., Abdel-Nasser, M., Kumar Singh, V., Arenas, M., Mangina, E., Herrera, B., Puig, D. (2020). Fully automated breast density segmentation and classification using deep learning. Diagnostics, 10(11): 988. https://doi.org/10.3390/diagnostics10110988
[16] Hsieh, Y.C., Chin, C.L., Wei, C.S., Chen, I.M., Yeh, P.Y., Tseng, R.J. (2020). Combining VGG16, Mask R-CNN and inception V3 to identify the benign and malignant of breast microcalcification clusters. In 2020 International Conference on Fuzzy Theory and Its Applications (iFUZZY), IEEE, pp. 1-4. https://doi.org/10.1109/iFUZZY50310.2020.9297809
[17] Chiao, J.Y., Chen, K.Y., Liao, K.Y.K., Hsieh, P.H., Zhang, G., Huang, T.C. (2019). Detection and classification the breast tumors using Mask R-CNN on sonograms. Medicine, 98(19): e15200. https://doi.org/10.1097/MD.0000000000015200
[18] Raza, S.K., Sarwar, S.S., Syed, S.M., Khan, N.A. (2021). Classification and segmentation of breast tumor using Mask R-CNN on mammograms. https://doi.org/10.21203/rs.3.rs-523546/v1
[19] Chilamkurthy, S., Ghosh, R., Tanamala, S., Biviji, M., Campeau, N.G., Venugopal, V.K., Mahajan, V., Rao, P., Warier, P. (2018). Deep learning algorithms for detection of critical findings in head CT scans: a retrospective study. The Lancet, 392(10162): 2388-2396. https://doi.org/10.1016/S0140-6736(18)31645-3
[20] Ardila, D., Kiraly, A.P., Bharadwaj, S., Choi, B., Reicher, J.J., Peng, L., Tse, D., Etemadi, M., Ye, W.X., Corrado, G., Naidich, D.P., Shetty, S. (2019). End-to-end lung cancer screening with three-dimensional deep learning on low-dose chest computed tomography. Nature Medicine, 25(6): 954-961. https://doi.org/10.1038/s41591-019-0447-x
[21] Lee, H., Yune, S., Mansouri, M., Kim, M., Tajmir, S.H., Guerrier, C.E., Ebert, S.A., Pomerantz, S.R., Romero, J.M., Kamalian, S., Gonzalez, R.G., Lev, M.H., Do, S. (2019). An explainable deep-learning algorithm for the detection of acute intracranial haemorrhage from small datasets. Nature Biomedical Engineering, 3(3): 173-182. https://doi.org/10.1038/s41551-018-0324-9
[22] Jiang, Y.M., Liang, X.K., Wang, W., Chen, C.L., Yuan, Q.Y., Zhang, X.D., Li, N., Chen, H., Yu, J., Xie, Y.Q., Xu, Y.K., Zhou, Z.W., Li, G.X., Li, R.J. (2021). Noninvasive prediction of occult peritoneal metastasis in gastric cancer using deep learning. JAMA Network Open, 4(1): e2032269. https://doi.org/10.1001/jamanetworkopen.2020.32269
[23] Topol, E.J. (2019). High-performance medicine: the convergence of human and artificial intelligence. Nature Medicine, 25(1): 44-56. https://doi.org/10.1038/s41591-018-0300-7
[24] Cai, W., Mohammaditab, R., Fathi, G., Wakil, K., Ebadi, A.G., Ghadimi, N. (2019). Optimal bidding and offering strategies of compressed air energy storage: A hybrid robust-stochastic approach. Renewable Energy, 143: 1-8. https://doi.org/10.1016/j.renene.2019.05.008
[25] Acharya, U.R., Oh, S.L., Hagiwara, Y., Tan, J.H., Adeli, H. (2018). Deep convolutional neural network for the automated detection and diagnosis of seizure using EEG signals. Computers in Biology and Medicine, 100: 270-278. https://doi.org/10.1016/j.compbiomed.2017.09.017
[26] Lee, C., Yoon, J., Van Der Schaar, M. (2019). Dynamic-deephit: A deep learning approach for dynamic survival analysis with competing risks based on longitudinal data. IEEE Transactions on Biomedical Engineering, 67(1): 122-133. https://doi.org/10.1109/TBME.2019.2909027
[27] Lee, G., Kang, B., Nho, K., Sohn, K.A., Kim, D. (2019). MildInt: Deep learning-based multimodal longitudinal data integration framework. Frontiers in Genetics, 10: 617. https://doi.org/10.3389/fgene.2019.00617
[28] Ragab, D.A., Attallah, O., Sharkas, M., Ren, J.C., Marshall, S. (2021). A framework for breast cancer classification using multi-DCNNs. Computers in Biology and Medicine, 131: 104245. https://doi.org/10.1016/j.compbiomed.2021.104245
[29] Tsochatzidis, L., Koutla, P., Costaridou, L., Pratikakis, I. (2021). Integrating segmentation information into CNN for breast cancer diagnosis of mammographic masses. Computer Methods and Programs in Biomedicine, 200: 105913. https://doi.org/10.1016/j.cmpb.2020.105913
[30] Yu, X., Kang, C., Guttery, D.S., Kadry, S., Chen, Y., Zhang, Y.D. (2020). ResNet-SCDA-50 for breast abnormality classification. IEEE/ACM Transactions on Computational Biology and Bioinformatics, 18(1): 94-102. https://doi.org/10.1109/TCBB.2020.2986544
[31] Ren, S.Q., He, K.M., Girshick, R., Sun, J. (2015). Faster R-CNN: Towards real-time object detection with region proposal networks. IEEE Transactions on Pattern Analysis and Machine Intelligence, 39(6): 1137-1149. https://doi.org/10.1109/TPAMI.2016.2577031
[32] Anantharaman, R., Velazquez, M., Lee, Y. (2018). Utilizing Mask R-CNN for detection and segmentation of oral diseases. In 2018 IEEE International Conference on Bioinformatics and Biomedicine (BIBM), IEEE, 2197-2204. https://doi.org/10.1109/BIBM.2018.8621112
[33] Paste, A.S., Chickerur, S. (2019). Analysis of instance segmentation using Mask-CNN. In 2019 2nd International Conference on Intelligent Computing, Instrumentation and Control Technologies (ICICICT), IEEE, 1: 191-196. https://doi.org/10.1109/ICICICT46008.2019.8993224
[34] Hu, Q.H., Souza, L.F.D.F., Holanda, G.B., Alves, S.S.A., Silva, F.H.D.S., Han, T., Reboucas Filho, P.P. (2020). An effective approach for CT lung segmentation using mask region-based convolutional neural networks. Artificial Intelligence in Medicine, 103: 101792. https://doi.org/10.1016/j.artmed.2020.101792
[35] Morra, L., Sacchetto, D., Durando, M., Agliozzo, S., Carbonaro, L.A., Delsanto, S., Pesce, B., Persano, D., Mariscotti, G., Marra, V., Fonio, P., Bert, A. (2015). Breast cancer: Computer-aided detection with digital breast tomosynthesis. Radiology, 277(1): 56-63. https://doi.org/10.1148/radiol.2015141959
[36] Dabbous, F.M., Dolecek, T.A., Berbaum, M.L., Friedewald, S.M., Summerfelt, W.T., Hoskins, K., Rauscher, G.H. (2017). Impact of a false-positive screening mammogram on subsequent screening behavior and stage at breast cancer diagnosis. Cancer Epidemiology, Biomarkers & Prevention, 26(3): 397-403. https://doi.org/10.1158/1055-9965.EPI-16-0524
[37] Soltani, H., Amroune, M., Bendib, I., Haouam, M.Y. (2021). Breast cancer lesion detection and segmentation based on Mask R-CNN. In 2021 International Conference on Recent Advances in Mathematics and Informatics (ICRAMI), IEEE, 1-6. https://doi.org/10.1109/ICRAMI52622.2021.9585913
[38] Mohamed, A.A., Berg, W.A., Peng, H., Luo, Y.H., Jankowitz, R.C., Wu, S.D. (2018). A deep learning method for classifying mammographic breast density categories. Medical Physics, 45(1): 314-321. https://doi.org/10.1002/mp.12683
[39] Dubrovina, A., Kisilev, P., Ginsburg, B., Hashoul, S., Kimmel, R. (2018). Computational mammography using deep neural networks. Computer Methods in Biomechanics and Biomedical Engineering: Imaging & Visualization, 6(3): 243-247. https://doi.org/10.1080/21681163.2015.1131197
[40] Gandomkar, Z., Suleiman, M.E., Demchig, D., Brennan, P.C., McEntee, M.F. (2019). BI-RADS density categorization using deep neural networks. In Medical Imaging 2019: Image Perception, Observer Performance, and Technology Assessment, SPIE, 10952: 149-155. https://doi.org/10.1117/12.2513185