Yiting Zhang*![]() | Haibo Lun
| Haibo Lun![]()
© 2023 IIETA. This article is published by IIETA and is licensed under the CC BY 4.0 license (http://creativecommons.org/licenses/by/4.0/).
OPEN ACCESS
With rapid economic and urban progression, water resource and environmental challenges have become increasingly evident. This research focuses on water environment monitoring in the Beijing-Tianjin-Hebei region, employing advanced remote sensing and image processing methodologies. A technique was developed to extract the spatial location features of water bodies using remote sensing image segmentation. In addition, a novel spectral feature extraction technique predicated on a double inverse Gaussian model was introduced. This innovative method adeptly captures the contours of absorption peaks, facilitating the expression and extraction of spectral characteristics inherent to the water bodies. These methodologies were primarily designed to offer both theoretical and technical insights into the spatial distribution and temporal dynamics of the water environment. The outcomes of this study are comprehensively examined, with potential enhancements and prospective trends in water environment monitoring elucidated.
remote sensing images, Beijing-Tianjin-Hebei region, water environment monitoring
Amidst the backdrop of rapid economic growth and urbanization, challenges concerning water resources and their environments have become increasingly salient [1-3]. Regions of pronounced economic, political, and cultural significance, characterized by extensive populations and burgeoning industrial activities [4], have been observed to face an escalating demand for water resources [5]. Owing to inherent regional climatic factors and natural conditions, water resources are reported to be limited [6]. Contemporary challenges, encompassing water pollution, deterioration of aquatic ecosystems, and increasing water environment risks, have emerged [7, 8]. It has been suggested that the security and well-being of the water environment are pivotal for sustainable regional development [9]. Consequently, timely and precise monitoring and evaluation of the water environment in the Beijing-Tianjin-Hebei region of China have been deemed imperative [10].
Remote sensing, recognized for its non-contact, wide-ranging, and high-frequency observation capacities, has been proposed as a viable technique to scrutinize the water environment in the Beijing-Tianjin-Hebei region [11]. The attributes of remote sensing, including high spatial-temporal resolution, extensive area coverage, and real-time observation [12-14], render it advantageous, especially when traditional field monitoring methods often encounter constraints such as time, geographical limitations, and financial costs [15]. In water environment assessments, the application of remote sensing has been widely acknowledged for its ability to effectively discern spectral attributes, spatial distributions, and temporal modifications of water bodies [16, 17]. Simultaneously, advances in image processing technology, which primarily focuses on the analysis and processing of remote sensing imagery, have bolstered its application in water environment studies. Enhanced resolution of remote sensing images and capabilities for processing large datasets have fostered its appeal [18-20]. Through refined image processing methodologies, insights into water bodies, identification of pollution sources, and alterations in water quality can be swiftly acquired from remote sensing imagery [21-23]. Such technologies have been noted to offer substantial assistance for water resource management, aligning seamlessly with diverse water environment scenarios and monitoring prerequisites [24, 25].
This research pivots on the evaluation of water environment monitoring methodologies in the Beijing-Tianjin-Hebei region, anchored by remote sensing and image processing innovations. The subsequent section delineates a technique for extracting spatial location attributes of water bodies based on remote sensing image segmentation. Thereafter, a spectral feature extraction method rooted in a double-inverse Gaussian model is explicated. This methodology is recognized for aptly depicting the contour of absorption peaks, thereby facilitating the extraction of water body spectral characteristics, and offering theoretical and technical insights into the spatial and temporal dynamics of the water environment. Conclusively, the study's findings, potential enhancements, and emerging trends in water environment monitoring are detailed.
For effective water environment monitoring within the Beijing-Tianjin-Hebei region, it is essential that both spectral and spatial position features of water bodies are accurately obtained. The diagnostic spectral features extracted from remote sensing images serve as crucial tools for analyzing parameters of water quality and overall water environment conditions. Such spectral features have been observed to reflect concentrations of suspended particles, chlorophyll-a, and dissolved organic matter, all of which are pivotal indicators for water quality assessments. Through the analysis of these spectral features, real-time pollution levels of water bodies within the Beijing-Tianjin-Hebei region can be determined, thereby providing a scientific foundation for pollution control efforts. Conversely, spatial position feature extraction through image segmentation effectively discriminates water body areas from other terrestrial features in remote sensing images. This distinction offers insights into the spatial distribution of water bodies, facilitating the identification of pollution origins, analysis of water body dynamics, and risk assessments of the water environment. By exploring the relationships between water bodies, pollution diffusion routes, and the efficacy of water environment protection measures, spatial position features prove indispensable for water resource management and protection. Thus, the combined extraction of diagnostic spectral and spatial position features is paramount for enhancing water environment monitoring within the Beijing-Tianjin-Hebei region.
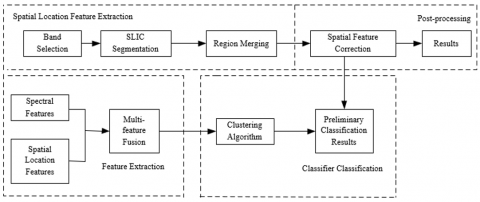
To optimize water quality assessments, pollution source identification, and monitoring of water body dynamics, spatial position features are extracted, primarily relying on remote sensing image segmentation. Initially, a selection of bands based on spectral features is performed to refine the spectral data of water bodies. Such a process has been reported to hone the precision of remote sensing image processing, ensuring a more accurate differentiation between water bodies and other terrestrial features. This in turn heightens the fidelity of water environment monitoring. Subsequently, the results of the SLIC segmentation are integrated to address the frequent issue of over-segmentation observed with SLIC methods. By employing spatial features for the preliminary classification's refinement, issues like salt-and-pepper noise and fragmented misclassification are effectively rectified, further enhancing classification accuracy. The entire methodology for water remote sensing image classification is depicted in Figure 1.
Figure 1. Overall framework of water remote sensing image classification
Figure 2. Schematic diagram of the region adjacency graph
For the segmentation of hyperspectral remote sensing images within the Beijing-Tianjin-Hebei region, the fast region adjacency graph method is utilized to consolidate superpixel blocks. This method has been lauded for its efficiency in merging neighboring superpixel blocks that are similar, reducing instances of over-segmentation and ensuring the preservation of water body boundaries. Crucially, during the merging phase, the spatial relationships between pixels are taken into account, mitigating the potential for incorrect merges of non-adjacent yet similar regions. This precision ensures segmentation outcomes align more accurately with real-world conditions. The schematic framework of the region adjacency graph is illustrated in Figure 2.
Following SLIC segmentation of the water environment remote sensing image, it is assumed that the pseudocolor image, represented as T, comprises L sub-regions, denoted by EL={E1L,E2L,...,ELL}. The pixel set within each sub-region is expressed as EjL={oj,1,oj,2,...,oj,||EjL||}. In these remote sensing image samples, the characteristics of each sub-region are defined by the mean squared error parameter. Assuming the pixel count in each region is represented by ||E||, the subsequent equation is derived:
$\omega \left( E_{L}^{j} \right)=\frac{1}{\left\| E_{L}^{j} \right\|}\sum\limits_{u=1}^{\left\| E_{L}^{j} \right\|}{T\left( {{o}_{j}},u \right)}$ (1)
The mean squared error of each sub-region can then be calculated using the following equation:
$R\left( E_{L}^{j} \right)=\sum\limits_{u=1}^{\left\| E_{L}^{j} \right\|}{{{\left[ T\left( {{o}_{j}},u \right)-\omega \left( E_{L}^{j} \right) \right]}^{2}}}$ (2)
Assuming that the adjacency between sub-regions is represented by U(u, k), the dissimilarity function between regions can be further calculated based on the results of the previous equation:
$\sigma \left( E_{L}^{*u},E_{L}^{*k} \right)=\frac{\left\| E_{L}^{*u} \right\|\cdot \left\| E_{L}^{*k} \right\|}{\left\| E_{L}^{*u} \right\|+\left\| E_{L}^{*k} \right\|}{{\left[ \omega \left( E_{L}^{*u} \right)-\omega \left( E_{L}^{*k} \right) \right]}^{2}}U\left( u,k \right)$ (3)
In the scenario where two sub-regions are adjacent, the assigned adjacency value U(u,k) is determined to be 1. Conversely, for non-adjacent sub-regions, the adjacency value U(u,k) approaches positive infinity. Utilizing the outcomes from the aforementioned equation, the dissimilarity between regions is then computed. It has been chosen in this study to conjoin sub-regions based on their dissimilarity, culminating in a reduction of the number of remote sensing images of the water environment to L-U post-merging. The elucidated steps underscore the principle underlying the segmentation of water environment remote sensing images centered on region merging. Figure 3 offers a comprehensive schematic detailing the mechanics of node merging.
Figure 3. Schematic diagram of node merging
Given the intrinsic high-dimensionality and voluminous data characterizing hyperspectral images, band selection grounded on spectral features becomes pivotal. Such an approach facilitates the filtration of the most indicative bands, thereby diminishing data dimensions. Consequently, this curtails the intricacy involved in data processing, preserving computational resources and minimizing time expenditures. It has been observed that in remote sensing images, the analogous spectral features spanning disparate objects could engender spectral confusion. The act of earmarking bands that exemplify the disparities between regions has been shown to ameliorate this spectral confusion dilemma, amplifying the capacity for object differentiation. Thus, in the specific realm of water environment monitoring within the Beijing-Tianjin-Hebei region, the necessity for spectral feature-based band selection in remote sensing imagery becomes pronounced. The metric of mean squared error, identified as a salient spectral feature, proves instrumental in discerning bands that optimally underscore regional differences. The incorporation of these selected bands in the region merging operation has been proven to augment the precision of the remote sensing image segmentation process.
For the extraction of bands boasting the peak mean squared error values in water environment remote sensing images, it becomes imperative to initially compute the mean squared error values spanning various bands. Under the presumption that the water environment remote sensing image, denoted as S, encompasses M bands, and the dimensions of each band image is characterized by l×b, the average pixel value across each band is captured by Nm¯. Subsequently, the formula for deducing the mean squared error for each distinct band is encapsulated in the ensuing equation:
${{f}_{m}}=\frac{1}{lb}\sum\nolimits_{u=1}^{lb}{\left| {{n}_{u}}-\overline{{{N}_{m}}} \right|}$ (4)
In the domain of water environment surveillance within the Beijing-Tianjin-Hebei region, when endeavoring to identify efficacious bands from images captured under heterogeneous light sources, a direct ranking based on mean squared error values may culminate in the selected data predominantly originating from a singular light source, thereby engendering information redundancy. Clustering methodologies, adept at conglomerating data with analogous traits, permit the nomination of the most emblematic bands within each cluster. This strategy is instrumental in preserving multi-source data, thereby elevating the precision and resilience of the remote sensing image interpretation. Through clustering, similar regions spanning diverse light sources and bands are systematically grouped, mitigating the spectral confusion conundrum. By pinpointing the most discerning bands within each assemblage, object differentiation becomes markedly enhanced, thus optimizing classification accuracy. Figure 4 delineates the hierarchal classification methodology deployed for aquatic environments.
Figure 4. Stratified classification technique route for water environments
Within a homogeneously segmented domain, in scenarios where pixels of divergent categories coexist and a certain category is predominantly represented, it can be surmised that pixels outside this dominant category might be noise pixels or inaccurately categorized pixels. The incorporation of spatial location attributes facilitates the identification of these aberrant pixels, thereby diminishing their influence on the culminating outcomes. In the experimental framework of this research, the spatial location attributes of the water environment remote sensing imagery are predicated upon post-segmentation regions, mandating a synergistic approach between segmentation outcomes and initial classification findings. Under the premise that image T is compartmentalized into L regions, epitomized by EL={E1L,E2L,...,ELL}, the extraction is orchestrated as follows:
Step 1: The preliminary remote sensing image undergoes segmentation, orchestrating akin pixels into cohesive regions, culminating in distinct segmented territories. The segmentation outcome, represented as EL={E1L,E2L,...,ELL}, is superimposed upon the nascent classification outcome.
Step 2: Surrounding information for each segmented domain is meticulously extracted. This encompasses the classification data of proximate pixels, spatial distribution intel, and adjoining texture specifics. A systematic tally of variant pixel types within each segmented region is conducted.
Step 3: A spatial relationship paradigm, grounded on proximate information, is formulated. This model, in tandem with spectral traits, coalesces to spawn an integrated feature set. The category M, with the predominant pixel presence in each segmented region, is identified, and subsequently, the proportion μ of these categorized pixels within the entire sub-region of the remote sensing water environment image is computed.
Step 4: The results emanating from the remote sensing image processing are rigorously evaluated, leading to the extraction of spatial location features (Mu, μu) pertinent to each region.
Assessing the quality of water bodies, implementing sound water resource protection strategies, and safeguarding human sustenance and advancement are indispensable, underlining the paramountcy of water environment monitoring. Within this context, the method of spectral feature extraction, underpinned by the double inverted Gaussian model, has emerged as a salient approach. This method, by aptly capturing the contour of absorption peaks, enhances the accuracy and stability of spectral feature extraction. Its inherent adaptability permits compatibility across diverse aquatic environments and varying environmental conditions. Particularly in the Beijing-Tianjin-Hebei region, distinguished by its scarce water resources and pressing environmental concerns, this approach promises robust technical support for comprehensive water monitoring, quality assessment, and the drafting of effectual protective measures.
In recorded remote sensing imagery, it is noted that the spectral data from water bodies are often tainted by exogenous variables including atmospheric conditions, topographical features, and the sun's elevation angle. Concurrently, spectral measurement discrepancies might manifest during image procurement. Such perturbations necessitate normalization, which is recognized to attenuate the magnitude of these spectral discrepancies. In this context, envelope removal methodology has been chosen for the preprocessing of aquatic spectral data, facilitating the mitigation of the aforementioned non-water factors and thus enhancing the fidelity of spectral feature extraction.
Given a discrete set of water environment spectral imagery, let it be denoted by e(u), where u spans the range 0,1,..., j-1. The correlative wavelength can be depicted as q(u), consistent with the range of u. The inception of the envelope node is discerned at e(0), q(0), while its termination is identified at u, with k incrementing to u+1. When u and k are connected, and their intersection with the spectral curve is identified, the ensuing observations were made: if a singular intersection point is discerned, and values along the connecting line supersede the spectral curve, then e(k), q(k) is appended to the envelope node. The start and end nodes of the envelope are subsequently redefined. In instances where this condition is unmet, k is incremented, perpetuating the search for intersections.
Upon amalgamating all envelope nodes, the sought-after aquatic environmental spectral envelope is attained. The values encompassing the nodes on this spectral envelope are denoted by g(u), consistent with the range of u=0,1,..., j-1. The formulation of the envelope can be discerned from the ensuing equation, which is constructed based on the outlined procedural steps:
$g\left( u \right)\ge e\left( u \right)$ (5)
The envelope removal normalization algorithm for water body spectrum can be characterized by the following equation:
${{{e}'}^{\left( u \right)}}={e\left( u \right)}/{g\left( u \right)}\;,u=0,1,\cdots ,j-1$ (6)
Given the spectral absorption peak's diagnostic significance for terrestrial objects and its semblance to an inverted yet asymmetric Gaussian shape, the conventional single inverted Gaussian model is observed to face challenges in adequately portraying such asymmetries. A superior alternative is presented by the double inverted Gaussian model, which integrates two inverted Gaussian functions, thereby offering a more precise representation of the asymmetric absorption peak shape. Such enhancement in representation inherently elevates the accuracy of spectral feature extraction. Consequently, within the purview of aquatic environment monitoring research in the Beijing-Tianjin-Hebei region, the double inverted Gaussian model has been employed to delineate diagnostic spectral characteristics.
Absorption peaks within aquatic spectra are attributed to electronic transitions and oscillations occurring within water bodies. For the purposes of this research, it has been posited that the energy distribution within the aquatic absorption spectrum is of a random nature. Within this framework, the energy is represented by z, the amplitude by s, the mean by ω, and the standard deviation by δ. An ensuing equation delineates the Gaussian distribution simulation pertinent to a specific absorption band in the aquatic spectrum:
$h\left( z \right)=s\cdot \exp \left\{ \frac{-{{\left( z-\omega \right)}^{2}}}{2{{\delta }^{2}}} \right\}$ (7)
Given that random variables attributed to electronic transitions are associated with the average bond length, and the absorption energy follows a power-law relationship, it is recognized that the aquatic spectral absorption peak shape manifests asymmetry. Given these complexities, this investigation has posited that the absorption peak position is symbolized by O and efforts were made to pinpoint O in proximity to the aquatic spectral absorption peak. Subsequent to these steps, the double inverted Gaussian model was formulated. An ensuing equation elucidates the expression for the normalized spectrum:
$\left\{ \begin{align} & d\left( z \right)=1-{{s}_{1}}\text{exp}\left( \frac{-{{\left( z-{{\omega }_{1}} \right)}^{2}}}{\delta _{1}^{2}} \right),z<O \\ & d\left( z \right)=1-{{s}_{2}}\text{exp}\left( \frac{-{{\left( z-{{\omega }_{2}} \right)}^{2}}}{\delta _{2}^{2}} \right),z\ge O \\\end{align} \right.$ (8)
Satisfying ω=ω1=ω2, s=s1=s2.
For the purpose of ascertaining the efficacy of the devised model in aligning with aquatic characteristic absorption peaks, a comparative analysis with alternative fitting techniques was undertaken in this research. Such a comparative stance facilitated an objective assessment of the merits and limitations inherent to the double inverted Gaussian model when applied to fitting vegetation characteristic absorption peaks, laying a foundation for ensuing investigations. The equation delineating the quadratic polynomial fitting is presented as follows:
$t=s{{z}^{2}}+nz+v$ (9)
The cubic polynomial fitting formula is given by the following equation:
$t=s{{z}^{3}}+n{{z}^{2}}+vz+f$ (10)
The double Gaussian function fitting formula is given by the following equation:
$t={{s}_{1}}\text{exp}\left( \frac{-{{\left( z-{{\omega }_{1}} \right)}^{2}}}{\delta _{1}^{2}} \right)+{{s}_{2}}\text{exp}\left( \frac{-{{\left( z-{{\omega }_{2}} \right)}^{2}}}{\delta _{2}^{2}} \right)$ (11)
From Figure 5, it's evident that as the number of subregions increases, so does the segmentation accuracy for remote sensing images in the Beijing-Tianjin-Hebei water monitoring scenario. Yet, a saturation point appears around 200 subregions, after which there's a diminishing return in accuracy improvement. This suggests that beyond this threshold, optimal segmentation granularity is achieved. The proposed method, centered on remote sensing image segmentation, has shown its capability in enhancing segmentation accuracy, underpinning the significance of this approach for the Beijing-Tianjin-Hebei water environment monitoring.
Figure 5. Line chart illustrating image segmentation accuracy
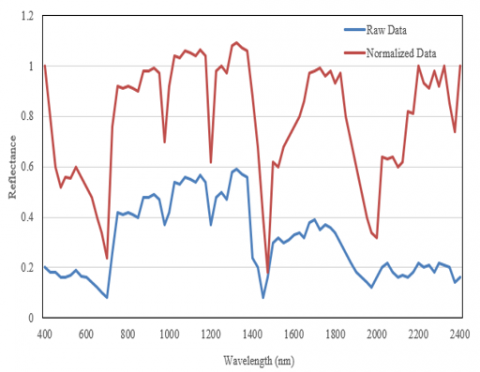
Figure 6. Spectra post envelope-removal
(1)
(2)
Figure 7. The juxtaposition of turbidity attributes with absorption peak symmetry and depth across varied water samples
(1)
(2)
Figure 8. Statistical analysis of absorption peak symmetry and depth parameters
Turning to Figure 6, which displays data across wavelengths and offers both original and normalized data, post-envelope removal spectral conditions are elucidated. The normalized dataset evidences a strategic mitigation of baseline drift in the spectrum, thereby fostering a reduction in analytical errors and enhancing spectral feature discernment. Consequent to envelope removal, the absorption and reflection dynamics intrinsic to aquatic spectra become accentuated, thus streamlining the extraction of water body spectral features. This culminates in furnishing pivotal insights for the inversion of water environment parameters within the Beijing-Tianjin-Hebei region. The post-normalization spectral intensities across disparate bands uniformly align in magnitude, fortifying the comparison and appraisal of spectral features spanning multiple bands. Thus, the adopted preprocessing paradigm, anchored in the envelope removal approach, manifests its efficacy. This method appears adept at negating baseline drift and other spectral noise, foregrounding key spectral hallmarks and enhancing spectral data congruence.
Delving into Figure 7, the interplay between turbidity traits and the depth of absorption peaks across a spectrum of water samples is portrayed. The distribution among these samples exhibits heterogeneity. A tentative correlation between absorption peak depth and turbidity becomes apparent from the data: samples exhibiting pronounced absorption peak depths tend to manifest augmented turbidity levels, whereas their counterparts with diminished absorption peaks display reduced turbidity. This can be postulated to imply that water samples with pronounced turbidity harbor an elevated density of suspended particulates. Such particulate abundance escalates light scattering phenomena, thereby deepening absorption peak depths.
In Figure 8, a distinct correlation is discerned for Sample 4 between absorption peak symmetry and turbidity. As symmetry of the absorption peak augments, a concomitant decline in turbidity is observed. Such findings imply that water bodies with elevated turbidity levels likely contain an increased concentration of suspended particulates, culminating in pronounced light scattering and a consequent reduction in absorption peak symmetry. Conversely, for Samples 1, 2, and 3, this relationship is less manifest. Interference from other aquatic environmental parameters within the Beijing-Tianjin-Hebei region, such as suspended matter, algae, and dissolved organic matter, could be speculated as the causal factors. These elements introduce intricate spectral feature variations, obscuring any simplistic correlation with turbidity alone.
From the collated data, it can be inferred that the double inverted Gaussian model is adept at elucidating the relationship between turbidity attributes and absorption peak depth. Through the application of this model, a quantitative elucidation of the nexus between turbidity and absorption peak depth has been attained, enhancing the fidelity of aquatic spectral feature assessments.
Upon examination of Figure 8, the distribution of absorption peak depths exhibits a discernible pattern. A significant proportion of water samples manifest absorption peak depths primarily within the 0.7 to 0.9 range, and a symmetry predominantly between 0 and 2. This distribution may hint at analogous aquatic environmental characteristics endemic to the Beijing-Tianjin-Hebei region, such as specific turbidity levels, suspended particulates, and algal content. It was further revealed that the double inverted Gaussian model is proficient in conforming to aquatic spectral data and extracting pertinent absorption and reflection peak attributes. Such capabilities facilitate the analysis of the statistical distribution of absorption peak depth parameters, thereby bolstering the inversion of aquatic environmental parameters within the Beijing-Tianjin-Hebei ambit. Additionally, by leveraging the double inverted Gaussian model, a comparative reflection of the statistical distribution of absorption peak depth parameters was rendered. Employing this model allows for a quantitative evaluation of the dispersion of absorption peak depths across disparate water samples. Such analyses amplify the precision of aquatic spectral feature assessments and unveil intricate correlations among aquatic environmental parameters within the Beijing-Tianjin-Hebei region.
Upon examination of the data presented in Table 1, a statistical assessment of the reflectance at various wavelengths and the average reflectance across different water bodies was conducted. A discernible pattern in reflectance across different water bodies at varied wavelengths is evident. At 580nm, 705nm, and 810nm wavelengths, heightened reflectance is observed, manifesting as reflection peaks, whereas at 675nm and 741nm wavelengths, the reflectance markedly diminishes, indicating absorption valleys. Such variations are postulated to be linked to the presence of suspended particles, algae, and dissolved organic matter within these aquatic environments. The mean reflectance across the water bodies also demonstrated disparities, potentially indicative of contrasting water quality characteristics. For instance, the apex average reflectance observed in water body 5 could allude to elevated concentrations of suspended particles or algae. Conversely, the nadir in average reflectance found in water body 4 might signify diminished turbidity. In water bodies exhibiting enhanced average reflectance, higher reflectance at individual wavelengths was consistently observed, while in those demonstrating reduced average reflectance, a consistent decrease across wavelengths was noted. Such findings underscore a palpable correlation between reflectance at varied wavelengths and average reflectance.
Analysis of the data in Table 2, post envelope removal, unveils certain coherences between water quality categorizations and spectral information extraction outcomes. For example, water bodies 1, 4, and 5, categorized under II, III, and III respectively, display spectral information extraction results consistent with their categories. Such outcomes suggest that spectral data effectively mirrors the water quality categorization. Moreover, a tangible association was detected between nutrient status and spectral information extraction. Waters deemed moderately eutrophic typically corresponded to heightened categories in the spectral information extraction results. Total phosphorus was identified as the predominant pollution marker for each aquatic sample. A clear relationship between the spectral data extraction and this key pollution indicator was discerned. Hence, post spectral analysis post envelope removal, discernible associations were noted among aquatic environment categories, nutrient status, and primary pollution indicators in the Beijing-Tianjin-Hebei region with their spectral information extraction outcomes. It can be inferred that spectral data accurately mirrors the water environment characteristics of the Beijing-Tianjin-Hebei region's water bodies.
In summary, the spectral attributes of water bodies in the Beijing-Tianjin-Hebei region were evaluated using the double inverted Gaussian model. The subsequent extraction of parameters such as absorption peak depth, symmetry, and reflectance facilitated a robust statistical exploration of their distribution across diverse aquatic environments. The model's efficacy in spectral feature extraction reinforced its utility in the quantitative assessment of water environment parameters in the Beijing-Tianjin-Hebei region. Furthermore, the cohesive analysis of water quality categories, nutrient statuses, and primary pollution indicators, juxtaposed with spectral information extraction outcomes, elucidated the intrinsic relationship between these metrics and the spectral characteristics of the water bodies. Such revelations advocate for the employment of spectral data in gauging the aquatic environment in the Beijing-Tianjin-Hebei region, proffering invaluable insights conducive to astute water resource management and meticulous environmental surveillance in the area.
Table 1. Reflectance analysis at diverse wavelengths and mean reflectance across varied water bodies
|
Water Body ID |
Average Reflectance |
580nm Reflectance Step |
675nm Absorption Valley |
705nm Reflectance Peak |
741nm Absorption Valley |
810nm Reflectance Peak |
994nm |
|
1 |
0.065 |
0.093 |
0.082 |
0.096 |
0.073 |
0.093 |
0.011 |
|
2 |
0.095 |
0.167 |
0.111 |
0.132 |
0.121 |
0.187 |
0.012 |
|
3 |
0.156 |
0.247 |
0.178 |
0.276 |
0.298 |
0.264 |
0.032 |
|
4 |
0.067 |
0.096 |
0.078 |
0.096 |
0.065 |
0.083 |
0.007 |
|
5 |
0.187 |
0.388 |
0.243 |
0.238 |
0.183 |
0.274 |
0.023 |
|
6 |
0.168 |
0.224 |
0.168 |
0.168 |
0.217 |
0.231 |
0.037 |
Table 2. Core water quality metrics across different water bodies
|
Water Body Number |
Water Quality Category (Surface Water) |
Nutrient Status |
Main Pollution Indicator |
Spectral Information Extraction Results |
|
1 |
Ⅱ |
Moderately Eutrophic |
- |
Overall Category II, partial Categories I and III |
|
2 |
Ⅳ |
Moderately Eutrophic |
Total Phosphorus |
Categories II and III |
|
3 |
Ⅴ |
Moderately Eutrophic |
Total Phosphorus |
Overall Category V, partial Categories VI and IV |
|
4 |
Ⅲ |
Moderately Eutrophic |
Total Phosphorus |
Overall Category II, partial Categories I and III |
|
5 |
Ⅲ |
/ |
Total Phosphorus |
Overall Category III, partial Category IV |
|
6 |
Ⅳ |
/ |
Total Phosphorus |
Categories III and IV |
|
7 |
Ⅴ |
Moderately Eutrophic |
Total Phosphorus |
Overall Category V, partial Category IV |
In the context of monitoring the water environment in the Beijing-Tianjin-Hebei region, the efficacy of employing remote sensing coupled with image processing techniques was assessed. An approach for the extraction of spatial location features from water bodies, rooted in remote sensing image segmentation, was delineated. Furthermore, a novel spectral feature extraction strategy, anchored in the double inverted Gaussian model, was presented, demonstrating its aptitude in
depicting the absorption peak shape and isolating the spectral features inherent to these water bodies. The overarching objective behind such methodologies was elucidated as furnishing both theoretical scaffolding and instrumental guidance for comprehending the spatial distribution and evolutionary trajectories of water environments.
Empirical findings underscored the precision inherent in the image segmentation process, thereby affirming the efficacy of the delineated spatial location feature extraction approach grounded in remote sensing image segmentation. In spectral data preprocessing, the deployment of the envelope removal technique was observed to be notably efficacious. Furthermore, an intricate examination of the nexus between turbidity attributes and absorption peak symmetry and depth across various water samples was undertaken. Such explorations concluded that the double inverted Gaussian model possesses the potential to elucidate the ties between turbidity characteristics and absorption peak depth.
In a culmination of case studies, a systematic scrutiny of reflectance across disparate wavelengths and average reflectance across varied water entities was executed. Simultaneously, core aquatic quality metrics spanning different water bodies were assiduously analyzed. As a synthesis of the foregoing, several pivotal conclusions and recommendations have been delineated, which will inevitably pave the way for future research and practical applications in the realm of aquatic environment monitoring.
This paper was supported by Major Topics of Humanities and Social Sciences Research of Hebei Provincial Department of Education (Grant No.: ZD201710).
[1] Lv, A., Han, Y., Zhu, W., Zhang, S., Zhao, W. (2021). Risk assessment of water resources carrying capacity in China. JAWRA Journal of the American Water Resources Association, 57(4): 539-551. https://doi.org/10.1111/1752-1688.12936
[2] Hu, X.H., Zuo, D.P., Liu, B., Huang, Z.F., Xu, Z.X. (2022). Quantitative analysis of the correlation between macrobenthos community and water environmental factors and aquatic ecosystem health assessment in the North Canal River Basin of Beijing. Huanjing Kexue, 43(1): 247-255. https://doi.org/10.13227/j.hjkx.202104158
[3] Zhang, L.M., Cong, Y., Meng, F. Z., Wang, Z. Q., Zhang, P., Gao, S. (2021). Energy evolution analysis and failure criteria for rock under different stress paths. Acta Geotechnica, 16(2): 569-580. https://doi.org/10.1007/s11440-020-01028-1
[4] Wang, R., Ci, H., Zhang, T., Tang, Y., Wei, J.Y., Yang, H., Feng, G.F., Yan, Z. (2023). Spatial-temporal evolution characteristics of industrial carbon emissions in China’s Most Developed Provinces from 1998–2013: The Case of Guangdong. Energies, 16(5): 2249. https://doi.org/10.3390/en16052249
[5] Jin, J.L., Shen, S.X., Cui, Y., Zhang, X.Y., He, P., Ning, S.W. (2021). Dynamic evaluation of water resources carrying capacity in the Yellow River diversion irrigation district based on semipartial subtraction set pair potential. Journal of Hydraulic Engineering, 52(5): 507-520. https://doi.org/10.13243/j.cnki.slxb.20200561
[6] Ruidas, D., Pal, S. C., Saha, A., Chowdhuri, I., Shit, M. (2022). Hydrogeochemical characterization based water resources vulnerability assessment in India's first Ramsar site of Chilka lake. Marine Pollution Bulletin, 184: 114107. https://doi.org/10.1016/j.marpolbul.2022.114107
[7] Xu, J., Xu, M., Zhao, Y., Wang, S., Tao, M., Wang, Y. (2021). Spatial-temporal distribution and evolutionary characteristics of water environment sudden pollution incidents in China from 2006 to 2018. Science of the Total Environment, 801: 149677. https://doi.org/10.1016/j.scitotenv.2021.149677
[8] Zhang, L.M., Chao, W. W., Liu, Z. Z., Cong, Y., Wang, Z. Q. (2022). Crack propagation characteristics during progressive failure of circular tunnels and the early warning thereof based on multi-sensor data fusion. Geomechanics and Geophysics for Geo-Energy and Geo-Resources, 8: 172. https://doi.org/10.1007/s40948-022-00482-3
[9] Khosravi, R., Nemati Mansour, S., Ekrami, J., Mosaferi, M. (2023). Health and ecological risks assessment of heavy metals and metalloids in surface sediments of Urmia Salt Lake, Northwest of Iran. Environmental Monitoring and Assessment, 195(3): 403. https://doi.org/10.1007/s10661-023-10946-y
[10] Li, Q., Long, Z., Wang, H., Zhang, G. (2021). Functions of constructed wetland animals in water environment protection–A critical review. Science of The Total Environment, 760: 144038. https://doi.org/10.1016/j.scitotenv.2020.144038
[11] Han, W. (2021). A review of research on application of remote sensing in lake water quality monitoring. In Second International Conference on Industrial IoT, Big Data, and Supply Chain, 12128: 139-145. https://doi.org/10.1117/12.2624857
[12] Xie, W.L., Jing, X., Du, L., Zhang, M.S., Sun, P.P. (2021). A new method of land space planning based on resource and environment carrying capacity and SOM neural network. Proceedings of the 8th Academic Conference of Geology Resource Management and Sustainable Development, pp. 596-609.
[13] Riazi, F., Fidélis, T., Teles, F. (2022). Governance Arrangements for Water Reuse: Assessing Emerging Trends for Inter-Municipal Cooperation through a Literature Review. Water, 14(18): 2789. https://doi.org/10.3390/w14182789
[14] Feng, L., You, Y., Liao, W., Pang, J., Hu, R., Feng, L. (2022). Multi-scale change monitoring of water environment using cloud computing in optimal resolution remote sensing images. Energy Reports, 8: 13610-13620. https://doi.org/10.1016/j.egyr.2022.09.134
[15] Giardino, C., Brando, V. E., Gege, P., Pinnel, N., Hochberg, E., Knaeps, E., Dekker, A. (2019). Imaging spectrometry of inland and coastal waters: state of the art, achievements and perspectives. Surveys in Geophysics, 40: 401-429. https://doi.org/10.1007/s10712-018-9476-0
[16] O'Grady, J., Zhang, D., O'Connor, N., Regan, F. (2021). A comprehensive review of catchment water quality monitoring using a tiered framework of integrated sensing technologies. Science of The Total Environment, 765: 142766. https://doi.org/10.1016/j.scitotenv.2020.142766
[17] Singh, N., Nalgire, S.M., Gupta, M., Chinnasamy, P. (2022). Potential of open source remote sensing data for improved spatiotemporal monitoring of inland water quality in India: case study of Gujarat. Photogrammetric Engineering & Remote Sensing, 88(3): 155-163. https://doi.org/10.14358/PERS.21-00044R2
[18] Wang, B., Huang, J., Guo, H., Xu, W., Zeng, Q., Mai, Y., Zhu, X., Tian, S. (2022). Progress in research on inland water quality monitoring based on remote sensing. Water Resources Protection, 38(3): 117-124. https://doi.org/10.3880/j.issn.1004-6933.2022.03.016
[19] Duan, H., Cao, Z., Shen, M., Ma, J., Qi, T. (2022). Review of lake remote sensing research. National Remote Sensing Bulletin, 26(1): 3-18.
[20] Lyu, L., Song, K., Liu, G., Wen, Z., Shang, Y., Li, S. (2022). Advances in remote sensing of phycocyanin for inland waters. National Remote Sensing Bulletin, 26(1): 32-48.
[21] Gong, Z., Liang, S., Wang, X., Pu, R. (2021). Remote sensing monitoring of the bottom topography in a shallow reservoir and the spatiotemporal changes of submerged aquatic vegetation under water depth fluctuations. IEEE Journal of Selected Topics in Applied Earth Observations and Remote Sensing, 14: 5684-5693. https://doi.org/10.1109/JSTARS.2021.3080692
[22] Cao, Q., Yu, G., Sun, S., Dou, Y., Li, H., Qiao, Z. (2021). Monitoring water quality of the Haihe River based on ground-based hyperspectral remote sensing. Water, 14(1): 22. https://doi.org/10.3390/w14010022
[23] Xu, J., Xu, M., Zhao, Y., Wang, S., Tao, M., Wang, Y. (2021). Spatial-temporal distribution and evolutionary characteristics of water environment sudden pollution incidents in China from 2006 to 2018. Science of the Total Environment, 801: 149677. https://doi.org/10.1016/j.scitotenv.2021.149677
[24] Hu, X.H., Zuo, D.P., Liu, B., Huang, Z. F., Xu, Z.X. (2022). Quantitative analysis of the correlation between macrobenthos community and water environmental factors and aquatic ecosystem health assessment in the North Canal River Basin of Beijing. Huanjing Kexue, 43(1): 247-255. https://doi.org/10.13227/j.hjkx.202104158
[25] Li, J., Tian, L., Wang, Y., Jin, S., Li, T., Hou, X. (2021). Optimal sampling strategy of water quality monitoring at high dynamic lakes: A remote sensing and spatial simulated annealing integrated approach. Science of The Total Environment, 777: 146113. https://doi.org/10.1016/j.scitotenv.2021.146113